1
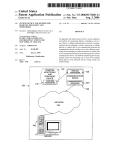
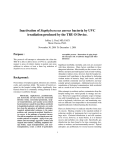
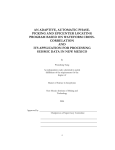
Online Near-Real-Time Seismic System for the Classroom
Joseph J. Gerencher, Jr.
Department of Physics and Earth Science, Moravian College, 1200 Main Street,
Bethlehem, PA 18018-6650, [email protected]
Michael J. Sands
Essent Corporation, 2906 William Penn Highway, Easton, PA 18045-5256,
[email protected]
ABSTRACT
develop a better way to acquire, process, and distribute
the seismic data. The immediacy of the Internet and its
A software system, named Seismic Internet Monitoring ubiquitous presence in science classrooms presented a
Application (SIMA), has been developed to allow compelling opportunity.
near-real-time display and evaluation of seismic traces
via the Internet. SIMA consists of three components: an DISCUSSION
embedded microsystem which connects directly to the
seismometer amplifier; a network-enabled server that lo- A three-axis, long-period seismograph system, using
cally displays and records the data while broadcasting homemade horizontal seismometers of the Lehman
over the Internet; and a client software application that design (Lehman, 1977), and a borrowed long-period
allows for remote display, evaluation, and storage/re- vertical seismometer, have been running at Moravian
trieval of seismic data. Because the embedded College since 1990. The seismometer traces of all four
microsystem can broadcast as many as four seismome- seismometers appear in real-time on a television screen
ters, and because the local server can connect to an arbi- located at the front of the Earth Science classroom
trary number of embedded microsystems, the user can (Gerencher and Jackson, 1991). The three orthogonal
simultaneously display signals from an arbitrary num- long-period seismometers are maintained in the
ber of seismometers. Presently, seismic signals are avail- basement of the science building immediately beneath
able from two institutions to demonstrate the the classroom, and an identical horizontal seismometer,
functionality of the system. All SIMA software compo- redundant in orientation with one of the basement units,
is located within a Plexiglas case at the rear of the
nents are available for downloading from www.phys- classroom. Students in the room can observe both the
ics.moravian.edu/seismic. Any classroom or person operation of this seismometer and how their movements
with an Internet connection can receive the seismic sig- disturb its trace on the television screen. All horizontal
nals in near-real-time by downloading and running the seismometers are adjusted to have a period of 18
SIMA client software on a computer that runs any ver- seconds, whereas the vertical seismometer has a shorter
sion of Windows from 95 through XP. Classrooms con- period. The four seismic signals are evaluated,
nected to three or more servers can use the signals to displayed, and, if seismic events are detected, stored on
locate earthquake epicenters. The system is free and the floppy disk of an Apple IIe computer by means of a
available, and will be further developed to support addi- program that was written expressly for this purpose
tional educational applications.
(Jackson and Gerencher, 1991). Student interest in the
dynamic nature of the system and on records of natural
earthquakes has been consistently high, but further
INTRODUCTION
development of the system has been limited by the
vintage computing equipment. Certain hardware
Students in the introductory Earth Science courses at components upon which this software system relies are
Moravian College have been fascinated with the no longer manufactured; indeed, they have ceased
real-time seismic traces of our homemade seismic appearing even on the used computer equipment
system, which has been in continuous operation for more market.
Although student interest in the real-time traces has
than twelve years. Traces from our four long-period
seismometers are continuously displayed in real-time on been high even when there is no seismic activity, stua television in front of the Earth Science classroom. This dents particularly enjoy those times when they are in the
system has allowed us to view and record many classroom as a seismic event is received. For these occaearthquakes, some originating on the opposite side of the sions, a surveyor’s pendulum is hung within a vertical,
earth. However, output from this system has been eight-foot tall Plexiglas case that is mounted to the wall
limited to our classroom or, at most, our local building. in the front of the classroom so students can try to view
When earthquakes are detected, the data are saved by an the unamplified motions of the room relative to the penApple IIe microcomputer and are subsequently printed dulum as the waves are propagating through our site.
Most seismic events, however, arrive when the room is
as seismograms.
unoccupied, so students are supplied with a copy of the
The printed seismograms are typically duplicated printed seismogram during the next class period. Confor distribution to students and, by mail, to colleagues at tact the web site, www.physics.moravian.edu/seismic,
other institutions who possess similar seismometers. The for photographs of the room setup, construction details
mail delay and the variation in appearance from of the seismometers and the pendulum, example system
institution to institution has limited their effective use in output, a schematic diagram of the amplifier circuit, and
the classroom. Yet, for these many years, we have been an illustrated description of the history and development
pleased with our system and its performance, and have of this system.
been glad to share our successes, via these analog
There have been several major limitations of this
representations, with students, friends, and interested system: time resolution has been poor due to the drifting
colleagues. To further exploit the educational computer clock and the inability to precisely set it; the
potentialities of our seismic equipment we needed to station has been isolated from all others that possess
182
Journal of Geoscience Education, v. 52, n. 2, March, 2004, p. 182-185
Figure 2. Display screen showing active traces from
four seismometers. The traces build slowly from the
left edge, taking about a half-hour to span the screen,
which will then scroll progressively to accumulate
about eight hours of trace data before starting a new
trace screen. The date and time appear near the
bottom. Traces shown here are drawn in full-screen
mode, so they overlap, but they can be drawn in split
screen mode where overlapping will not occur.
Different traces can be assigned individual colors,
and the background can be light or dark. For
classroom display, brightly colored traces on a black
background seem most dramatic.
Figure 1. Connectivity of the SIMA components. The
seismometer coil, amplifier, and TINI are hard-wired,
but the TINI connects to the server and the server
connects to the client(s) via the Internet, leaving
their relative locations arbitrary. The number of
clients supported by a server is limited only by the
bandwidth available and processing power of the
server. Classroom applications can use the server
directly for monitoring on-site seismic equipment.
The client can display the traces for on-site seismic
equipment and/or the traces of the signals that
originate from other institutions. A user can run
several clients simultaneously on the same
computer.
similar instruments; the constrained computing
environment has limited further development of the
signal processing capabilities; and the antiquated and
now unavailable hardware components upon which the
system depends prevents others from emulating our
system. With our new software, all these difficulties have
been overcome.
The three-axis system, with its redundant classroom
seismometer, has now been ported to a modern PC via an
embedded microprocessor and the Seismic Internet
Monitoring Application (SIMA) software. The signals
from the seismometers are now available to anyone with
an Internet connection. The system can manage up to
four seismometers each from an arbitrary number of
stations.
OUR APPROACH
In designing the SIMA software system for long-period
seismometers, we intended, as a minimum, to retain all
the functionality of the previous software that ran on the
Apple IIe. In addition, we sought to utilize the Internet to
make the seismic data broadly available to a large
educational audience. We hope to have others join us in
freely broadcasting our seismic data in near-real-time,
which, in our experience, means a signal latency of
approximately one to three seconds. We kept the
graphics easy to visualize and the options simple and
intuitive. In addition, we intended to make the system
freely available to others who may possess similar
devices, and/or to encourage others to make or purchase
similar seismometers. The executables for all SIMA
components are available from the web site. The
potential applications apply to a broad range of
educational levels and science classroom situations.
If we have three or more widely spaced
seismometers broadcasting with our server, it would be
possible for each client to have sufficient data to
triangulate the earthquake epicenter, even with
homemade Lehman seismometers whose response
characteristics are only roughly known. If one of those
stations broadcasting with our server had a commercial
seismometer with a known response and a calibrated
installation, then classrooms using our SIMA client could
use the data to estimate the earthquake magnitude as
Gerencher and Sands - Online Near-Real-Time Seismic System for the Classroom
183
Figure 3. Seismogram of magnitude 8.3 Hokkaido, Japan, earthquake of 25 September 2003 as recorded at
Moravian College in Bethlehem, PA via the SIMA software. About 45 minutes of record are shown. Three of the
four seismometers are home-made, including the one producing the bottom trace. This seismometer is
located in the classroom and has its amplifier set for a higher gain to more dramatically show the movements
of students in the room. Notice the disturbance caused by the person who left the room about two minutes
before the “P” wave arrival.
well. With widely spaced seismometer sites, the differing
arrival times of the seismic waves could be easily
detected within the saved data, and may be apparent on
the developing traces in near-real-time if the SIMA
seismic alarm notifies the user while earthquake waves
are being received.
SOFTWARE COMPONENTS
The SIMA software system consists of three primary
components: the client, the server, and the embedded
microsystem. Although designed as a complete system,
each component is a fully functioning independent program and can operate separately from the others. This allows users without any seismometers to receive the trace
data in near-real-time from institutions with seismometers that are broadcasting the signal via the server. It also
allows an institution to operate several embedded microsystems, each of which monitors one or more seismometers. The server can be located in a completely separate
location from the embedded microsystem as long as a
network connection is available to both. All three software components are available free from our web site,
www.physics.moravian.edu/seismic. The programs are
supplied in executable form for the Windows operating
system. Any future refinements or additional features
will be freely available from the same web site, and will
be documented on the site and in future revisions of the
User’s Manual. We ask that users check with our web site
so we can effectively communicate software and system
changes. On our web site we maintain a public list of all
stations that are broadcasting seismic data via the SIMA
software, so new stations using our software to broadcast
seismic signals should register their facility with our web
site. A brief description and listing of the main
functionalities of each of the three components follows.
184
CLIENT
The client is the component that is run by users. It was
programmed in Visual Basic 6 and will run on any
system from Windows 95 to Windows XP.
The client shows the trace of the seismic signals
received from the Internet as lines that scroll across the
screen from left to right, with labeled date and time
marks along the bottom of the screen. The client allows
the user to control the display, evaluation, notification,
retention, and printing of the seismic data.
The client can connect to multiple servers. Each
server will show up in an independent window, and
each window can accommodate a maximum of four
traces. Each window has many functions and variables
that can be modified on a per-window basis. The user can
choose to save the data from one or more servers. The
data from each server is stored to a data folder that is, by
default, labeled with the station address, or with a
user-supplied name.
The client gives the user many options to control the
display of the data. Multiple traces can be assigned
individual colors, offset slightly from each other, and
presented as overlapping lines on the screen. This
method of display allows a dramatic presentation of the
traces for classrooms because the range of each trace is
the entire screen. An alternate method of display breaks
the screen up into sections, one for each trace. This
method allows the user to view the traces without
overlapping them. With both kinds of display, the user
can independently control the color and width of the
traces, the center lines, and any trigger thresholds that
may be used. The color of the background also may be
controlled to optimize the display: bright lines on a black
background may be most appropriate for classroom
displays, but black lines on a white or gray background
Journal of Geoscience Education, v. 52, n. 2, March, 2004, p. 182-185
may be most appropriate for observing subtle features of
the traces.
The client provides the user with a triggering
mechanism that is activated when the trace exceeds
user-selected threshold values. Triggers can be set and
enabled independently on any or all traces, and an
audible alarm can be set for each trace. Upon triggering, a
window will display the time, the identity of the trace,
and, if applicable, the filename that was assigned to the
saved data. The file containing the saved data is labeled
with an identifying extension so the data files can be
easily searched and sorted for significant events.
When selected, saved data files are displayed on the
screen as seismograms that can be scrolled horizontally.
When a trace is displayed in such a fashion, placing the
mouse pointer on the trace and clicking the mouse will
reveal the value of the amplifier voltage, from 0 to 5 volts,
and the timestamp, which is displayed to a hundredth of
a second. Saved records can be interrogated even while
they are accumulating.
Specifics on accessing and using these functions can
be found in the User’s Manual, located at www.physics.moravian.edu/seismic.
connected, and port to listen on for connections. The
second function provided by the software is a TIME (RFC
868) client. The client connects to a TIME-server that is
based on an atomic clock and requests the current time
stamp. The TINI’s internal clock is updated every other
hour to keep it in synchronization with this time. All data
packets are formed with the current time stamp and
always include this stamp, even when being transmitted,
received, displayed, stored, and recalled from files.
SUMMARY
Seismic traces are currently being broadcast over the
Internet in near-real-time from two institutions. These
traces can be viewed on any modern PC with an Internet
connection using free software that can be downloaded
from our web site. The software allows the user to control
the presentation, evaluation, storage, and retrieval of the
seismic data. Additional software at the same Internet
site allows institutions and individuals with long-period
seismometers to also broadcast their data over the
Internet. The authors will serve as a resource to keep an
online list of sites broadcasting such data via this
software so users can select the stations they wish to
receive from among those available. Earth Science
SERVER
teachers can enhance their classroom environment by
making some of these near-real-time traces available
The server component is only necessary for someone within their classrooms and can use the data for
who has one or more seismometers and who wishes to classroom activities that enhance the student’s
make the seismic output available to others over the experience with the Earth Sciences.
Internet. It connects with the embedded microsystems,
displays the data locally, and transmits the data to clients ACKNOWLEDGEMENTS
over the Internet. The server component of the SIMA
software was developed in Visual Basic 6 and will run on We wish to thank Richard Kroll, who teaches in the
any system from Windows 95 through Windows XP.
Department of Geology and Meteorology at Kean
The display of the server provides all the same University in Union, NJ, for serving as a beta test site for
options and functionality as the client, but also contains our software during its development phase. Kenneth P.
additional parts specific to the server, including the Kodama, who teaches in the Department of Earth and
display of a list of clients connected to the server, the Environmental Sciences at Lehigh University in
display of the registry of all microsystems connected to Bethlehem, PA, provided a long-period vertical
the server, and the menu for temporarily suspending the seismometer on an indefinite loan basis. At Moravian
data stream without interruption of any connection so College, Joseph Powlette, who teaches within the
that maintenance can be performed on the embedded Department of Physics and Earth Science, provided
microsystems and/or seismometers. The server can technical assistance and encouragement while working
manage an arbitrary number of microsystems, but the with the electronic components used in this project. The
configuration described in this article shows the current protocol for installing the SIMA code for the TINI was
documented for the web site by Nathan Keim, and the
system at Moravian College, which uses only one.
TINI code and its documentation were subsequently
updated for running under the most recent TINI
EMBEDDED MICROSYSTEM (TINI)
operating system by David Skoupil, who teaches in the
The embedded microsystem used is the Tiny InterNet Department of Computer Science, Palacky University,
Interface (TINI), designed by Dallas Semiconductor and Olomouc, Czech Republic.
available from Systronix for approximately $250.
Because it is small enough to fit within the proverbial REFERENCES
cigar box, it may be installed in one of the experimenter
boxes that are commonly available at electronics supply Gerencher, Joseph J., Jr., and Ronald F. Jackson, 1991,
Classroom Utilization of a Multi-Axis Lehman
stores. The TINI is a micro-controller that allows the user
Seismograph System, Journal of Geological
to run code written in Java. For our system, we use a TINI
Education, v. 39, p. 306 - 310.
connected to its on-board Analog-to-Digital converter to
convert the output voltages from the seismometer Jackson, Ronald F. and Joseph J. Gerencher, Jr., User’s
Manual: Seismological data Acquisition Software for
amplifiers, which range from 0 to 5 volts, to 16-bit digital
Apple IIe and IIgs Computers: Document Version
values. We then send these values, using the Ethernet
1.1, Software Version 1.0, 1991, 64p. Available from
interface on the TINI, to the server component.
the authors.
The SIMA software for the TINI provides two main Lehman, James D., 1977, Practical Seismograph tracks
functionalities. The first of these is the conversion and
tremors, Science Teacher, v. 44, p. 43 - 45.
transmission of the data from the seismometers. The user
can control all the operating variables, such as the
number of integration points, number of seismometers
Gerencher and Sands - Online Near-Real-Time Seismic System for the Classroom
185