1
tm270.0905.qxp
10/7/2005
9:57 AM
Page 50
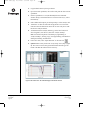
Assign Standard (shortcut = “r”)
The “Assign Standard” function allows you to assign the sample type “standard” to
all selected samples. Select one or more wells using the well selector, then select this
button to assign the sample type “standard”. Only samples that have been assigned
a type of “standard” will be used to generate the best-fit line in standard curves. All
standard samples must be assigned a concentration by the user when they are defined
as a standard. Concentrations may be entered in standard format (0.01, 0.1, 1, 10, 100,
1000, etc.) or scientific format (1e-2, 1e-1, 1e0, 1e1, 1e2, 1e3, etc.). The software does
not accept commas in the concentration assignments. Standard samples are displayed
as circles in the well selector and standard curve graphs. They are labeled “standard”
in reports.
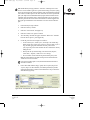
Create Dilution Series (shortcut = “f”)
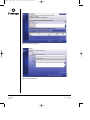
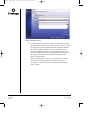
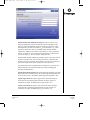
The “Create Dilution Series” function creates a full dilution series within a row or
column of wells. Select the wells that contain a dilution series of the standard, then
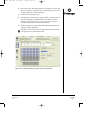
select “Create Dilution Series”. You must enter the initial concentration of the series,
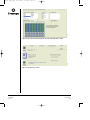
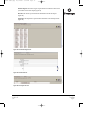
the dilution factor and whether the series is increasing or decreasing (Figure 20).
Concentrations may be entered in standard format (0.01, 0.1, 1, 10, 100, 1000, etc.) or
scientific format (1e-2, 1e-1, 1e0, 1e1, 1e2, 1e3, etc.). The software does not accept
commas in the concentration assignments.
All selected wells will be assigned the sample type “standard” with the appropriate
concentration. This function can only be performed with standards within the same
row or column. Using this function produces the same result as selecting each well
in the series individually and assigning it the sample type “standard” with the
appropriate concentration. Only samples that have been assigned the sample type
“standard” will be used to generate the best-fit line in standard curves. Standard
samples are displayed as circles. A row or column of wells within a dilution series
of standards may be assigned as standards simultaneously by highlighting multiple
wells and using the “Create Dilution Series” function.
Add Standard Curve (shortcut = “d”)
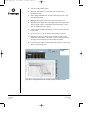
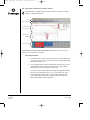
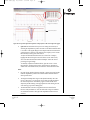
The “Add Standard Curve” function fits the experimentally measured Ct values and
user-entered concentration values for standard samples to a straight line using the
least mean squares method. It will calculate the concentrations of unknown samples,
positive control reactions and no-template control reactions from their measured Ct
values using the equation for the best-fit line. Any sample with a concentration of
“N/A” on the report or elsewhere did not cross the cycle threshold, so the
concentration of that sample cannot be calculated.
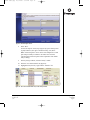
Select all of the samples you wish to use as standard samples, as well as all other
samples for which you wish to calculate concentrations. Choose “Add Standard
Curve” from the “Edit” menu. Type “d” or select the “Add Standard Curve” icon
on the toolbar.
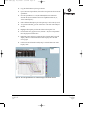
You may create as many standard curves as you wish for a single set of data, but no
sample can be used to generate more than one standard curve. It is not possible to
Promega Corporation · 2800 Woods Hollow Road · Madison, WI 53711-5399 USA · Toll Free in USA 800-356-9526 · Phone 608-274-4330 · Fax 608-277-2516 · www.promega.com
Part# TM270
Page 50
Printed in USA.
9/05