1
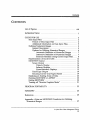
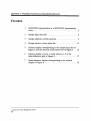
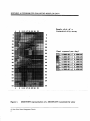
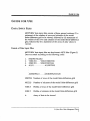
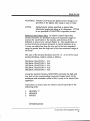
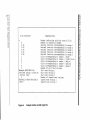
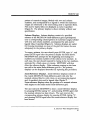
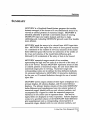
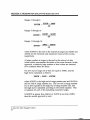
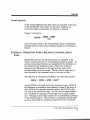
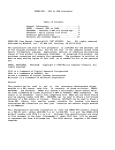
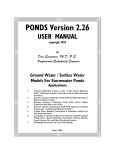
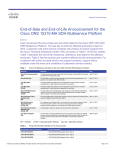
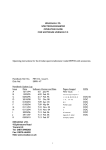
Technical Publication SJ94-6
MODVIEW VERSION i.o
A GRAPHICAL-KERNEL-SYSTEM PROGRAM
FOR EVALUATING MODFLOW DATA
by
Douglas W. Durden
St. Johns River Water Management District
Palatka, Florida
1994
Northwest Florida
Management
District
Suwannee
River'Water
Management
District
St Jmm
River Water
Management
fristtitt
St. Johns River
Water
Management
District
Southwest
Florida
Water
Management
District
South
Florida Wafer
Management
District
The St. Johns River Water Management District (SJRWMD) was created by the Florida Legislature in 1972
to be one of five water management districts in Florida. It includes all or part of 19 counties in northeast
Florida. The mission of SJRWMD is to manage water resources to ensure their continued availability while
maximizing environmental and economic benefits. It accomplishes its mission through regulation; applied
research; assistance to federal, state, and local governments; operation and maintenance of water control
works; and land acquisition and management.
Technical reports are published to disseminate information collected by SJRWMD in pursuit of its mission.
Copies of this report can be obtained from:
Library
St. Johns River Water Management District
P.O. Box 1429
Palatka, FL 32178-1429
Phone: (904) 329-4132
Executive Summary
EXECUTIVE SUMMARY
MODVIEW Version 1.0 is a Graphical-Kernel-System program
that enables datasets arranged in the format of a two-dimensional
array (i.e., sets of related numbers arranged in a format of rows
and columns) to be viewed as colored patterns of numerical
ranges. The St. Johns River Water Management District
extensively uses the U.S. Geological Survey model MODFLOW (a
ground water flow model) in performing ground water studies.
MODFLOW input and output data files consist largely of twodimensional arrays. These types of arrays are used in
MODFLOW to represent spatially distributed values of hydraulic
parameters such as transmissivity, leakance, and hydraulic head.
MODVIEW is intended primarily to provide a convenient means
of viewing MODFLOW datasets and thus to make calibrating and
evaluating MODFLOW ground water flow models more efficient.
MODVIEW screen output consists of three types of displays: (1) a
primary display, (2) subarea displays, and (3) zoom-reference
displays. The primary display shows the entire model grid.
Subarea displays show enlargements of specified subareas of the
model grid. Zoom-reference displays show the position of a
zoomed subarea with respect to the entire model grid.
MODVIEW will run on IBM-compatible personal computers
equipped with EGA, VGA, or SVGA color graphics cards and
color monitors. Hard-copy plots of MODVIEW output can be
produced with the use of screen-capture programs such as Pizzaz
Plus. Screen-capture programs enable MODVIEW output to be
produced in black and white or in color. Output can be printed
on dot-matrix, laser, or color printers.
St. Johns River Water Management District
V
MODVIEW: A PROGRAM FOR EVALUATING MODFLOW DATA
St. Johns River Water Management District
vi
Contents
CONTENTS
List of Figures
viii
INTRODUCTION
1
GUIDE FOR USE
3
Data Input Files
3
Format of Data Input Files
3
Additional Information on Data Input Files
5
Defining Numerical Ranges
5
General Description
5
Options for Defining Numerical Ranges
6
Automatic Definition of Numerical Ranges
7
Interactive Definition of Numerical Ranges
7
External Definition Using Control Input Files . . . . 8
Representation of Inactive Cells
14
MODVIEW Output
14
Screen Output
14
Primary Display
14
Subarea Displays
15
Zoom-Reference Displays
15
Hard-Copy Output
19
Ensuring Correct Grid Aspect Ratios
19
Replacing an Existing Array of Data
20
Running MODVIEW or ASPECT
20
Exiting MODVIEW
20
Turning off "Monitor Graphics Mode"
21
PROGRAM PORTABILITY
22
SUMMARY
23
References
25
Appendix—Notes on MODVIEW Procedures for Defining
Numerical Ranges
27
St. Johns River Water Management District
vii
MODVIEW: A PROGRAM FOR EVALUATING MODFLOW DATA
FIGURES
1
MODVIEW representation of a MODFLOW transmissivity
array
2
2
Sample input data file
4
3
Sample absolute control input file
9
4
Sample relative control input file
12
5
Primary display corresponding to the sample input file of
Figure 2 and the absolute control input file of Figure 3 . . 16
6
Subarea display of rows 1-4 and columns 1-3 of the
finite-difference grid of Figure 5
17
Zoom-reference display corresponding to the subarea
display of Figure 6
18
7
St. Johns River Water Management District
Introduction
INTRODUCTION
MODVIEW Version 1.0 is a Graphical-Kernel-System program
that enables datasets arranged in the format of a two-dimensional
array to be viewed as colored patterns of numerical ranges.
MODVIEW is intended primarily to provide a convenient means
of viewing MODFLOW (McDonald and Harbaugh 1988) input
and output datasets and thus to make calibrating and evaluating
MODFLOW ground water flow models more efficient.
MODVIEW is particularly useful for viewing distributions of
aquifer and confining-unit properties that in many cases do not
lend well to contouring. Examples of such distributions are
leakance and transmissivity distributions (Figure 1). Other types
of datasets that are well suited for viewing with MODVIEW
include distributions of simulated hydraulic head, hydraulic-head
residuals, drawdowns, well withdrawal rates, and
recharge/discharge rates.
MODVIEW displays a given dataset by determining the range
into which each data value falls and then filling the
corresponding cell of the model finite-difference grid with a color
that has been specified to represent the determined range.
MODVIEW then superimposes the model finite-difference grid
onto the resulting patterns of ranges, labels the finite-difference
grid with row and column numbers, and displays the specified
ranges and the corresponding representative colors in an
accompanying legend. It can enlarge (zoom) specified subregions
of a finite-difference grid for detailed viewing to better
accommodate finite-difference grids that consist of relatively large
numbers of rows and columns. Hard copies of MODVIEW
output can be produced through the use of screen-capture
programs such as Pizzaz Plus (Application Techniques 1990).
Applications of MODVIEW need not be limited to MODFLOW
datasets, as MODVIEW can be used to view any dataset that can
be arranged in the format of a two-dimensional array.
St. Johns River Water Management District
1
MODVIEW: A PROGRAM FOR EVALUATING MODFLOW DATA
5
9 13 17 21 35 29 33
Sanple plot of A
transmissivity array
(feet squared per day)
^t B.BBBE+00J
0.2BBE+B5
£± B.2BBE+B5J
B.350E+05;
B.35BE+B5
0.500E+05
^ B.5BBE+B5J
B.1BBE+B6
;± B.lBBE+B&j ^ B.2BBE+BG
^ B.2BBE*BSj ^ B.3BBE+BS
^ B.3BBE*BSj ^ B.450E+BS
&B
5
Figure 1.
9 13 17 21 25 29 33
MODVIEW representation of a MODFLOW transmissivity array
St. Johns River Water Management District
2
Guide for Use
GUIDE FOR USE
DATA INPUT FILES
MOD VIEW data input files consist of three general sections: (1) a
statement of the number of rows and columns of the model
finite-difference grid to be viewed, followed by (2) statements of
the widths of the rows and columns of the model finite-difference
grid, followed by (3) a statement of the array of data values to
viewed.
Format of Data Input Files
MODVIEW data input files are free-format ASCII files (Figure 2).
Data are stated according to the following order:
1.
2.
3.
4.
NROWS NCOLS
YDELT(l) . . . YDELT(NROWS)
XDELT(l) . . . XDELT(NCOLS)
A(l,l)
A(1,NCOLS)
A(NROWS,1)
A(NROWS,NCOLS)
NROWS Number of rows of the model finite-difference grid
NCOLS
Number of columns of the model finite-difference grid
YDELT
Widths of rows of the model finite-difference grid
XDELT
Widths of columns of the model finite-difference grid
A
Array of data to be viewed
St. Johns River Water Management District
3
O
D
m
O
O
<:
File Contents
!6 5
;5.0 4 . 0 3 . 0 4 . 0 5 . 0 2.0
:4.0 3 . 0 5 . 0 3 . 0 2 . 0
;
1.0 - 2 . 0 -5.5 -10.0
-7.0
;1.5 0 . 0 - 3 . 0 - 7 . 0
-10.0
; 2 . 5 3 . 0 1.0 -1.5 - 5 . 0
1999.0 4 . 0 3 . 0 2 . 0 0 . 0
1 9 9 9 . 0 9 9 9 . 0 2 . 0 1.0 0 . 0
^ 9 9 9 . 0 9 9 9 . 0 9 9 9 . 0 3 . 0 -1.0
iNote:
Explanations
Number of rows, number of columns
Widths of rows
Widths of columns
Row 1 of array of data
Row 2 of array of data
Row 3 of array of data
Row 4 of array of data
Row 5 of array of data
Row 6 of array of data
999.0s in rows 4, 5, and 6 indicate inactive cells.
-n
O
33
m
O
s
D
I
T1
D
Figure 2.
Sample input data file
Guide for Use
Additional Information Concerning Data Input Files
Each member of an "A" array must be separated by a blank
space from the one preceding it and the one following it
(Figure 2). The negative sign of a negative data value is part of
the value. Therefore, a blank space must separate negative signs
from the preceding data value.
Lines of data cannot be extended beyond column 80. They can,
however, be wrapped around to as many succeeding lines of the
input file as necessary.
DEFINING NUMERICAL RANGES
General Description
MODVIEW represents arrays of data as colored patterns of
numerical ranges. Therefore, numerical ranges must be defined
for each A array prior to viewing. A numerical range is defined
by two numbers, a low end and a high end. The low end of each
numerical range is identical to the high end of the preceding
numerical range. For example, a set of five numerical ranges
could be defined as follows:
Low End
High End
Range 1
-10
-5
Range 2
-5
0
Range 3
0
5
Range 4
5
10
Range 5
10
15
Once the numerical ranges are defined, MODVIEW assigns every
member of the A array to one of the ranges, providing every
member of the A array falls within one of the ranges. To be
assigned to a given numerical range, a member of the A array
must be greater than or equal to the low end of the range and
St. Johns River Water Management District
5
MODVIEW: A PROGRAM FOR EVALUATING MODFLOW DATA
less than the high end. An exception occurs only when the
maximum value of an array of data and the high end of the last
numerical range are identical. In such a case, the maximum
value of the A array is included in the last range. A maximum of
15 numerical ranges can be defined.
Every member of the A array must be assigned to one of the
defined numerical ranges, except members representing inactive
grid cells, which are described later. Therefore, if members of an
A array are less than the low end of the first numerical range or
greater than the high end of the last numerical range, a run-time
error will result. To help prevent this, MODVIEW determines
and reports the minimum and maximum values of each A array
prior to prompting the user to define the numerical ranges.
For an array of residuals of hydraulic head in which the
minimum data value is -5.2 feet (ft) and the maximum data value
is 10.3 ft, the value of -5.2 ft would be assigned to the first
numerical range in the set of numerical ranges defined above and
the value of 10.3 ft would be assigned to the fifth numerical
range. If the minimum value were -5.0 ft instead of -5.2 ft,
however, this value would be assigned to the second numerical
range and no values would be assigned to the first numerical
range. If the maximum value of the dataset were 15.0 ft instead
of 10.3 ft, it would still be assigned to the fifth numerical range,
however.
A run-time error would result if the minimum data value were a
number less than -10.0 ft or if the maximum data value were a
number greater than 15.0 ft because such values would not fall
into one of the defined numerical ranges. Redefinition of the first
and/or fifth numerical range would be required in such a case.
Options for Defining Numerical Ranges
The numerical ranges and corresponding colors can be defined by
three different methods: (1) automatic definition by MODVIEW,
(2) interactive definition by the user, or (3) external definition by
the user through the use of control input files. MODVIEW
St. Johns River Water Management District
6
Guide for Use
prompts the user to choose one of these options after reporting
the minimum and maximum values of the A array.
Automatic Definition of Numerical Ranges. To choose
automatic definition, the user should select option 1 in response
to the prompt to select a method for defining the numerical
ranges and assigning colors. MODVIEW then prompts the user
to indicate whether or not titles for the overall plot and/or legend
are desired. If the user indicates that titles are desired,
MODVIEW prompts the user to specify them. The A array is
then displayed as 14 numerical ranges.
Interactive Definition of Numerical Ranges. To define the
numerical ranges interactively, the user should select option 2 in
response to the prompt to choose a method for defining
numerical ranges. MODVIEW will then prompt the user to enter
the number of numerical ranges to be defined. Next, MODVIEW
prompts the user to begin entering the numerical ranges, starting
with range one.
Once all the numerical ranges are defined, MODVIEW prompts
the user to specify the colors that are to be used to represent the
numerical ranges. The colors are specified by entering
representative numbers displayed next to the names of the colors.
1
2
3
4
5
6
7
8
9
10
11
12
13
14
15
=blue
=red
= light blue
= dark blue
= white
= army green
= yellow
= green
= orange
= brown
= purple
= gray
= pink
= dark brown
= black
St. Johns River Water Management District
7
MODVIEW: A PROGRAM FOR EVALUATING MODFLOW DATA
After the colors are specified, MODVIEW prompts the user to
indicate whether tides are desired for the overall plot and/or
legend. If the user indicates that titles are desired, MODVIEW
prompts the user to specify them. MODVIEW then prompts the
user to enter the name of a control input file in which the
definitions of the numerical ranges, the corresponding colors, and
the display titles are to be stored.
External Definition Using Control Input Files. To define the
numerical ranges externally using a control input file, the user
should select option 3 in response to the prompt to choose a
method for defining the numerical ranges. MODVIEW will then
prompt the user to specify the name of a pre-existing control
input file. Control input files are free-format ASCII files in which
statements of the numerical ranges, the corresponding colors, and
the plot and/or legend titles are stored. Storing these data
precludes respecifying the numerical ranges, the corresponding
colors, and the plot and/or legend titles each time the same
A array or a similar A array is to be viewed.
Control input files are of two types, absolute and relative.
Absolute control input files are most applicable for use in
viewing the same array of data more than once. Relative control
input files are most applicable for viewing several different arrays
of data.
Absolute Control Input Files. In absolute control input files,
numerical ranges are stated as absolute numerical values
(Figure 3). Information is entered in the following order:
1.
2.
3.
HEADER "a"
NRANGE
XL(1)
XH(1)
XL(NRANGE)
XH(NRANGE)
St. Johns River Water Management District
8
File Contents
:a
5
-10.0
i -5.0
: -3 .0
0.0
2.0
1
3
i
5
7
1
8
3
Example MODVIEW Plot
(Derived using an absolute
control file)
:
2
Hydraulic -Head Residuals
1
(feet)
1
W
SO
-5.0
-3.0
0.0
2.0
4.0
Explanations
Header indicating absolute control file
Number of numerical ranges
Range number 1
Range number 2
Range number 3
Range number 4
Range number 5
Color corresponding to range 1 (blue)
Color corresponding to range 2 (light blue)
Color corresponding to range 3 (white)
Color corresponding to range 4 (yellow)
Color corresponding to range 5 (green)
Number of plot text strings
Plot text string 1
Plot text string 2
Plot text string 3
Number of legend text strings
Legend text string 1
Legend text string 2
8'
I
I
O
c
£
w
Figure 3.
Sample absolute control input file
CD
MODVIEW: A PROGRAM FOR EVALUATING MODFLOW DATA
4.
NCOLOR(l)
5.
6.
NCOLOR(NRANGE)
NUMTITE1
PTITLE(l)
7.
8.
PTITLE(NUMTITE1)
NUMTITE2
LTITLE(l)
LTITLE(NUMTITE2)
"a"
Alphanumeric character denoting that the file is an
absolute control input file
NRANGE
Number of numerical ranges to be defined;
maximum is 15
XL
Low ends of numerical ranges
XH
High ends of numerical ranges
NCOLOR
Numbers representing colors that correspond to
numerical ranges
NUMTITE1 Number of 26-character alphanumeric strings to be
specified as the overall plot title; range is zero to five
PTITLE
Alphanumeric strings specified as plot title.
Maximum length per string is 26 characters. PTITLE
is not specified if NUMTITE1 is specified as zero.
St. Johns River Water Management District
10
Guide for Use
NUMTITE2 Number of 26-character alphanumeric strings to be
specified as the legend title; range is zero to three
LITTLE
Alphanumeric strings specified as legend title.
Maximum length per string is 26 characters. LTITLE
is not specified if NUMTITE2 is specified as zero.
Relative Control Input Files. In relative control input files,
decimal fractions are specified in place of numerical ranges to
account for uncertainty in the maxima and minima of the
different A arrays to be viewed (Figure 4). The specification of
decimal fractions precludes instances in which members of an
A array are either less than the low end of the first numerical
range or greater than the high end of the last numerical range of
the array.
The sum of the decimal fractions must be 1.0. A set of five such
decimal fractions could be stated as follows:
DECIMAL FRACTION 1:
DECIMAL FRACTION 2:
DECIMAL FRACTION 3:
DECIMAL FRACTION 4:
DECIMAL FRACTION 5:
0.10
0.40
0.10
0.20
0.20
Using the decimal fractions, MODVIEW calculates the high and
low ends of the corresponding numerical ranges, based on the
maximum and minimum values of the A array to be viewed (see
appendix).
Information is entered into the relative control input file in the
following order:
1.
2.
3.
HEADER "r"
NRANGE
NPER(l)
NPER(NRANGE)
St. Johns River Water Management District
11
ho r-
O
D
m
00
File Contents
o
S.'
a
!
I
!
5
0 10
0.20
0.30
0.20
0.20
1
3
i
7
i
8
I
3
!Example MODVIEW Plot
i (Derived using a relative
; control file)
1
2
;Hydraulic-Head Residuals
I (feet)
Figure 4.
Explanations
Header indicating relative control file
Number of numerical ranges
Decimal fraction corresponding to range 1
Decimal fraction corresponding to range 2
Decimal fraction corresponding to range 3
Decimal fraction corresponding to range 4
Decimal fraction corresponding to range 5
Color corresponding to range 1 (blue)
Color corresponding to range 2 (light blue)
Color corresponding to range 3 (white)
Color corresponding to range 4 (yellow)
Color corresponding to range 5 (green)
Number of plot text strings
Plot text string 1
Plot text string 2
Plot text string 3
Number of legend text strings
Legend text string 1
Legend text string 2
Sample relative control input file
O
O
-n
O
30
m
£
O
O
O
T|
5
D
Guide for Use
4.
NCOLOR(l)
5.
6.
NCOLOR(NRANGE)
NUMTITE1
PTITLE(l)
7.
8.
PTITLE(NUMTITE1)
NUMTITE2
LTITLE(l)
LTITLE(NUMTITE2)
"r"
Alphanumeric character denoting that the file is a
relative control input file
NRANGE
Number of numerical ranges to be specified;
maximum is 15
NPER
Decimal fractions from which numerical ranges are
determined
NCOLOR
Numbers representing the colors that correspond to
numerical ranges
NUMTITE1 Number of 26-character alphanumeric strings to be
specified as the overall plot title; range is zero to five
PTITLE
Alphanumeric strings specified as plot title.
Maximum length per string is 26 characters. PTITLE
is not specified if NUMTITE1 is specified as zero.
NUMTITE2 Number of 26-character alphanumeric strings to be
specified as the legend title; range is zero to three
St. Johns River Water Management District
13
MODVIEW: A PROGRAM FOR EVALUATING MODFLOW DATA
LTITLE
Alphanumeric strings specified as legend title.
Maximum length per string is 26 characters. LTITLE
is not specified if NUMTITE2 is specified as zero.
REPRESENTATION OF INACTIVE CELLS
In many MODFLOW datasets, grid cells exist for which data
values are not specified or calculated. Such cells are referred to
as inactive cells. The positions that correspond to these cells in
the A array are filled with a number that otherwise would not be
expected. The number "999.0" is used for this purpose in sample
problems shown in the MODFLOW user's manual (McDonald
and Harbaugh 1988).
In MODVIEW, the user is prompted to specify whether or not
inactive cells are to be represented in the dataset to be viewed. If
the user indicates that inactive cells are to be represented,
MODVIEW prompts the user to specify the number that is being
used to represent inactive cells in the A array. This information
must be supplied to enable the program to distinguish this
number from the other members of the A array. MODVIEW will
display grid cells that correspond to the positions of this number
in the A array as inactive. MODVIEW displays inactive cells by
filling them with white or black, according to user specification.
MODVIEW prompts the user to specify either white or black
following the prompt by entering the representative number.
Inactive cells are defined as such in the legend.
MODVIEW OUTPUT
Screen Output
MODVIEW screen output consists of three types of displays: (1) a
primary display, (2) subarea displays, and (3) zoom-reference
displays. Compatible graphics cards include EGA, VGA, and
super VGA (SVGA).
Primary Display. The primary display consists of the entire
MODFLOW finite-difference grid superimposed onto the colored
St. Johns River Water Management District
14
Guide for Use
pattern of numerical ranges, labeled with row and column
numbers, and accompanied by a legend in which the numerical
ranges are referenced to the colors being used to represent them.
Plot and/or legend titles are displayed as well, if specified
(Figure 5). The primary display is drawn initially without user
specification.
Subarea Displays. Subarea displays consist of a specified
subarea of the MODFLOW finite-difference grid superimposed
onto a corresponding colored pattern of numerical ranges, labeled
with row and column numbers, accompanied by plot and/or
legend titles, if specified (Figure 6). Subarea displays are useful
for focusing (zooming) on areas of the grid that cannot be seen
adequately in the primary display.
To zoom a subarea, the user should press ENTER, type "z", and
press ENTER again after the primary display has been drawn.
MODVIEW then prompts for the beginning and ending row
numbers and column numbers of the subarea to be zoomed. In
each case, the user should respond by typing in the two numbers,
separated by a blank space or comma. MODVIEW will then
draw the subarea display. Other subareas ranging in size from
one cell to the entire finite-difference grid (i.e., the primary
display) can be displayed thereafter by repeating this procedure.
Zoom-Reference Displays. Zoom-reference displays consist of
the overall MODFLOW finite-difference grid with only the
zoomed subarea filled in with colors, an accompanying legend,
and, if specified, plot and/or legend titles (Figure 7).
Zoom-reference displays show the position of a zoomed subarea
with respect to the entire model finite-difference grid.
The user instructs MODVIEW to draw a zoom-reference display
by pressing ENTER, typing "zr", and pressing ENTER again after
the zoomed subarea has been drawn. The user recovers the
corresponding subarea display by pressing ENTER, typing "b",
and pressing ENTER again after the zoom-reference display has
been drawn.
St. Johns River Water Management District
15
MODVIEW: A PROGRAM FOR EVALUATING MODFLOW DATA
Exanple MODUIEH Plot
(Derived using an absolute
control f i l e )
Hydraulic-Head Residuals
(Feet)
-0.100E+02; ^L -0.500E+01
t^:-B.500E+01; ^- -0.300E+01
-B.3BBE+01;
B.BBBE+BB
0.000E*00j ^ 0.200E+01
0.20BE+0JL; ^ 0.400E*01
Inactive
Figure 5.
Primary display corresponding to the sample input file of Figure 2
and the absolute control input file of Figure 3
St. Johns River Water Management District
16
Guide for Use
ExAMPIe MODUIEU Plot
(Derived using an absolute
control f i l e )
Hydraulic-Head Residuals
(feet)
^-0.100E+02; ^ -0.500E+01
^-0.500G+01; ^- -0.30BE+01
^-0.300E+01; ^ 0.000E+00
& 0.000E+00;
0.200E+01
0.200E+01; ^ 0.400E-I-01
Inactive
Figure 6.
Subarea display of rows 1-4 and columns 1-3 of the finitedifference grid of Figure 5
St. Johns River Water Management District
17
MODVIEW: A PROGRAM FOR EVALUATING MODFLOW DATA
Exanple MODUIEU Plot
(Derived using an absolute
control f i l e )
Hydraulic-Head Residuals
(feet)
-0.100E+02; ^ -0.500E+01
-0.500E+01J ^-0.300E+01
-0.300E+01;
0.000E+00
0.B00E+00J
0.200E+01
^ 0.200E+0I; ^ 0.400E+01
Inactive
Figure 7.
Zoom-reference display corresponding to the subarea display of
Figure 6
St. Johns River Water Management District
18
Guide for Use
Hard-Copy Output
MODVIEW has no built-in drivers for hard-copy production.
However, hard copies of MODVIEW screen output can be
produced using screen-capture programs such as Pizzaz Plus
(Application Techniques 1990). Screen-capture programs enable
MODVIEW output to be produced in black and white or in color.
Output can be printed on dot-matrix, laser, or color printers.
Ensuring Correct Grid Aspect Ratios
MODVIEW version 1.0 is compatible with EGA, VGA, and SVGA
graphics cards and color monitors. Most monitors have a switch
located on the panel front or back with which to control the
height of the screen image. On some monitors, a switch for
controlling the width of the screen image is provided also. The
ratio of the height of the screen image to the width of the screen
image is the screen aspect ratio. The aspect ratios of finitedifference grids drawn by MODVIEW are dependent on the
screen aspect ratio. By using the program ASPECT, which is
included on the enclosed diskette with MODVIEW, the aspect
ratios of grids plotted by MODVIEW can be properly adjusted to
a given setting of the screen aspect ratio.
The ASPECT program causes a horizontal line and a vertical line
to be drawn at a right angle to one another. To adjust the aspect
ratio of MODVIEW grids, the user should measure the lengths of
the lines with a ruler. When making the measurements, the ruler
should be held parallel to the panel that frames the glass portion
of the monitor, not bent to match the curvature of the screen.
The measurements should be entered into an ASCII input file
called "Aspect" in the following order:
HORIZL VERTL
HORIZL The length of the horizontal line
VERTL The length of the vertical line
St. Johns River Water Management District
19
MODVIEW: A PROGRAM FOR EVALUATING MODFLOW DATA
These measurements can be stated in any unit system. The file
"Aspect" should be placed in the DOS directory from which
MODVIEW is to be executed. During each run, MODVIEW will
search for this file only in the current directory. If the file
"Aspect" is present, MODVIEW will use the measurements stated
in the file to approximate the actual aspect ratio of the finitedifference grid being represented. If the file "Aspect" is not
present, then MODVIEW will use default values of the lengths of
the horizontal and vertical lines drawn by the ASPECT program.
In such cases, the aspect ratio of the grid drawn by MODVIEW
will differ from the aspect ratio of the actual model grid to an
extent that depends on the setting of the screen aspect ratio.
REPLACING AN EXISTING ARRAY OF DATA
To replace one A array by another A array without first exiting
MODVIEW, the user should press ENTER, type "r", and press
ENTER again after the primary display, subarea display, or
zoom-reference display has been drawn. MODVIEW then
prompts the user to enter the name of the new data input file.
RUNNING MODVIEW OR ASPECT
Prior to running MODVIEW or ASPECT, the WATCOM GKS
library of graphics functions (Yach 1987) must be loaded into
computer memory. To load the graphics library, the user should
copy the executable code WGKS.EXE from the accompanying
diskette to the desired computer disk drive, type "WGKS", and
press ENTER. MODVIEW or ASPECT can then be run by
copying the MODVIEW or ASPECT executable code,
MODVIEW.EXE or ASPECT.EXE, from the enclosed diskette to
the desired disk drive, typing "MODVIEW" or "ASPECT", and
pressing ENTER.
EXITING MODVIEW
To exit MODVIEW, the user should press ENTER, type "q", and
press ENTER again after the primary display, subarea display, or
St. Johns River Water Management District
20
Guide for Use
zoom-reference display has been drawn. The user is also given
the option of exiting while being prompted to specify a method
for defining the numerical ranges.
TURNING OFF "MONITOR GRAPHICS MODE"
Running MODVIEW or ASPECT changes the normal operating
mode of a monitor. This change will result in a slowing of the
scrolling function and sometimes in other abnormal monitor
behavior when the monitor is used for other applications. To
restore normal operating mode, the user should execute the DOS
command "MODE CO80".
St. Johns River Water Management District
21
MODViEW: A PROGRAM FOR EVALUATING MODFLOW DATA
PROGRAM PORTABILITY
The MODVIEW source code was compiled using the WATFOR-77
FORTRAN compiler (Coschi and Schueler 1986 and 1987) and
WATCOM GKS graphics library (Yach 1987). The resulting
MODVIEW executable code will run on IBM-compatible personal
computers equipped with EGA, VGA, or SVGA color graphics
cards and color monitors. A UNIX version of MODVIEW for use
on SUN workstations can be created for use with the SunGKS
library of GKS functions (Sun Microsystems 1990).
St. Johns River Water Management District
22
^
Summary
SUMMARY
MODVIEW is a Graphical-Kernel-System program that enables
datasets arranged in the format of a two-dimensional array to be
viewed as colored patterns of numerical ranges. MODVIEW is
intended primarily to provide a convenient means of viewing
MODFLOW input and output datasets and thus to make
calibrating and evaluating MODFLOW ground water flow models
more efficient.
MODVIEW reads the arrays to be viewed from ASCII input data
files. MODVIEW data input files consist of three general sections:
(1) a statement of the number of rows and columns of the model
finite-difference grid, followed by (2) statements of the widths of
the rows and columns of the model finite-difference grid,
followed by (3) a statement of the array of data to be viewed.
MODVIEW numerical ranges consist of two numbers
representing the high and low ends of an interval of the array of
data to be viewed. Because MODVIEW represents arrays of data
as colored patterns of numerical ranges, the user must define the
numerical ranges prior to viewing. Numerical ranges and
corresponding colors can be defined by three different methods:
(1) automatic definition by MODVIEW, (2) interactive definition
by the user, or (3) external definition through the use of control
input files.
MODVIEW screen output consists of three types of displays: (1) a
primary display, (2) subarea displays, and (3) zoom-reference
displays. The primary display consists of the entire MODFLOW
finite-difference grid superimposed onto the colored pattern of
numerical ranges, labeled with row and column numbers, and
accompanied by a legend in which the numerical ranges are
referenced to the colors used to represent them. Plot and/or
legend titles are displayed as well, if specified. Subarea displays
consist of a specified subarea of the MODFLOW finite-difference
grid superimposed onto a corresponding colored pattern of
numerical ranges, labeled with row and column numbers, and
St. Johns River Water Management District
23
MODVIEW: A PROGRAM FOR EVALUATING MODFLOW DATA
accompanied by a legend and, if specified, plot and/or legend
titles. Zoom-reference displays consist of the overall MODFLOW
finite-difference grid with only the zoomed subarea filled in with
colors, an accompanying legend, and, if specified, plot and/or
legend titles.
MODVIEW will run on IBM-compatible personal computers
equipped with EGA, VGA, or SVGA color graphics cards and
color monitors. Hard-copy plots of MODVIEW output can be
produced with the use of screen-capture programs such as Pizzaz
Plus. Screen-capture programs enable MODVIEW output to be
produced in black and white or in color. Output can be printed
on dot-matrix, laser, or color printers.
St. Johns River Water Management District
24
References
REFERENCES
Application Techniques, Inc. 1990. Pizzaz Plus user's guide.
10 Lomar Park Drive, Pepperell, Massachusetts.
Coschi, G., and J.B. Schueler. 1986. WATFOR-77 language
reference. WATCOM Publications Limited, 415 Phillip Street,
Waterloo, Ontario.
1987. WATFOR-77 user's guide. WATCOM
Publications Limited, Waterloo, Ontario.
McDonald, M.G., and A.W. Harbaugh. 1988. A modular
three-dimensional finite-difference ground-water flow model.
Techniques for Water-Resources Investigations 6(A1).
Denver, Colorado: U.S. Geological Survey.
Sun Microsystems, Inc. 1990. SunGKS 4.0 reference manual.
2550 Garcia Avenue, Mountain View, California.
Yach, D.P. 1987. WATCOM GKS graphics tutorial and reference.
WATCOM Publications Limited, Waterloo, Ontario.
St. Johns River Water Management District
25
MODVIEW: A PROGRAM FOR EVALUATING MODFLOW DATA
St. Johns River Water Management District
26
^
Appendix
APPENDIX—NOTES ON MODVIEW PROCEDURES
FOR DEFINING NUMERICAL RANGES
AUTOMATIC DEFINITION OF NUMERICAL RANGES
Automatic definition of numerical ranges is performed using one
of two different approaches, depending on the mean, standard
deviation, minimum, and maximum values of the A array.
First Approach
The first approach is used whenever the minimum and maximum
values of the array of data are more than one standard deviation
from the mean.
To determine whether or nor this is the case, MODVIEW first
calculates the mean and standard deviation of the A array. It
then determines the upper and lower bounds of the interval of
data values within one standard deviation of the mean, as
follows:
XHSTD = ACAV + STDEV
XLSTD = ACAV - STDEV
where XHSTD and XLSTD are the upper and lower bounds,
respectively, of the interval of data values within one standard
deviation of the mean, ACAV is the mean of the array of data,
and STDEV is the standard deviation of the array of data.
If XHSTD is less than the maximum value and XLSTD is greater
than the minimum value of the array of data, then the minimum
and maximum values of the A array are more than one standard
deviation from the mean and the first approach is used to define
the numerical ranges. In this approach, the sizes of the 14
numerical ranges are determined as follows:
St. Johns River Water Management District
27
MODVIEW: A PROGRAM FOR EVALUATING MODFLOW DATA
Ranges 1 through 4:
XINTER =
4.0
Ranges 5 through 10:
XINTER -
XHSTD
- XLSTD
6.0
Ranges 11 through 14:
4.0
where XINTER is the size of the numerical ranges and AMIN and
AMAX are the minimum and maximum values of the A array,
respectively.
A larger number of ranges is devoted to the interval of data
values within one standard deviation of the mean because, in this
approach, a relatively large number of data values are assumed
to be clustered about the mean.
The low end of range one is then set equal to AMIN, and the
high end is calculated as follows:
XHIGH = XLOW + XINTER
where XHIGH is the high end of range number one and XLOW is
the low end of range number one. The low end of range number
two is then equated to the high end of range number one, and
the high end is calculated according to the stated equation. This
is repeated for each of the remaining numerical ranges.
If XHSTD is greater than AMAX or XLSTD is less than AMIN,
then the second approach is used.
St. Johns River Water Management District
28
Appendix
Second Approach
In the second approach, the data values are assumed to be more
evenly distributed with respect to the mean; therefore, 14
numerical ranges of equal size are defined, as follows:
Ranges 1 through 14:
XINTER = AMAX - AMIN
14.0
Once the interval size of the 14 numerical ranges is established,
the high and low ends of the numerical ranges are calculated as
before.
EXTERNAL DEFINITION USING RELATIVE CONTROL INPUT
FILES
MODVIEW converts the decimal fractions as specified in the
relative control input file to corresponding numerical ranges. To
do this, the decimal fractions are multiplied by the difference in
the maximum and minimum values of the array of data to
determine the differences in the high and low ends of the
corresponding numerical ranges. The low end of range one is
then equated to the minimum value of the array of data.
The high end is calculated according to the following equation:
XHIGH = XDOM x XPER + XLOW
where XHIGH is the high end of the numerical range, XDOM is
the difference in maximum and minimum values of the array of
data, XPER is the specified decimal fraction, and XLOW is the
low end of the numerical range. The low end of range number
two is defined by equating it to the high end of range number
one. The high end of range number two is determined according
to the stated equation. This procedure is repeated until the high
and low ends of all the numerical ranges have been calculated.
St. Johns River Water Management District
29