1
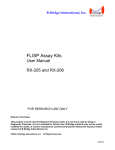
4100119B
5/24/99 12:28 PM
Page Cvr2
FluorAce™ Apopain Assay Kit
Fluorometric Detection
of Apoptosis
Catalog Number
170-3130
For Technical Service
Call Your Local Bio-Rad Office or
in the U.S. Call 1-800-4BIORAD
(1-800-424-6723)
Bio-Rad Laboratories, 2000 Alfred Nobel Drive, Hercules, CA 94547
4100119 Rev B
4100119B
5/24/99 12:28 PM
Page i
Table of Contents
Section 1
Introduction ..........................................1
Section 2
Kit Contents ..........................................2
Section 3
Preparation of Stock Solutions ............3
Section 4
Experimental Procedures.....................5
4.1
4.2
4.3
AFC Calibration Curve ...................................5
Apopain Assay ................................................7
Inhibition of Apopain Activity .......................8
Section 5
Calculations...........................................9
5.1
5.2
5.3
Fluorescence Changes.....................................9
AFC Calibration Curve .................................10
Apopain Activity...........................................11
Section 6
Storage and Stability ..........................11
Section 7
Appendix .............................................12
7.1
7.2
Preparation of Cell Extracts ..........................12
Fluorometer Setting ......................................14
Section 8
References............................................17
4100119B
5/24/99 12:29 PM
Page 1
Section 1
Introduction
Apoptosis is defined by a cascade of biochemical
events leading to nuclear fragmentation and cell death.
The process is characterized by a variety of biochemical
and morphological changes in the cell, including activation of proteinases, loss of membrane asymmetry, cell
shrinkage, chromatin condensation, and chromosomal
DNA fragmentation—currently the key marker for
apoptosis. Characterization of the underlying genetic and
biochemical mechanisms of apoptosis has recently become
an essential part of developing methods to control apoptosis and its consequences.1
Apopain/Caspase 3 is derived from the proenzyme
CPP32 at the onset of apoptosis and plays a pivotal role
in programmed cell death.2–5 Among the many members
of the ICE (interleukin-1 β-converting enzyme) protease
family recently described throughout the literature, apopain
exhibits the highest similarity to CED-3 (C. elegans cell
death gene) in both sequence homology and substrate
specificity.6 Apopain activity therefore appears to be a
suitable indicator of critical apoptosis biochemistry. The
FluorAce apopain assay kit contains all of the necessary
reagents for performing a simple, continuous fluorometric
assay of apopain activity.
1
4100119B
5/24/99 12:29 PM
Page 2
Activity is monitored in vitro using the fluorogenic
peptide substrate acetyl-Asp-Glu-Val-Asp-7-amino-4-trifluoromethyl coumarin (Ac-DEVD-AFC), a variation of
the substrate described by Nicholson, et al.4 This peptidedye conjugate produces a blue fluorescence upon exposure
to near-UV light. Apopain enzymatically cleaves the AFC
from the peptide and releases free AFC, which then produces a blue-green fluorescence. The AFC substrate is
both chromogenic (yellow-green color is
visible to the naked eye) and fluorogenic (detectable at
500–550 nm with a fluorometer).
Component
The advantages of this assay for apoptosis are several.
Apopain activity is an early marker for cells entering
apoptosis. Cleavage of Ac-DEVD-AFC may be monitored
fluorometrically for very sensitive and quantitative detection.
The reaction enables simple kinetic analysis. The reaction
is selectively inhibited by the peptide fluoromethyl ketone,
Z-DEVD-FMK, a potent inhibitor of apopain. The apopain
fluorogenic assay is fast, easy, quantitative, and robust.
DMSO, 1.5 ml
Section 2
Kit Contents
The kit contains reagents for one hundred 1 ml
reactions, including 20 controls with an inhibitor specific
for apopain and 10 positive controls. All reactions are
monitored using the fluorogenic substrate in reaction buffer.
The kit also contains dye for preparing 20 calibration curves.
2
Number of Reactions
Apopain substrate (Ac-DEVD-AFC, MW=729)
4 mg
100 x 1 ml
Apopain inhibitor (Z-DEVD-FMK, MW=668)
0.2 mg
20 x 1 ml
Apopain
(dissolve in 120 µl distilled water)
10 x 1 ml
7-amino-4-trifluoromethyl coumarin (AFC)
200 µM in DMSO, 1.0 ml
25x Reaction buffer (250 mM PIPES, pH 7.4,
50 mM EDTA, 2.5% CHAPS, 125 mM DTT)
(dissolve in 10 ml distilled water)
20 calibrations
250 x 1 ml
Note: Measurements require a fluorometer (cuvette or
microplate) using 390–400 nm excitation and 510–550 nm
emission.
Section 3
Preparation of Stock Solutions
Prior to dissolving powders, gently tap the vial to
move most of the powder to the bottom. After addition of
solvent, cap the tube then invert several times to dissolve
the powder. Spin briefly to bring the solution to the
bottom of the vial before opening.
3
4100119B
5/24/99 12:29 PM
Page 4
Apopain Substrate (Ac-DEVD-AFC)
Prepare a stock solution by adding 1 ml of DMSO to a
vial (4 mg) of Ac-DEVD-AFC. The concentration will be
5.5 mM. Store the stock substrate solution desiccated at 4 ˚C.
Apopain Inhibitor (Z-DEVD-FMK)
Prepare a stock solution by adding 200 µl of DMSO
to the vial (0.2 mg) of Z-DEVD-FMK. The concentration
will be 1.5 mM. Store the stock inhibitor solution
desiccated at 4 ˚C.
Apopain (Lyophilized Cell Extract)
Dissolve the powder in 120 µl of distilled water. The
vial has been overfilled to account for incomplete transfer
of the solution. The vial is vacuum packed to optimize
stability. Once dissolved, the solution can be transfered to
a small microfuge tube for easy handling. Keep the solution
on ice while preparing experiments. Store at -70 ˚C.
25x Reaction Buffer
Dissolve the powder in 10 ml of distilled water. Store
the solution at -20 ˚C.
4
Section 4
Experimental Procedures
4.1 AFC Calibration Curve
The calibration curve can be used to quantify the AFC
released from the substrate, Ac-DEVD-AFC. The calibration can be made as follows.
1. Prepare 10 ml of 1x reaction buffer, e.g., mix 400 µl
reaction buffer (25x) with 9.6 ml distilled water.
2. Label seven fluorometer cuvettes, e.g., 1–7. Fill cuvette
1 with 1.95 ml reaction buffer (1x), cuvettes 2–7 with
1.0 ml reaction buffer.
3. Add 50 µl of stock AFC (200 µM) solution to cuvette
1 and measure the fluorescence (see Appendix Fluorometer Setting).
Note: Adjust the fluorometer gain to obtain a signal
near 50% maximum scale for this measurement, and
then do not change the setting for the remainder of
the experiment. Zero the fluorometer with 1x reaction
buffer without AFC.
4. Remove 1.0 ml from the first cuvette and add it to
1.0 ml reaction buffer in the second cuvette, and
measure the fluorescence again. Do not change the
fluorometer settings.
5. Remove 1.0 ml from the second cuvette and add it to
1.0 ml reaction buffer in the third cuvette, and measure
the fluorescence.
5
4100119B
5/24/99 12:29 PM
Page 6
6. Repeat this process for six cuvettes. Do not transfer
solution to cuvette 7. Measure cuvette 7 without dye
(baseline).
7. The following table can be used as a guide for making the serial dilutions and for plotting the calibration
curve (see Section 5.2, AFC Calibration Curve).
Cuvette AFC
1x reaction buffer [AFC] final
1
50 µl of 200 µM stock
1.95 ml
5 µM
(10 nmole)
2
1.0 ml of 5 µM
(Cuvette 1)
1.0 ml
2.5 µM
(5 nmole)
1.0 ml of 2.5 µM
(Cuvette 2)
1.0 ml
1.25 µM
(2.5 nmole)
3
4
5
6
1.0 ml of 1.25 µM
(Cuvette 3)
7
6
The assay can be used with a cuvette or microplate
fluorometer. See Appendix 7.2, Fluorometer Setting, for
general recommendations on fluorometer conditions.
Reactions may be prepared in fluorometer cuvettes using the
following guide. For each set of reactions, one blank reaction
should be prepared to measure substrate background and
instrument drift.
Blank
Sample
25x Reaction Buffer
40 µl
40 µl
40 µl
Ac-DEVD-AFC
10 µl
10 µl
10 µl
Sample
none
1–100 µl
none
0.31 µM
(0.63 nmole)
Apopain (positive control)
none
none
10 µl
950 µl
volume to 1,000 µl
940 µl
1.0 ml
0.15 µM
(0.31 nmole)
1.0 ml
Zero
1. Mix the samples, measure the fluorescence, and record
the time and signal.
2. Seal the cuvettes with Parafilm and incubate at 20–37 ˚C.
3. Repeat the fluorescence readings every 30–60 minutes
until the sample measurements are complete. A single
time point is sufficient to determine the substrate
1.0 ml
1.0 ml of 0.31 µM
(Cuvette 5)
Crude cell lysates and partially purified or purified cell
preparations may be assayed (see Appendix 7.1 Preparation
of Cell Extracts). In addition to a blank (no enzyme), the
following controls may be run to insure positive detection:
a non-apoptotic cell lysate, a sample to which the inhibitor
has been added (see Section 4.3, Inhibition of Apopain
Activity), and a positive control (apopain).
Component
1.0 ml
1.0 ml of 0.63 µM
(Cuvette 4)
4.2 Apopain Assay
0.63 µM
(1.25 nmole)
Water
7
Positive control
4100119B
5/24/99 12:29 PM
Page 8
turnover rate from the calibration curve. A large change
in fluorescence within the first 30–60 minutes may
indicate very high activity and subsequent measurements may be outside of the linear range of the
reaction. At least two time points should be measured
to check for consistent activity. Low activity may take
several hours to detect.
4. The positive control (apopain cell extract) should
produce a linear increase in fluorescence over 3 hours
when incubated at room temperature (20 ˚C). The activity of the apopain cell extract contained in the kit is
printed on the bottle label.
4.3 Inhibition of Apopain Activity
To test for interference from non-specific protease
activity, compare a sample with and without the apopain
specific inhibitor Z-DEVD-FMK.
Reactions may be prepared in fluorometer cuvettes
using the following guide. Do not add the substrate until
after mixing and incubation of the following mixtures.
Component
Blank
Sample
Negative control
25x Reaction Buffer 40 µl
40 µl
40 µl
Z-DEVD-FMK
(inhibitor)
none
none
10 µl
Sample
none
1–100 µl
= same sample volume
Distilled Water
950 µl
volume to 990 µl volume to 990 µl
8
1. Mix the samples, seal the cuvettes with Parafilm, and
incubate at 20 ˚C for 30 minutes.
2. Add 10 µl of substrate (Ac-DEVD-AFC) to each tube,
mix, and measure the fluorescence immediately (t = 0).
Incubate at 20–37 ˚C.
3. Repeat the fluorescence readings every 30–60 minutes
until the sample measurements are complete. Activity
measured for the negative control (see ∆F below) will
be from enzymes other than apopain.
Note: When using the positive control cell extract as a
sample, inhibition should be about 95% under the conditions above.
Section 5
Calculations
5.1 Fluorescence Changes
1. Calculate the increase in fluorescence over time for
each sample as follows:
∆F = [Fsample(at ti) - Fsample(at t0)] - [Fblank(at ti) - Fblank
(at t0)] where F = fluorescence signal as recorded from
the fluorometer; ti = the reaction time; sample = cuvette
containing either an experimental sample or apopain
control; blank = control cuvette containing only
substrate in reaction buffer, without apopain.
9
5/24/99 12:29 PM
Page 10
2. Calculate enzyme activity for t i (see Section 5.3,
Calculations—Apopain Activity). If activity is low,
the assay should be allowed to proceed for a longer
time. Data collected when more than 10% of the substrate has been consumed (e.g., 5 nmole AFC produced) may not be linear.
5.2 AFC Calibration Curve
Prepare a calibration curve by plotting AFC concentration (nanomoles) vs fluorescence change (∆F)–see
Section 4.1 (AFC Calibration Curve).
5.3 Apopain Activity
Units apopain in sample = ∆F/minute x (calibration
curve slope)-1 x 1000
where ∆F/minute x (calibration curve slope)-1 = nmoles
of AFC produced/minute, ∆F is defined in Section 5.1.
The factor of 1000 converts nmole AFC per minute to
activity units.
For example, ∆F = 700, time = 60 minutes, calibration
curve slope = 2000,
Units apopain in sample = (700/60) x (1/2000) x
(1000) = 5.83 units
20,000
Section 5.1, Calculations—Fluorescence Changes.
15,000
∆F
4100119B
10,000
slope =
5,000
2000
(nmole) AFC
0
0
2.5
5.0
AFC (nmole)
7.5
10
Section 6
Storage and Stability
The kit is shipped at room temperature.
Ac-DEVD-AFC and Z-DEVD-FMK
Store at 4 ˚C, protected from moisture. These reagents
are stable for 1 year from the date of purchase when stored
as received and for at least 6 months when stored in DMSO.
Apopain
Store at 4 ˚C, protected from moisture. After being
dissolved in distilled water, store frozen at -70 ˚C. Repeated
freeze-thaw cycles may reduce activity slightly. This
compound is stable for 1 year from the date of purchase
when stored as received and at least 6 months when stored
in solution at -70 ˚C.
10
11
4100119B
5/24/99 12:29 PM
Page 12
Reaction Buffer
Store at 4 ˚C, protected from moisture. After being
dissolved in distilled water, the solution should be stored
at -20 ˚C. This reagent is stable for 1 year from the date of
purchase when stored as received and at least 6 months
when stored in solution at -20 ˚C.
AFC and DMSO
These compounds are stable for 1 year from the date
of purchase when stored at room temperature. Storage at
4 ˚C is acceptable (although they will freeze).
Section 7
Appendix
7.1 Preparation of Cell Extracts
Because of the specificity of apopain for the fluorogenic
substrate, and because of the stability of the substrate, it
is possible to perform this assay using a crude cell extract.
Performing the assay in the presence of the inhibitor
provided with the kit provides a means of confirming that
the proteolytic activity is due to the activity of apopain.
The following procedure is provided only as a suggestion for harvesting and lysing cells. The user will need
to develop a specific procedure. For example, see
Thornberry (1994).
12
• Grow ~107 cells under appropriate conditions.
Suspension cultures may be grown in 75 cm2 flasks.
Attached cells should be grown on 100 mm tissue
culture plates. If necessary, stimulate cells to undergo
apoptosis.
• Suspension cultures: transfer media with cells to
a 15 ml disposable centrifuge tube. Pellet cells
(7–8 min at 600 x g). Remove supernatant and
rinse the pellet with PBS or media without serum.
Re-pellet cells and remove supernatant. Lyse the
suspension culture by adding 100 µl of Apopain
Lysis Buffer to the cell pellet. Vortex gently to
resuspend the cell pellet then freeze and thaw the
sample four or five times by transferring from an
isopropanol-dry ice bath to a 37 °C water bath; do
not vortex between freeze-thaw steps.
• Attached cultures: harvest floating cells by transferring the media to a 15 ml disposable centrifuge
tube; pellet the cells; remove the supernatant. Wash
the attached cells twice with 4–5 ml of PBS or
media without serum; add this to the pellet of floating cells in the 15 ml disposable centrifuge tube.
Re-pellet the cells; remove the supernatant. Lyse
the attached cells on the 100 mm tissue culture plate
by adding 100–150 µl of Apopain Lysis Buffer and
scraping the cells; transfer the buffer and cell debris
to the 15 ml centrifuge tube. Freeze and thaw the
sample four or five times as indicated above for
suspension cultures.
13
4100119B
5/24/99 12:29 PM
Page 14
• Transfer the lysed cell extract to a microfuge tube.
Spin for 30 minutes at full speed in a microfuge at
4 °C to pellet the cell debris. Remove the supernatant
to assay apopain activity and protein content.
• Phosphate-buffered saline (PBS)
10 mM sodium phosphate, pH 7.2–7.4
150 mM NaCl
Dissolve 8.8 g of NaCl, 1.2 g of Na2HPO4,
and 0.22 g of NaH2PO4 in 800 ml of distilled water.
Adjust the pH to 7.3 ± 0.1 with 10 N NaOH. Add
water to 1 liter. Dispense the solution into bottles
and autoclave for 20 minutes at 15 psi on the liquid
cycle. Store at room temperature.
• Apopain Lysis Buffer
10 mM HEPES, pH 7.4
2 mM EDTA
0.1% CHAPS
5 mM DTT
1 mM PMSF
10 µg/ml pepstatin A
10 µg/ml aprotinin
20 µg/ml leupeptin
7.2 Fluorometer Setting
The following procedure can be used as a guide for
making measurements in a cuvette or microplate fluorometer. Refer to the user manual regarding specific
operating instructions for your fluorometer.
14
Select The Wavelengths
Excitation = 390–400 nm, emission = 510–550 nm
(fluorescein filter). Refer to the manufacturers guide for
use of the fluorometer.
• In a scanning fluorometer, select in the range
390–400 nm for excitation and 510–550 nm for
emission, and adjust slit widths to get a good signal.
See Set the Detection Scale below.
• In a filter fluorometer, insert a 390–400 nm
excitation filter in the excitation side and a
fluorescein emission filter (or equivalent) in the
emission side.
Set the Detection Scale
1. Zero the detection scale using a cuvette containing
1x Reaction Buffer (cuvette 7). If using a VersaFluor™
fluorometer, first set the gain to low, and the range
setting to zero.
2. Insert the most concentrated solution (5 µM AFC)
made for the calibration curve into the fluorometer
(cuvette 1). Adjust the instrument settings, e.g., adjust
the gain to obtain a signal near 50% maximum. If
using a VersaFluor fluorometer, the reading should
be less than 10,000 (half maximum) given the
settings in Step 1 above.
15
4100119B
5/24/99 12:29 PM
Page 16
Note: After the detection scale is set, do not readjust the
gain or fluorometer settings during the experiment.
Measure the Fluorescence Calibration Curve
• Insert each of the AFC calibration solutions and
record the fluorescence signal.
Section 8
References
A full list of references may be obtained by calling
your local Bio-Rad office.
1.
Measure the Samples and Controls
• Insert the blank sample and record the fluorescence
signal and time.
2.
• Insert the experimental sample and record the fluorescence signal and time.
• Insert the control sample and record the fluorescence signal and time.
3.
• Repeat the measurements at least once to check
for consistency in the activity calculation (see
Section 5.3–Apopain Activity)
4.
5.
6.
7.
16
Nicholson, D. W., ICE/CED3-like proteases as therapeutic
targets for the control of inappropriate apoptosis, Nature
Biotech., 14, 297–301 (1996).
Goldberg, Y. P., Nicholson, D. W., Rasper, D. M., Kalchman,
M. A., Koide, H. B., Graham, R. K., Bromm, M., KazemiEsfarjani, P., Thornberry, N. A., Vaillancourt, J. P. and Hayden,
M. R., Cleavage of Huntington by apopain, a proapoptotic
cysteine protease, is modulated by the polyglutamine tract,
Nat. Genet., 13, 442–449 (1996).
Nasir, J., Goldberg, Y. P. and Hayden, M. R., Huntington disease: new insights into the relationship between CAG expansion and disease, Hum. Mol. Genet., 5, 1431–1435 (1996).
Nicholson, D. W., Ali, A., Thornberry, N. A., Vaillancourt,
J. P., Ding, C. K., Gallant, M., Gareau, Y., Griffin, P. R.,
Labelle, M., Lazebnik, Y. A., et al., Identification and inhibition of the ICE/CED-3 protease necessary for mammalian
apoptosis, Nature, 376, 37–43 (1995).
Rotonda, J., Nicholson, D. W., Fazil, K. M., Gallant, M.,
Gareau, Y., Labelle, M., Peterson, E. P., Rasper, D. M., Ruel,
R., Vaillancourt, J. P., Thornberry, N. A. and Becker, J. W.,
The three-dimensional structure of apopain/CPP32, a key
mediator of apoptosis, Nat. Struct. Biol., 3, 619–625 (1996).
Kuida, K., Zheng, T. S., Na, S., Kuan, C., Yang, D.,
Karasuyama, H., Rakic, P. and Flavell, R. A., Decreased
apoptosis in the brain and premature lethality in CPP32deficient mice, Nature, 384, 368–372 (1996).
Thornberry, N. A., Interleukin-1β converting enzyme,
Methods in Enzymology, 244, 615–631 (1994).
17