1
Analyze GEO data with the Affymetrix software
From BioWareWIKI
Analyzing a selected GEO dataset using the Affymetrix Expression Console (EC) and Transcriptome Analysis Console (TAC)
[ Main_Page | Hands-on Analysis of public microarray datasets ]
Contents
1 Introduction
2 The Affymetrix Expression Console (EC)
2.1 Converting CEL data to CHP format required for TAC
2.2 Performing QC on the data and generating summarizing plots
3 The Affymetrix Transcriptome Analysis Console (TAC)
3.1 Importing EC data and defining Groups
3.2 Computing 'gene-level' Differential expression
3.3 Adjusting Differential expression limits
3.4 Plots based on the filtered differential expression table
3.5 Exporting results
4 Conclusion
5 Youtube videos from the Affymetrix training team
6 download exercise files
Introduction
The data used in this how-to tutorial is the same as that used for the BITS hands-on training Hands-on_Analysis_of_public_microarray_datasets
The Affymetrix online training page dedicated to MA and transcriptome analysis can be browsed here (http://www.affymetrix.com/estore/browse/level_seven_software_products_only.jsp?
productId=131414&categoryId=35623&productName=Affymetrix%2526%2523174%253B-Expression-Console%2526%2523153%253B-Software#1_1)[1]; This main pages contains links
to download the necessary software as well as links to other Affymetricx resources necessary to perform a full expression analysis. Also refer to the Affymetrix Transcriptome Analysis Console
(TAC) Software and Expression Console Software tutorial pages (http://www.affymetrix.com/support/learning/training_tutorials/tac_ec/index.affx#1_2) [2]
You will need to set a free NetAffx (http://www.affymetrix.com/analysis/index.affx) account to download software and access data pages
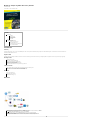
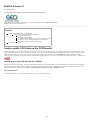
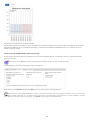
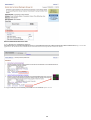
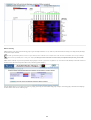
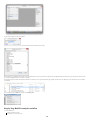
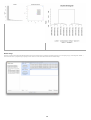
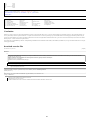
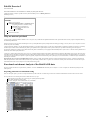
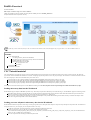
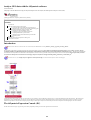
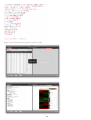
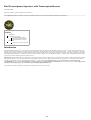
A summarized in the above picture, we will now perform the two steps required to perform a full analysis starting from a set of CEL files obtained from the GEO repository. The method can be
divided into two steps as detailed below; the first step converts CEL data to a format better suited for differential expression analysis using the Expression console; the second step computes
differential expression base don user-defined sample groups and using the Transcription Analysis Console. Results presented here correspond to the blue-highlights in the above workflow.
The Affymetrix Expression Console (EC)
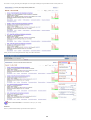
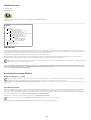
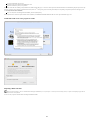
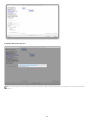
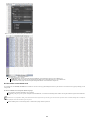
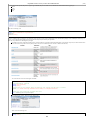
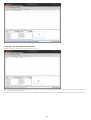
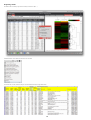
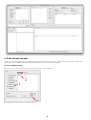
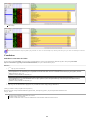
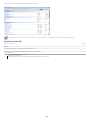
The EC software allows step by step processing of the data by sequentially clicking each tool on the right hand side of the window
69