1
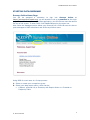
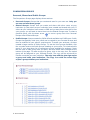
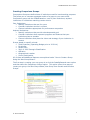
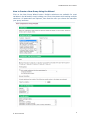
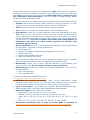
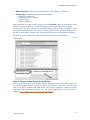
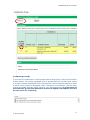
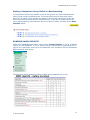
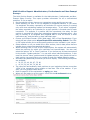
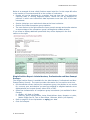
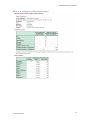
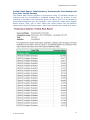
College and University Professional Association for Human Resources SurveysOnLine DataOnDemand User’s Guide 1811 Commons Point Drive | Knoxville, TN 37932 | 877.287.2474 | [email protected] | www.cupahr.org TABLE OF CONTENTS What is DataOnDemand? 4 Starting DataOnDemand 5 Comparison Groups 6 Personal, Shared and Public Groups 6 Creating Comparison Groups 7 How to Create a New Group Using the Wizard 8 How to Create a New Group from Scratch 10 Combining Groups 11 Renaming, Deleting, Copying and Moving Comparison Groups 12 Making a Comparison Group Visible for Benchmarking 13 Running Salary Reports 13 Multi-Position Report: Administrators, Professionals and Non-Exempt Surveys 14 Single Position Report: Administrators, Professionals Non-Exempt Surveys 15 Ordinal Rank Report: Administrators, Professionals, Non-Exempt and Faculty Surveys 17 Trend Report: Administrators and Professionals Surveys 18 Multi-Position Years in Position Report: Administrators and Professionals Surveys 19 Multi-Position Demographic Report: Administrators and Professionals Surveys 19 Reports Specific to the Four-Year Faculty Survey 20 Multi-Discipline Report, 4-digit CIP Codes 20 Single Discipline Report, 4-digit CIP Codes 21 Aggregate Report, 2-digit CIP Codes 22 Index Reports for 2-digit and 4-digit CIP Codes 23 Multi-Discipline Report, 6-digit CIP Codes (Tenured/Tenure Track Only) 23 Department Head Survey Report 24 Per-Course Faculty Survey Report 25 Reports Specific to the Two-Year Faculty Salary Survey 26 Salary by Discipline 26 Department Head 27 Per-Course Faculty 27 Reports Specific to Healthcare and Other Benefits 28 Healthcare Benefits 28 Other Benefits 28 Other Output Options 29 Sorted Lists 29 Report Writer 30 Slide Shows 31 Creating a Slide using Crosstabs & Frequencies Tables and Graphs 33 34 Copying HTML Outputs into Excel 34 About Safe Harbor Guidelines 35 About Weighted and Un-Weighted Statistics 35 Aging Salary Data 36 Contacts for Questions 36 DataOnDemand User’s Manual WHAT IS DATAONDEMAND? DataOnDemand (DOD) is a hands-on application that gives your institution and specified users direct access to survey data. DOD is a great value because you can conduct your own analyses any time you want and as often as you want, using peer comparison groups that you create. Furthermore, you have access to results for that survey for both the current and previous four years. For most users, using DOD is a matter of creating comparison groups and running reports, many of these reports are available in Excel format. Confidentiality Restrictions Use of DOD is limited only by the five restrictions in place to protect confidentiality: No salary data are linked to a given institution (other than where a user has permission to see his or her institution’s data). A comparison group must include a minimum of eight institutions that participated in the survey. Each comparison group created must differ by at least three institutions from all other existing and deleted comparison groups. This protects the confidentiality of submitted data. No salary data are reported for positions with fewer than five responding institutions. Weighted salary data are not reported for positions in which one institution’s data represents 25% or more of the total incumbents. CUPA-HR Surveys Available in DOD Administrators in Higher Education Salary Survey Professionals in Higher Education Salary Survey Non-Exempts in Higher Education Salary Survey Four-Year Faculty in Higher Education Salary Survey Department Head Salary Survey for Four-Year Colleges and Universities Per-Course Faculty Salary Survey for Four-Year Colleges and Universities Two-Year Faculty in Higher Education Salary Survey Employee Health Benefits Survey of Higher Education © 2014 CUPA-HR 4 DataOnDemand User’s Manual STARTING DATAONDEMAND Surveys Online Home Page You will be assigned a username to sign into Surveys Online at https://surveysonline.cupahr.org; you will be able to set up a password at this login page. Surveys Online is a menu interface application; you will notice a menu bar across the top of the screen. To enter DOD, click DataOnDemand on the menu bar. Also notice the Messages section below your Personal Info. CUPA-HR uses this box to post messages to DOD subscribers and all Surveys Online users. Using DOD for most users is a 2-step process: 1. Select or create your comparison group. 2. Select your data output option, which can be: A Report, a Sorted List, a Summary with Report Writer or a Crosstab or Frequency Table. © 2014 CUPA-HR 5 DataOnDemand User’s Manual COMPARISON GROUPS Personal, Shared and Public Groups The Comparison Groups page displays three sections: Personal Groups: Groups that you create and save for your own use. Only you can see and use these groups. Shared Groups: Groups that you create and share with other users at your institution (or that others at your institution have created and shared with you). If others at your institution have access to DOD and you want them to be able to use your groups, you will want to move them into the Shared Groups area. To share a personal group, click the down arrow to move a group from Your Personal Groups area to Shared Groups. Public Groups: Groups created by CUPA-HR and available to all DOD users. Public Groups that partially meet your needs can be copied to your Personal Groups and then be modified to your specific requirements. To assist your analyses, we have created a large number of Public Groups. To see the list of groups available, click the + symbol next to the Public Groups’ heading on your screen. To include a public group in your drop-down list of comparison groups available for analyses, check the box next to each group that you want, and then select Save Changes at the bottom of the page. To make a copy of a group, click on the copy icon, the copied group will be assigned to your Personal Groups. The copy can be structured to include or exclude your own institution. The copy icon with the plus sign copies a group and adds your institution. The copy icon with the minus sign copies a group without your institution. © 2014 CUPA-HR 6 DataOnDemand User’s Manual Creating Comparison Groups Comparison Groups are defined sets of institutions used for benchmarking purposes. They allow you to compare aggregate results of a group to your own school. Comparison groups can be created based on a set of peer institutions, aspirant institutions or institutions matching certain criteria. Peer Institutions: Identify institutions that are like yours Consider institutions similar in mission Choose institutions appropriate for performance comparison Aspirant Institutions: Identify institutions that provide a developmental goal Consider institutions that represent programs and features that your institution plans to emulate Choose institutions that place the vision and strategy of your institution in context Groups based on specific criteria: Total Expenses, (Operating Budget prior to 2013-14) Enrollment Faculty Size 2010 or 2005 Carnegie Classification Affiliation Geographical Location Survey Participation All of these and additional features are explained under “How to Create a Group Using the New Group Wizard”. The first step in creating your own group is to click the DataOnDemand menu option and then select the Comparison Groups option. This option offers three ways to create your group: the New Group Wizard, New Group from Scratch and Combine Groups © 2014 CUPA-HR 7 DataOnDemand User’s Manual How to Create a New Group Using the Wizard Click on the New Group Wizard button. Multiple selections are available for most variables in the Wizard by simply holding your Control key down while making multiple selections. All parameters are optional, note that the more you choose the narrower your query becomes. © 2014 CUPA-HR 8 DataOnDemand User’s Manual As mentioned earlier, for reasons of confidentiality, eight is the minimum number of institutions required for creating a comparison group and each group must differ by at least three institutions from any other group created and used, or deleted, by your own institution’s DOD subscribers. If you are unable to create a group, please contact the CUPA-HR Research Staff. The Wizard permits you to create a peer group by selecting from the following criteria: Systems: Allows you to select a specific system or a group of systems. In most cases you will not need to change the default, which is “All Systems.” States: Allows you to select a specific state or a group of states. Year: Allows you to select the specific data for a given academic year. Participation: Allows you to select institutions that have participated in a given Year or set of years. Check the box next to the year or years you would like to retrieve participant institutions from; by selecting two or more options you will be pulling schools that participated in each of the selected years (for instance 201314 and 2012-13). If you do not select this option, the system selects all institutions that meet your other criteria regardless of whether they completed a given survey. Survey Variables: Allows you to add variables individually by selecting and hitting the add button. Variables currently available are: o Total Faculty FTE o Operation Expenses (Total Operating Budget prior to 2013-14) o Total Student FTE o Faculty Unionized/Not Unionized o Staff Unionized/Not Unionized Once you click the Add button you will be asked for a range of values to include. Enter full figures without commas (for instance 200M as 200000000). Membership: Allows you to select CUPA-HR members or non-members, this option is rarely used, do not confuse it with survey participation. Classifications: Allows you to select by Carnegie Classification. There are two options available: o 2010 Carnegie Class o 2005 Carnegie Class To learn more about the classifications go to: http://classifications.carnegiefoundation.org Affiliation: Four options are available: Public, Private Independent, Private Religious, and Private for-Profit. To select all Private categories hold your control key down while making your selections for each of the private categories. Level of Instruction: Three options are available: Offers Undergraduate Only, Offers Graduate Only, and Offers Both Undergraduate and Graduate. US Census Region: Four options are available o Northeast: CT, ME, MA, NH, NJ, NY, PA, RI, and VT o Midwest: IN, IO, IL, KS, MN, MI, MO, NE, ND, OH, SD, and WI, o South: AR, AL, DE, DC, FL, GA, KY, LA, MD, MS, NC, OK, SC, TN, TX, VI, and WV o West: AK, AZ, CA, CO, HI, ID, NM, MT, NV, OR, UT, WA, and WY Metropolitan Statistical Area: A map of current MSAs is available at http://www.census.gov/population/metro/files/metro_micro_Feb2013.pdf © 2014 CUPA-HR 9 DataOnDemand User’s Manual NCAA Division: Six options are available 1A, 1AA, 1AAA, 2, 3, and NA. Entity Type: The following options are available o Single Unit Institution o Institution within a system o System Office o System Summary After selecting your peer group criteria, click the Search button at the bottom right hand corner of the Wizard. Institutions matching your query will then be listed. At this point, you may remove any institution that you don’t want to include in your list by un-checking the box next to the school’s name. You can also add institutions to the list by searching by name, then checking the box next to the desired institution. Once your group is complete, name it and select Save Comparison Group. Name your group and save it How to Create a New Group from Scratch Click on the New Group from Scratch button. Enter part of the institution’s name or its Unitid and select search. To select a school for inclusion in your list, check the box next to its name. Repeat these steps until your group is complete, name the group, and select Save Comparison Group. You can check participation in the surveys by going to http://www.cupahr.org/surveys/results.aspx. © 2014 CUPA-HR 10 DataOnDemand User’s Manual Combining Groups If you need to combine two or more groups under a single group, click on the Combine Groups button. You will be presented a list of groups that you currently have access to in your Personal, Shared and Public Groups areas. Click on the plus symbol to select a group, which would be displayed under “Groups to be combined”. Add as many groups as needed and then type a name for your combined group. It is important to note that only groups that have been checked to appear in dropdown lists will be also active for combining. © 2014 CUPA-HR 11 DataOnDemand User’s Manual After selecting your comparison groups to be combined, name your new group and then click on “Create Group”. The combined group will show in Your Personal Groups, for instance the combo of the above two groups is this one: Renaming, Deleting, Copying and Moving Comparison Groups To rename a group click on the pencil icon and in the Group Name box type a new name for your group and hit the Save button. To delete a group click on the trash can icon; this will remove the group from the display but not from Surveys Online. When creating a new group it needs to differ by at least three institutions from any existing group, including any that have been used and deleted. However, if you delete a group before running a report, it is not compared to any new groups you create. As such, it is important to make sure that your group includes all the institutions you want before running any reports. To copy a group, click on the copy icon; note that a plus symbol will show next to the second copy icon if your institution is not included in the present group; by clicking on it you will be creating a copy of your group that include your institution. If your institution is included in the group, a copy icon with a minus symbol will show; by clicking on it your institution will be excluded from the copied group. Lastly, to move a group to the Shared area, click on the down arrow. Once your group is showing in the Shared area, your screen will show an up arrow that will allow you to move the group back to your Personal Groups area. © 2014 CUPA-HR 12 DataOnDemand User’s Manual Making a Comparison Group Visible for Benchmarking In Comparison Groups you are able to see all the groups you have created and all other groups you are entitled to see. The check boxes next to the groups’ name allow you to specify which groups will appear in the various report drop-down lists where you select a group to use in benchmarking. To be able to select a group for use in benchmarking, check the box next to the group’s name and then hit the Save Changes button. RUNNING SALARY REPORTS Under the DataOnDemand menu option select Survey Reports. A list of available reports will be displayed. To run a specific report click on the corresponding link. If reports for a particular survey are not underlined, your institution has not purchased DOD access for that survey. The following matrix displays a listing of DOD reports available by survey: © 2014 CUPA-HR 13 DataOnDemand User’s Manual Multi-Position Report: Administrators, Professionals and Non-Exempt Surveys The Multi-Position Report is available for the Administrators, Professionals and NonExempt Salary Surveys. This report provides information for all or self-selected positions. To run a report: On the selection screen choose your comparison group and the survey year. Select whether you wish to run un-weighted or weighted statistics. If you select “un-weighted” the salary reported by an institution for a given position is counted only once when calculating median and average salary. If you select “weighted” the salary reported by an institution for a given position is counted once for each incumbent. For example, if a position has five incumbents, the salary for that position is counted five times when calculating median and average salary. One way of thinking of un-weighted and weighted data is that the former is what institutions pay, and the latter is what individuals earn. Choose your Output Format: HTML (Web page), PDF or Excel Spreadsheet. If you select this last output option all positions will be selected by default. The HTML or PDF option allows you to select specific positions to be included in your output. Select whether or not you would like to filter outliers, that is data points that are outside plus or minus two standard deviations. When choosing HTML or PDF as your output option, the system will automatically select the positions for which your institution has reported data. You also may select the options “All” or “None” positions. If you choose any of these two options hit the button “Update selection”. You can also select individual positions, in this case first choose “None” positions and hit Update selection, then check the box for each position you would like to run results for and click Update Selection again. Also select any additional percentiles you wish to display. The following two options are available: o 20, 25, 33, 40, 60, 67, 75, 80 o 10, 20, 30, 40, 60, 70, 80, 90 The report will automatically mark positions at your institution that are more than 150% of the comparison group median or less than 75% of the median. If you wish, you may change these values. Refer to page 35 for an explanation on aging your data. When you are ready to run the report, simply hit the Go to Report button. © 2014 CUPA-HR 14 DataOnDemand User’s Manual Below is an example of what a Multi-Position report looks like. In this output NP refers to the number of incumbents and NI to the number of institutions. Results will not be displayed for a position that has less than five institutions reporting data. If running weighted reports, results will not be displayed for positions in which one institution’s data represents more than 25% of the total incumbents. Section A displays your institution’s data as the focus institution. Section B provides comparison group statistics. The next section to the right shows the focus group’s average and median salaries as a percentage of the comparison group’s average and median salaries. If you chose to display additional percentiles they will be displayed in the final section on the right. Single Position Report: Administrators, Professionals and Non-Exempt Surveys The Single Position Report is available for the Administrators, Professionals and NonExempt Salary Surveys. The report provides information for one position at a time. On the selection screen choose your comparison group, the position to run results for, a survey year, and whether you want un-weighted or weighted statistics to be displayed and your output format, either HTML or PDF. Select the characteristics of comparison group incumbents (not available for NonExempt) o Gender: All, Male or Female o Ethnicity: Amer Ind/AK Native, Asian, Black/African Amer, Hispanic or Latino, Native HI/Oth Pac Isl, Two or More Races, Unknown, White (not Hispanic). Refer to page 35 for an explanation on aging your data. Click Go to Report. © 2014 CUPA-HR 15 DataOnDemand User’s Manual Below is an example of a Single Position Report: © 2014 CUPA-HR 16 DataOnDemand User’s Manual Ordinal Rank Report: Administrators, Professionals, Non-Exempt and Four-Year Faculty Surveys The Ordinal Rank Report provides an anonymous listing of individual salaries by institution and the un-weighted or weighted average salary by position. If your institution is included in the comparison group you select, and if you are allowed to see confidential data for your own institution, your institution’s value will be flagged. Output format: HTML, PDF or Excel. Select your report options from the selection screen and hit the Go to Report button. Below is an example of an ordinal rank report: © 2014 CUPA-HR 17 DataOnDemand User’s Manual Trend Report: Administrators and Professionals Surveys The Trend Report allows you to see the percentage change in your salaries by position in a two-year span and comparable rate of change statistics for your comparison group. Rates are calculated for institutions providing data for both years. The report shows the percentage change in the average, median, minimum and maximum salary for all positions, N of incumbents and % change in your institution’s salaries as a percentage of your comparison group’s percent change. You may also select to have additional percentiles displayed. There are two options: 20, 25, 33, 40, 50, 60, 67, 75, 80 or 10, 20, 30, 40, 50, 60, 70, 80, 90. Reports can be created using un-weighted or weighted data. Output format: HTML, PDF or Excel. © 2014 CUPA-HR 18 DataOnDemand User’s Manual Multi-Position Years in Position Report: Administrators and Professionals Surveys This report calculates the following statistics for Years in Position: Average, Median, Minimum and Maximum. You may also select to have additional percentiles displayed. There are two options: 20, 25, 33, 40, 50, 60, 67, 75, 80 or 10, 20, 30, 40, 50, 60, 70, 80, 90. Output format: HTML or PDF. Multi-Position Demographic Report: Administrators and Professionals Surveys This report calculates median salaries broken down by the following demographic variables: Gender: Male vs. Female Minority: Yes vs. No Hiring source (internal vs. external) is only available through 2012 Output format: HTML, PDF or Excel. © 2014 CUPA-HR 19 DataOnDemand User’s Manual REPORTS SPECIFIC TO THE FOUR-YEAR FACULTY SURVEY Multi-Discipline Report, 4-digit CIP Codes The Faculty Multi-Discipline Report provides average, standard deviation, median, minimum and maximum salary by rank for each 4-digit CIP code discipline, N of incumbents, N of institutions and your institution’s salaries as a percentage of the comparison group’s. You may also select to have additional percentiles displayed. There are two options: 20, 25, 33, 40, 50, 60, 67, 75, 80 or 10, 20, 30, 40, 50, 60, 70, 80, 90. The report highlights ranks at your institution that are more than 150% of the comparison group median or less than 75% of the median. If you wish, you may change these parameter values. The report automatically selects the disciplines for which your institution has reported data. Alternatively, you may select All Positions or No Positions. If you select No Positions, you must then select disciplines manually by checking the corresponding boxes, and then click the Update Selection button in order for your changes to take place. When you are ready to run the report, simply hit the Go to Report button. This report can be run one rank at a time or for all ranks at once. The report may take longer to run if you have selected a large comparison group and many or all of the disciplines. Reports can be produced using un-weighted or weighted data. Output format: HTML, PDF or Excel. There are four options for running multidiscipline statistics: Tenured/Tenure Track Faculty, Non-Tenure Track Faculty, NonTenure Track Researchers, and Tenure Track Non-Tenure Track Faculty combined. By default, you are given results for Tenured/Tenure Track Faculty; to switch to NonTenure Track for instance, select this group next to Tenure. © 2014 CUPA-HR 20 DataOnDemand User’s Manual Single Discipline Report, 4-digit CIP Codes The Single Discipline Report provides average and median of average salaries, as well as lowest and highest of reported low and high salaries by rank for one discipline, N of incumbents, N of institutions and your institution’s salaries as a percentage of the comparison group’s salaries. Reports can be produced using un-weighted or weighted data. Output format: HTML or PDF. There are four tenure options for running single discipline results: Tenured/Tenure Track Faculty, Non-Tenure Track Faculty, NonTenure Track Researchers, and Tenure Track Non-Tenure Track Faculty combined. By default, you are given results for Tenured/Tenure Track Faculty; to switch to NonTenure Track for instance, select this group next to Tenure. © 2014 CUPA-HR 21 DataOnDemand User’s Manual Aggregate Report, 2-digit CIP Codes The Aggregate Report provides a rollup of 4-digit CIP Code data to the 2-digit level. Report shows average, median, minimum and maximum salary by rank for each 2digit CIP code discipline, your institution’s salaries as a percentage of the comparison group’s and salary percentile ranks 20, 25, 33, 40, 60, 67, 75, 80 or 10, 20, 30, 40, 60, 70, 80, 90. The report includes all 4-digit CIP’s, even those with fewer than five responding institutions. Reports can be produced using un-weighted or weighted data. Output format: HTML, Excel or PDF. There are four tenure options for running 2-digit aggregate results: Tenured/Tenure Track Faculty, Non-Tenure Track Faculty, NonTenure Track Researchers, and Tenure Track Non-Tenure Track Faculty combined. By default, you are given results for Tenured/Tenure Track Faculty; to switch to NonTenure Track for instance, select this group next to Tenure. © 2014 CUPA-HR 22 DataOnDemand User’s Manual Index Reports for 2-digit and 4-digit CIP Codes Institutions often want to know how their faculty salaries compare overall or for specific disciplines to those of selected peers. The problem with a direct comparison is that the distribution of faculty by discipline and rank is unlikely to be the same across institutions. For example, if 40% of the faculty overall or in a specific discipline at one institution are full professors, but only 20% on average are full professors in the comparison group, a direct comparison of average salaries is likely to be very misleading. The 2-Digit and 4-Digit Faculty Index Reports overcome this problem by calculating overall and discipline specific salary statistics for your comparison group based on the distribution of faculty at your institution. Standardizing the distribution provides more of an “apples-to-apples” comparison and allows you to see how your average salaries compare to those of your peers if they had the same identical distribution of faculty by discipline and rank. Average, median salary and N of incumbents by rank are reported for all disciplines combined and for each discipline rank; your institution’s salaries as a percentage of your comparison group are also reported. The report highlights ranks at your institution that are more than 150% of the comparison group median or less than 75% of the median. If you wish, you may change these parameter values. Report can be produced using un-weighted or weighted data. Output format: HTML or PDF. Since statistics are based on the focus institution’s salary distribution, these reports work only if you submitted data to the Faculty survey. © 2014 CUPA-HR 23 DataOnDemand User’s Manual Multi-Discipline Report, 6-digit CIP Codes (Tenured/Tenure Track Only) The Multi-Discipline Report displays salaries by discipline and rank at the 6-Digit CIP Code level. Choose your report parameters on the selection screen and run the report by hitting the “Go to Report” button. Output format HTML or PDF. This report displays the following statistics: Average, Median, Minimum and Maximum. DEPARTMENT HEAD SURVEY REPORT The Department Head Survey report can be found under the DataOnDemand menu option and then the Survey Reports. It is located under the Four-Year Faculty Salaries as shown below: © 2014 CUPA-HR 24 DataOnDemand User’s Manual Calculates by discipline and rank: average base salary, average support, median support, average months covered and average courses reduced. It also shows percentage of respondents offering salary support, summer coverage, and course relief. PER-COURSE FACULTY SURVEY REPORT The Per-Course Faculty Survey report can be found under the DataOnDemand menu option and then the Survey Reports. It is located under the Four-Year Faculty Salaries as shown below: © 2014 CUPA-HR 25 DataOnDemand User’s Manual Calculates by discipline: Average number of faculty, average number of credit hours taught, average compensation per credit hour taught. REPORTS SURVEY SPECIFIC TO THE TWO-YEAR FACULTY SALARY Salary by Discipline Provides un-weighted and weighted salary data by academic discipline (unranked). For each discipline, mean (average), median, minimum and maximum salary information are provided. Output format: HTML or PDF. © 2014 CUPA-HR 26 DataOnDemand User’s Manual Department Head Calculates by discipline: average base salary, average support, median support, average months covered and average courses reduced. It also shows percentage of respondents offering salary support, summer coverage, and course relief. Per-Course Faculty Calculates by discipline: Average number of faculty, average number of credit hours taught, average compensation per credit hour taught. © 2014 CUPA-HR 27 DataOnDemand User’s Manual REPORTS SPECIFIC TO THE HEALTHCARE AND OTHER BENEFITS SURVEY Healthcare Benefits All reports are generated in Excel. The following Healthcare reports are available for obtaining survey results: Other Benefits These items are collected every other year. The following reports are available in Excel format: © 2014 CUPA-HR 28 DataOnDemand User’s Manual OTHER OUTPUT OPTIONS Sorted Lists Sorted Lists allow you to see individual inputs by institutions in your comparison group on variables such as number of incumbents, years in position, or average salary. The output for a sorted list is similar to that of the ordinal rank report. If a variable is confidential—which most are in salary surveys—you will see the input but not the names of the institutions. Institutional Basics are not confidential—if you select budget, student FTE, or faculty FTE, you will see institutions’ name displayed on your screen. © 2014 CUPA-HR 29 DataOnDemand User’s Manual Report Writer Report Writer allows you to view results for multiple variables at once—but only for one year at a time. To select variables to include in a report, first select a variable family. Then select one or more variables by highlighting them (while holding down the control key)—then click Add. The variables will now appear above the Generate Report button. You can add as many variables as you want—but the more you add, the slower the report will run and it will be more difficult to print results. Below is a sample of an output from Report Writer. Note: You can highlight the report body, copy it to your clipboard, and then paste it into Excel, Word, or another application. You also can save it as a slide. © 2014 CUPA-HR 30 DataOnDemand User’s Manual Slide Shows You can create your own slide show using sorted list or report writer. To create a slide hit the button “Save as Slide” as shown below: To create a slide show select “Slide Shows” under DataOnDemand and then hit “Create a new Slide Show” On the next page give your Slide Show a name and hit “Save Slide Show”. If you want others at your institution to see it, check the box next to Share This Slide Show. © 2014 CUPA-HR 31 DataOnDemand User’s Manual Once you have created your slide show you will be able to add slides to it. Go back to Slide Shows under DataOnDemand and you will see the Slide Show you have just created. At this time the number of slides showing is zero: By clicking on the slides icon you will be able to add slides to your show. On the next page, add any of the slides you have already saved to your show by checking the box and hitting the right-pointing arrow, this will move the slide to the show. If you want to remove a slide from the show, select the left pointing arrow. If your show has multiple slides, you can use the Up and Down buttons to reposition the slide within the show. Each click moves the slide up or down one place. © 2014 CUPA-HR 32 DataOnDemand User’s Manual Once you are finished adding slides to your show hit Done. The main Slide Show page will now display the number of slides added in your show: Creating a Slide using Crosstabs & Frequencies The following provides step-by-step directions on how to create slides using Crosstabs & Frequencies, and then create and add these slides to a slide show. Select Crosstabs & Frequencies from the menu. Select your Comparison Group. Select your First Year or leave as the default, which is the current year. Leave the Second Year as is -- “No Second Year.” Select the Survey and Family Group you want to analyze (Row Variable). Select the Family you want to analyze. Select the Variables you want to analyze. We suggest that you pick no more than 6 – 8 per run and fewer than that if you are using a large comparison group. Select Column Variables only if you are doing a cross-tab. If you are running a frequency, no column variable is needed. Select Generate Frequency Table. Select Save as Slide and name it. © 2014 CUPA-HR 33 DataOnDemand User’s Manual Tables and Graphs Tables and Graphs allow you to see multiple years of data for a single variable. Click on Tables and Graphs, and then on Add Comparison Group to make your selection. You may then select the variable you wish to run. A Table and Graphs page is displayed below. You will notice that options include Table, Line Graph and Save as Slide. You can select two group statistics: Mean or Median. Copying HTML Outputs into Excel To copy and paste an HTML output into Excel, highlight parts of or the whole output showing on your screen. Right click and copy to your clipboard, then switch to Excel and paste it in. Once pasted into Excel, you will need to clean up the formatting. Note that all salary reports, except for the single position/discipline, the ordinal rank reports and the 2-digit and 4-digit index reports are available in Excel format. © 2014 CUPA-HR 34 DataOnDemand User’s Manual ABOUT SAFE HARBOR GUIDELINES In DataOnDemand, both un-weighted and weighted salary data are available; unweighted data is the default for reports and weighted data is a user selected option. To comply with the Department of Justice’s Safe Harbor Guidelines, the weighted data option provides salary data only for positions with five or more responding institutions and in which no responding institution accounts for more than 25% of the incumbents. If a position has at least five responding institutions but one institution represents more than 25% of the incumbents, salary data will not show in any of the DataOnDemand reports. To read a summary of the Safe Harbor Guidelines go to http://www.ftc.gov/reports/hlth3s.htm#6 and select Statement 6. ABOUT UN-WEIGHTED AND WEIGHTED STATISTICS Weighted statistics are calculated on all reported incumbents in all institutions in your chosen Comparison Group. Each incumbent is given a weight of one; therefore an institution reporting data on four incumbents carries more weight than an institution reporting data on one incumbent for a given position. On the other hand, un-weighted, statistics are calculated on institutional averages reported by institutions in your Comparison Group; an institution reporting on two incumbents will carry the same weight as an institution reporting on four incumbents. This is an example of weighted versus unweighted average: © 2014 CUPA-HR 35 DataOnDemand User’s Manual AGING SALARY DATA In DataOnDemand, you have the option of aging salary data for the Administrators, Professionals, Non-Exempt and Four-Year Faculty in Higher Education Salary surveys. Aging allows you to run DataOnDemand salary survey reports and see estimated results had the data been collected at a different point in time (the Aging Date). You can age the data from the day after the "report as of" date (i.e., from Oct 16, 2011 for the 2011-12 academic year) to as far ahead as March 1 of the year following the end year of the survey's academic year (i.e., for the 2011-12 survey, you can age the data ahead to March 1, 2013 - roughly the time when a new year's worth of survey data are released, providing more reliable information). Aging is based on a projected annual rate of increase for the current survey year and a portion of the subsequent year. The same rate is used for both years and there is no compounding. This is an example of how aging works in DataOnDemand: Current salary = $119,000 Aging Factor = 2% Effective Date of the Data 10/15/11 Aging Date = 7/16/12 Aged Salary = $120,785 1. The monthly aging percentage is calculated. Using the example above, divide 2% by 12 months (0.02/12) = 0.001667, this is the monthly aging rate. 2. The monthly aging rate is multiplied by the number of months the data is being aged. Our aging date is 7/16/12, which equals 9 months. In the example (0.001667 x 9) = 0. 015 3. The salary that is being aged is multiplied by the rate calculated in the previous step. This will determined the amount that needs to be added to the salary. In the example $119,000 x 0.015 = $1,785 4. The aged salary is the current salary plus the amount calculated in the previous step. In the example $119,000 + $ 1,785 = $120,785 QUESTIONS? Please feel free to contact our research staff: Ray Sizemore, Ph.D. Director of Research [email protected] (865) 684-4539 © 2014 CUPA-HR Maria Calcagno, Ph.D. Senior Research Manager [email protected] (865) 862-2840 Suzi Bowen, M.A. Research Operations Manager [email protected] (865) 862-2842 36