1
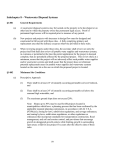
Content Preface............................................................................................................................................... 3 1 Quick Start ................................................................................................................................. 4 1.1 Introduction to the structure of system ........................................................................ 4 1.1.1 Main interface of the system............................................................................. 5 1.2 System Initialization ...................................................................................................... 6 1.3 Quick Settings of System ............................................................................................... 6 1.3.1 Set up structure tree ......................................................................................... 6 1.3.2 Level Type Definition ......................................................................................... 7 1.3.3 CTQ Definition ................................................................................................... 7 1.3.4 Definition of Defects.......................................................................................... 8 1.3.5 Grouping of Defects........................................................................................... 8 1.3.6 COM port setup ................................................................................................. 9 1.4 Setting of Control Chart................................................................................................. 9 1.4.1 Setting of Variable Control Chart....................................................................... 9 1.4.2 Settings of Attribute Control Chart.................................................................. 14 1.4.3 Setting of Batch Control Chart ........................................................................ 16 1.5 Data entry ................................................................................................................... 17 1.5.1 Data entry of Variable Control Chart ............................................................... 17 1.5.2 Data entry of Attribute Control Chart ............................................................. 19 1.5.3 Time of data entry and Time of sampling inspection ..................................... 21 1.5.4 Input Level information of data point ............................................................. 21 1.6 Chart Filter and Selected Basket ................................................................................. 23 1.6.1 Chart Filter ...................................................................................................... 23 1.6.2 Selected Basket ............................................................................................... 24 1.7 Chart View and Capability Analysis ............................................................................. 24 1.7.1 Chart View....................................................................................................... 24 1.7.2 Single chart view ............................................................................................. 24 1.7.3 Properties ........................................................................................................ 31 1.7.4 Multiple charts view ........................................................................................ 31 1.8 Summary Report ......................................................................................................... 37 1.8.1 Process Capability Summary ........................................................................... 37 1.8.2 Yield Summary Report ..................................................................................... 39 2 System settings........................................................................................................................ 40 2.1 Basic setup .................................................................................................................. 40 2.1.1 Definition of Level Type ................................................................................... 40 2.1.2 Definition of CTQ ............................................................................................. 41 2.1.3 Definition of Defects........................................................................................ 42 2.1.4 Grouping of Defects......................................................................................... 42 2.1.5 COM port setup ............................................................................................... 43 2.1.6 Setup of Control Chart..................................................................................... 44 2.2 Settings of System Structure Tree ............................................................................... 45 2.3 Authority Setting ......................................................................................................... 45 ~2~ 3 4 2.3.1 User Settings ................................................................................................... 45 2.3.2 User Group Settings ........................................................................................ 46 2.3.3 User to Group Settings .................................................................................... 47 2.3.4 Change password ............................................................................................ 48 2.4 Setting of system options ............................................................................................ 49 2.4.1 General settings .............................................................................................. 49 2.4.2 View Option .................................................................................................... 49 2.4.3 Setting of OOC(Out of Control) Action ............................................................ 50 2.5 Data Maintenance ....................................................................................................... 51 Disposal mechanism of OOC(Out of Control) .......................................................................... 51 3.1 Rule of OOC ................................................................................................................. 51 3.2 Disposal of OOC ........................................................................................................... 52 3.3 Audit mechanism of OOC disposal .............................................................................. 53 Support.................................................................................................................................... 54 Preface The traditional quality control is dependent on the final product inspection to screen out the nonconforming products. This method usually cause serious scrap because unable to effectively ~3~ control the quality of the process. Statistical process control (SPC) is focus on process control and nonconforming prevention. Through data collection and analysis, user can identify the unnatural or “non-random” variation which is caused by special or assignable causes. So user can prompt take corrective action to eliminate the unnatural variation and improve the process performance. As the most important tool of six sigma management, SPC can support company to achieve 6 Sigma quality level. SPC has been gradually applied in various industries. But many companies still have a big problem on how to integrate the actual demand with SPC system, such as spread SPC knowledge, the level of information technology application, and cost concerns etc.. After investigating the actual needs of various companies, we developed the innovative products Smart SPC Monitor. Smart SPC Monitor feature: 1. Easy to use, practical and lower cost 2. Support a variety of methods for data entry 3. Diversified and customized report generation and data export function 4. Perfect mechanism in the alarm and disposal of OOC 5. High security in Authority Assignment mechanism Our vision is to provide our customers with the Intelligent Manufacturing Solution which aims to help to improve quality and reduce cost. Notes in Help Manual: 1.If no any special annotations, the “Click” in the help manual stands for clicking the left mouse button; 2. If no any special annotations, the “Double-Click” in the help manual stands for double-clicking the left mouse button; 3. “Notes” refers to the matters user need to pay more attention in operation or something needed to be explained specially; 1 Quick Start This chapter gives user a brief introduction to the key section of this system, which makes users get familiar with this system in a short time and be able to take control of the process by using this SPC system. 1.1 Introduction to the structure of system This chapter will gives user a detailed introduction to the structure of the software. Users ~4~ will be familiar with the main setting interface after studying this chapter. 1.1.1 Main interface of the system The main interface of Smart SPC system is as below picture. Both the area of structure tree and the area of control chart list are blank before starting the setting procedure. Area of Structure Tree: The structure tree is similar to the directory structure in Windows OS. The users need to plan the structure tree according to the actual products structure of the enterprise. The structure tree will be shown in the Area of Structure Tree of the main interface. Area of Control Chart List: All the control charts set up by users will be shown in this area. If there is a great amount of control charts, they will be listed by pages. The structure tree will be shown in the Area of Structure Tree after users set it up. The Area The Area of Control Chart List of Structure tree ~5~ 1.2 System Initialization 1.3 Quick Settings of System 1.3.1 Set up structure tree On the main operation interface, right click the mouse and then click to the “Create” button to add a new directory structure. The directory structure which user sets up for the first time is the root directory. Other newly created directory structures will be saved in the subdirectory of the directory structure that is selected by the mouse. ~6~ 1.3.2 Level Type Definition Nine different styles of level structures are available for users to custom settings in our system. “Optional Value” is the value set by user in advance. For example, in order to set “Equipment Number” as level structure, just need to click the button of “Option Value”, then users are able to set the equipment number in advance, such as setting it as “#01,#02”. Operation Approach: “Basic Setup” “Definition of Level Type” 1.3.3 CTQ Definition Critical to Quality (often referred as CTQ in English), is the main control object in the control process of SPC, such as physical measurement data, length, height of product, the resistance of electrical parameters, capacitance etc.. Operation Approach: ”Basic Setup” ” CTQ Definition” ~7~ 1.3.4 Definition of Defects Before apply control chart like P, nP, U to monitor the defects, it is necessary for user to set the defects in the system in advance. The code and name must be filled in the system. Operation Approach: "Basic Setup""Definition of Defects" 1.3.5 Grouping of Defects As most of common poor items only appear in a certain range of products or working processes, it is necessary for users to sort them to different products or working processes after completing the settings of Defects Operation approach: "Basic Setup"" Grouping of Defects" ~8~ 1.3.6 COM port setup Before the instrument with automatical data acquisition function transfers the data to the Smart SPC, users need to set the connection parameter of serial port. Only when the connection parameter is set up correctly, can the data be transferred to the system successfully. As to the setup of parameters, users can refer to the user manual of the instrument that users purchased in more details. After completing the setup of parameters, users can test whether it can read the data in the instrument or not. Operation Approach: "Basic Setup""COM port setup” 1.4 Setting of Control Chart Setting of Control Chart is one of the most important parts in the system setting. The following is a detailed introduction to the setting of control chart. The setting of control chart includes the Setting of Variable Control Chart and the Setting of Attribute Control Chart. 1.4.1 Setting of Variable Control Chart a) Select a certain directory structure which is needed to be set up with a mouse. ~9~ b) Click “Basic Settings” “Chart Settings”, and enter the operation interface of Chart Settings. c) Select the chart types, the types of Variable Control Chart involve XR, XS and IMR. If the sampling number is less than 10, users can select XR type; If it is greater or equal to 10, please choose XS type; If it is 1 each time, just select IMR type. Click the button of “Add” and select the CTQ from the window of “Select CTQs”. d) ~ 10 ~ e) After user set up UCL (Upper Control Limit), Target and LCL (Lower Control Limit), Click button of “OK”. Apart from “Sample size” and “Decimal Places”, other parameters can be set in the future. f) Setting of Chart-level info The aim of setting the chart-level info is to mark the control chart or data point in the chart hierarchically, making users get to know the level type that every control chart or data point belongs to. Chart-level info: click the button of “Set” behind the setting of “Chart-Level Info”, and enter the window below. If users need to set the Chart Level Info, please select the corresponding level type. Meanwhile, user can select the value of the corresponding level info or directly ~ 11 ~ input its content as well. Data Point Level Info: click the button of “Set” behind the setting of “Data Point Level Info”, and enter the window below. As to the items which have been set in the setting of “Control Chart Level Info”, they will turn to be grey and not optional. Users can not set the data point level info in the Data Point Level Info. The operation in setting Data Point Level Type Info is similar to that of setting Control Chart Level Type Info. ~ 12 ~ g) Setting of Control Limit In the analysis phase, the Control Limit can be left blank and does not need to be set right now. When it comes to the Control Phase, in other words, the working procedures are in a stable state, users need to set a stationary control limit at this time. There are two ways to set the stationary control limit: 1. Calculate the control limit according to all the datum in the analysis phase. Click the button of “Calculate”, the system will figure out the value of control limit automatically. 2. User inputs the control limit which has been calculated through other ways directly. Click the button of “Remove” to remove the value of control limit which users have set already. ~ 13 ~ 1.4.2 Settings of Attribute Control Chart a) b) Attribute Control Chart contains four different kinds of control charts: P, nP, U and C. The settings of Attribute control chart is similar to the settings of variable control chart. The main difference is some parameter settings. The following is a detailed introduction to the setting of each Attribute Control Chart. P control Chart The CL (Central Value) of P control Chart is the percent defective which is calculated according to the historical data, users can leave it blank or input it directly according to the historical data. Leaving CL blank means that it will be recalculated automatically according to the datum which user inputs every time. nP Control Chart The nP Control Chart of the quantity of defective goods. nP control chart is basically the same as P control chart, the only difference is that the sample size in nP control chart is constant. Sample Size: user can input the sample size that sample regularly every time. Control Limit: user can leave it blank or input it directly according to the historical data. If users leave it blank, the system will calculated the control limit according to all data when users input new data. ~ 14 ~ c) U control chart U control chart is the control chart of the quantity of defects in control unit. The CL of U control chart is the quantity of defective goods (quantity of defects) in each inspection unit. The CL (Central Value) of U control Chart is the quantity of defects in each unit product which is calculated according to the historical data, users can leave it blank or input it directly according to the historical data. Leaving CL blank means that it will be recalculated automatically according to the datum which user inputs every time. Remark: The difference between U control chart and P control chart U control chart is mainly used to control the quantity of defects of one single product, like the quantity of defects of cloth; P control chart monitors whether the whole good is defect or not, in other words, it controls the quantity of defective goods. ~ 15 ~ d) C control Chart C Control Chart is used to monitor the quantity of defects under the constant sampling size. C Control Chart requires that the sample size or the inspective quantity keep constant. Main usage: 1.Defects spread over the continuous product flow (such as the defects on nylon, bubble on the glass) or the something represented with the average ratio of defects (the defects on the 100 square meters of nylon). 2. The defects caused by different potential factors may be found in single inspection lot. (The component may have one or more defects) Sample Size: user can input the sample size that sample regularly every time. Control Limit: user can leave it blank or input it directly according to the historical data. If users leave it blank, the system will calculated the control limit according to all data when users input new data. 1.4.3 Setting of Batch Control Chart Setting of Batch Control Chart enables users to batch setting over two control charts. It is mainly used to set the items with the same value. The parameters on the control chart below can be set by users. a) Specification b) Sample size c) Decimal Places d) Test rule of OOC e) Chart Level Info f) Data Point Level Info ~ 16 ~ g) Control limit h) Alarm Grade Setting i) Batch modifying the No. of control chart 1.5 Data entry 1.5.1 Data entry of Variable Control Chart There are so many ways of data entry in Variable Control Chart, manual entry mode and automatic data acquisition mode. The following is the primary operating instructions of manual entry mode: a) Select the control chart which needs to input datum on the main operation interface. Click the button of "Data Manipulation" "Single Item Entry", enter the operation interface as below. Method of operation NO.2: Right click the mouse and choose the "Single Item Entry" from the pop-up menu, then enter the interface of data entry. b) Method of manual data entry Input directly: users can input the corresponding number in the blank column according to the sample size. The data in each row is all the sample data of a control point. Paste method: users can copy the datum from other software and paste in the corresponding blank column. ~ 17 ~ c) Automatic data acquisition method There is not much difference between Automatic data acquisition mode and Manual entry mode on the method of operation. Firstly position the cursor in the first blank of the interface of Data Entry, then click the button of "Start" at the top left corner, it will start to acquire the data automatically. If users click the button of "Stop" at the top left corner, it will stop right now. d) Settings of Data Entry Interface Display Control Chart: Choose whether to show the control chart or not on the Data Entry interface Pop up alarm of runaway automatically: Choose whether to pop up alarm of runaway Settings: Click the button of "Setting" at the top right corner of Data Entry Interface, it will pop up the window below. Users can set the quantity of historical data points which are callout by the Data Entry Interface from data base when inputting the data. The system default quantity is 30, and it is also 30 at least. e) Multiple items input function Please select multiple control charts which need to input data on the main operation interface of the system, click the button of “Data Operation” “Multi-Input”, then enter the operation interface. ~ 18 ~ 1.5.2 Data entry of Attribute Control Chart a) b) The operation is the same as that of Data entry of Variable Control Chart, and the operation method to enter operation interface of data entry is exactly the same as that of Data entry of Variable Control Chart. The following is the detailed introduction to each one. P control chart Quantity of Sampling Inspection: The sum of inspection samples Input of the quantity of defective goods: Input the quantity of defective goods in the blank of corresponding defective goods. nP control chart As the quantity of sampling inspection in nP control chart must be constant and has been fixed when setting the control chart, what makes it different from P control chart is that it needn’t to be input the quantity of sampling inspection. ~ 19 ~ c) U control chart Quantity of Sampling Inspection: The sum of inspection samples Input the quantity of defects: Input the quantity of defects to the corresponding column of Defect. d) C control chart As the quantity of sampling inspection in C control chart must be constant and has been fixed when setting the control chart, what makes it different from U control chart is that it needn’t to be input the quantity of sampling inspection. ~ 20 ~ 1.5.3 Time of data entry and Time of sampling inspection Time of data entry: The time point to input the data to the system Time of sampling inspection: The time point that samples are inspected in production line 1.5.4 Input Level information of data point a) Level Information Setting of data point If users need to stratify each control point in the control chart, first of all, users need to set the level information of data point as well while setting the control chart. After it, a corresponding column to input level information will be added to the operation interface of the Data Entry. As to the specific method of settings, please refer to the introduction to the settings of control chart. ~ 21 ~ b) Input Level information of data point There are two ways to input level information of data point: 1. Input the level information manually 2. Autofill the level information, there are also three ways to autofill the level information: Default: Set the level information as default which is set when setting the control chart The same as last data point: Set it the same as the last level info of data point Blank: Do not input the level information, leaving the level information blank. ~ 22 ~ 1.6 Chart Filter and Selected Basket 1.6.1 Chart Filter The conditions in the Chart Filter include: State of Control Chart, Number and Inspection Items and all the types of level information. “###” means that any filter conditions will not be selected. ~ 23 ~ 1.6.2 Selected Basket Selected Basket is for users to analyze multiple control charts at the same time or store the control charts temporarily while setting. a) Open the Selected Basket: Select any control chart, click the icon of “Data Operation” “Add to the Selected Basket”, this control chart will be added to Selected Basket which is placed at the bottom of the operation interface. b) Add control chart to the Selected Basket: Double click the control chart which needs to be add to the Selected Basket, it will be added to the Selected Basket. c) Remove control chart from Selected Basket: Double click the control chart on the Selected Basket, it will be removed from the Selected Basket. 1.7 Chart View and Capability Analysis 1.7.1 Chart View This system provides users with different kinds of analysis methods (Like control chart, CPK analysis) to analyze the qualitative data. The analysis methods can be broken down into Single Chart View and Multiple Chart View, as it shows below: 1.7.2 Single chart view There are two different kinds of operational approaches of Single chart view: 1. Select one control chart which needs to be analyzed on the main interface of control chart, click the icon of “Chart View” “Single chart view”, then select one analysis method user needs within the area of “Single chart view”. 2. Select one control chart which needs to be analyzed on the main interface of control ~ 24 ~ chart, double click it by mouse. The analytical interface of Single chart view is shown below. a) b) c) Range:Select the time; Users can select the time range according to the inputting date and sample date. Properties: Summarize and display all the content of control chart, including the number of data point, out-of-control point and the capability indices of control chart, as it shows below. Filter function: Filter the level info of data point; The system will filter and analyze the datum which match the condition. The following is an example to filter the data of production batch. ~ 25 ~ d) Settings of View Options Display Chart Title: Choose whether to display the title of control chart above it Display Details: Choose whether to display the detailed data of control chart on the interface Display Control Limit: Choose whether to display the control limit on the control chart Display Excluded Point: Choose whether to display the data points which are excluded Display Specification: Choose whether to display the specification on the control chart Display page statistics: Choose whether to display the capability indices below the control chart Coordinate of Horizontal Axis on control chart: Choose to display it according to the sample date or inputting date. Optional data modes on Horizontal Axis includes: sequence number of data point, entry data, entry time, sampling data, sampling time, entry date and time, sampling date and time. Y axis suffix: Choose whether to add the suffix(e.g. unit ) in Y axis Number of data points on each page: Choose the number of data points which will be shown on the control chart. Parameter Settings about the calculation of CPK Subgroup Size: Set the size of subgroup Sigma line: Choose whether to display the Sigma line on the Histogram Histogram Bars: Set the number of histogram cell, “0” means that it will calculate automatically. ~ 26 ~ Methods of estimating within subgroup standard deviation: There are three different kinds of methods to calculate within subgroup standard deviation, the traditional method is to calculate it through range. The recognized and accurate method is to estimate it by Pooled standard deviation. e) f) Export function: Export control chart and data to Excel file. Category of chart: User can view different types of analytical charts 1. Control chart The red point on control chart means that this point is out of control. Red "*" means that this data point has broken one of the eight conventional out-of-control rules. Red "◆" means that at least one data point in the sample exceeds the specification line. Data which exceed the specification in the data area will be displayed in highlighted color. ~ 27 ~ On the setting interface, user can customize the styles of the viewing interface, as it is shown below. 2. Capability Analysis: As CPK data is related to subgroup size and the methods of estimating within subgroup standard deviation, user need to choose subgroup size and the methods of estimating within subgroup standard deviation. Different options may result in a slight difference in CPK value, but the PPK value will not be affected. 3. Run Chart The red point in the run chart means the data point out of specification. ~ 28 ~ 4. Mean Run Chart The trend line in the Mean Run Chart is the link of mean value of each group of data, each group of data lines at the same ordinate. 5. Normal Test: Normal Test is mainly used to check whether all data fit the normal distribution. Generally speaking, it fit the normal distribution if the P value is less than 0.05 ~ 29 ~ 6. CPK Trends: Each data point in the CPK Trend Chart is the CPK value of this group of data. There are three different kinds of methods to calculate the standard deviation, which has a close relationship with CPK value. Different methods may lead to slight difference in CPK value. 7. Yield Trends: Each point on this chart is the yield of this group of data. If user has not set the specification, the percent of pass will be 100% and the calculation is not carried out. ~ 30 ~ 1.7.3 Properties Chart properties summarize the information of this chart, such as the number of data point, the number of OOC point, and the statistical value of chart etc.. 1.7.4 Multiple charts view Multiple charts view is a very useful analytical mode which is mainly used to analyze multiple parameters contrastively. Typical analysis modes include: a. Contrastive analysis between multiple different parameters b. Contrastive analysis of the same parameters under different conditions a) Select multiple control charts Operational Approach1: Hold down the “Ctrl” button and select multiple control charts on the main interface by using the mouse. Operational Approach2: Pop up menu through the right mouse button and add control charts to the selected basket. ~ 31 ~ b) Analysis between multiple charts 1. View the contrastive modes Display mode: user can define single-page or multi-page display mode. Single-page mode is to display all charts on one page. Multi-page display mode is to display a fixed amount of charts on each page. Types of chart: user can switch it between different types of charts easily. There are six different types of charts available in the current system. ~ 32 ~ Graph list mode: user can change the display order of graphs by using UP or DOWN button. Filter option: Use to unify the abscissa display range of each chart. As it is shown below, unify the display range of abscissa from 2 to 3 so that user can analyze three histograms more conveniently. ~ 33 ~ Compose type of analytical data in CPK analytical chart: it enables user to click the right button of mouse to pop up menu and then choose whether to display relevant data items or not Choose time range: Click the option of “Single Chart Filter” on the right-click menu, the time selection column will be shown in the system as it is shown below. Select detailed data which will be shown below the interface. ~ 34 ~ 2. Multi-CTQs Comparison Chart User can decide whether to display curve by selecting or anti-selecting the CTQ on the right side of the chart. 3. Correlation Chart Correlation Chart is used to analyze the correlation between two parameters. User need to select two parameters for analysis ~ 35 ~ 4. Real Time Monitoring The function of Real Time Monitoring is used to real-time monitor the data of control chart. User can choose the chart for real-time monitor. Meanwhile, user can set the parameter in the “Options” as it is shown below. 5. Merge view User can merge the data of multiple charts in one chart for viewing and analysis. Only the control chart with the following conditions can be merged to analyze: 1) Same type of Variable Control Chart 2) Same sample size 3) The specification in merged CPK chart will adopt the latest specification. ~ 36 ~ 1.8 Summary Report The columns of Summary Report provide users with a variety of Summary function so as to meet their needs of report. The standard version contains two basic reports types: Capability Analysis and Yield Summary Report. Our system provides the customized report according to different demands of customers. 1.8.1 Process Capability Summary The summary report for Process Capability is analyzed based on the control chart. CPK and PPK data are calculated based on the current specifications value. If the specifications value in control chart are not set, CPK and PPK parameters will not be calculated. a) Select the control group items which need to be analyzed b) Select the parameter which needs to be calculated c) Select the level information which needs to be displayed in the summary report ~ 37 ~ d) Use filter function to sift data, like choosing time or level conditions and so on. If not using the filter condition, the system will summarize all data. e) In the report form, if the CPK or PPK data is lower than a definite value, the background color will be highlighted. Generally speaking, the standard value is 1.33, and if users click the row, users will have a look at the detailed data and graphs of the corresponding control charts. ~ 38 ~ 1.8.2 Yield Summary Report a) Select the control group item for analysis. b) Select the level information which needs to be displayed in the report form c) Use filter function to sift data, like choosing time or level conditions and so on. If not using the filter condition, the system will summarize all data. d) Select the control chart which needs to be analyzed and choose the defect types that need ~ 39 ~ to be displayed e) The quantity and percent of defects or defective products are gathered in the report form, and their percent is calculated based on the total quantity of defects or defective products. 2 System settings Quick start in the first Chapter has made the instructions for the method of System Setup, and this Chapter will give user a supplementary instruction to some parts which have not been described in details in the first Chapter. 2.1 Basic setup Although Basic Setup is the first step of the System Setup, users should make a detailed analysis to system architecture before the basic setup, in order to decide the content of the basic setup. Parts of basic settings should not be modified after the system starts to run, or it will lead to the inconsistency of system Properties, like Definition of Level Type. 2.1.1 Definition of Level Type The System has offered users nine level types to custom it by themselves. Alternative values are preset by users, for example, users can click "Option values" button for presetting the equipment ~ 40 ~ serial number when building a hierarchy type of equipment serial number, and here, for example, set the equipment serial number as "#01, #02". Operational Approach: "Basic Setup" "Level Type Definition ". Users may add option values in the Level Info in advance, as the screenshot shows below: 2.1.2 Definition of CTQ Critical to Quality (CTQ), is the main control object in the control process of SPC, such as physical measurement data, length, height of product, the resistance of electrical parameters, capacitance etc.. Operational Approach: "Basic Setup" " CTQ Definition ". Notice: Generally, when the system starts, do not delete or change the name of CTQ because the modification would change the name of CTQ in the control chart accordingly. ~ 41 ~ 2.1.3 Definition of Defects Users should preset Defects item in the system before monitoring defects by P, nP, U and C control chart. In the setting of Defects, the code and name must be filled. Operational Approach: "Basic Setup" "CTQ Definition ". 2.1.4 Grouping of Defects As defects only appear in some fields of products or process, users should sort these defects to different products or different process after setting the Defects item,. Operational Approach: "Basic Setup" "Defects Grouping ". ~ 42 ~ 2.1.5 COM port setup Before automatical data acquisition to the Smart SPC system, users need to set the connection parameter of serial port. Only when the connection parameter is set up correctly, the data can be transferred to the system successfully As to the setup of parameters, users can refer to the user manual of the instrument in more details. After completing the setup of parameters, users can test whether it can read the data from the instrument or not. Operation Approach: "Basic Setup""COM port settings” ~ 43 ~ 2.1.6 Setup of Control Chart a) Clone the control chart Clone a new control chart with same setting in the same control group. Operational Approach: Choose one chart and click "Clone" button, and then "OK" button. Note: Without clicking the "Ok" button, the cloned control chart will not be saved in the system b) c) Modify the serial number of control chart The serial number of control chart is an auxiliary method for users to distinguish control charts. Users can modify the serial number of control charts. Settings of tests of control chart R1 ~ R8 Rules are the current international recognized SPC control rules, R0 criteria for recognition of the data which is out of specification. Actually, R0 has a great significance in the actual application. R0 and R1 test rules are default settings for a new control chart. ~ 44 ~ Users can modify the tests according to different needs. d) Copy and paste control chart Users can right-click the pop-up menu in main interface to copy and paste the control chart, the operation is similar to copy and paste files under Windows operating system. The data of control chart will be copied into the new control chart accordingly. 2.2 Settings of System Structure Tree As the system structure tree is the main structure in system operation, users should decide the structure tree according to their needs and the definition of Hierarchical Type. After running the system, generally, it is not suggested to modify the structure, except for adding control groups 2.3 Authority Setting 2.3.1 User Settings If users have not set the effective date and expiry date, the system would default users to take effect immediately, meanwhile there is no expiry date. ~ 45 ~ 2.3.2 User Group Settings The authority management of system is managed by means of user groups, so users can different user groups according to their need. For example, set an administrative group administrators of the system, set an entry group for date entry staffs, in the meantime, managing different scopes of products, the manage groups for staffs probably needs to according to different manage scopes. set for for set The system authorizes user groups directly, but not a single user. So after a user has belong to a user group, it will get a corresponding authority of the user group. The authorities of user group contain three types: system permission, data permission and control group permission. System privileges: permission for operations on system settings. ~ 46 ~ Data privileges: Permission for related operations on data processing. Control Group permission: Permission for operations on control groups. Users can only view the control groups with operation permission. 2.3.3 User to Group Settings The system authorizes user groups directly, but not a single user. So after a user has belonged to a user group, it will get a corresponding authority of the user group. Assigned users in different user groups. ~ 47 ~ 2.3.4 Change password ~ 48 ~ 2.4 Setting of system options 2.4.1 General settings Show Title: Set display mode of control charts in structure tree. Sort by: Set ordering mode of control charts in structure tree. List of control charts: Set the display quantity of control charts on each page in main interface. Date entry: Set the system response mode in data entry. Chart View: Set the display mode for graphic displaying interface. 2.4.2 View Option Users need to set reasonable days according to both the size of date amount of system and practical needs. The greater number of days will slow down system processing speed. ~ 49 ~ 2.4.3 Setting of OOC(Out of Control) Action Properties setting of Email: Set properties for Email server which sending the alarm mails; SMTP server: The IP address or domain name and port address of server which sending the alarm mails, as, mail.google.com; Email Address of Sender: Set private address of sender who send the alarm mail; Users Name: Mail username of the sender who logins in mail server, which generally is the same as the Email address. Password: The password of sender's email. Email Address of Receiver: The email address of Receiver who receives the alarm mail of out-of-control. ~ 50 ~ 2.5 Data Maintenance Backup data: Backup the current data of system, the data for web edition would be backup in catalogue of server, so users should input a catalogue when backupping. Restore data: Restore the backup data, users should input the path and name of the backup files when restore the backup data for web edition. Format data: Initially configuring systems, all current data will be deleted. 3 Disposal mechanism of OOC(Out of Control) 3.1 Rule of OOC System will remind users the OOC status in various methods. a) Color alarm of control charts: Different colors to show the OOC status; b) Alarm for data points of control charts: unsettled OOC points would be in red, the settled OOC points would be in green. ~ 51 ~ 3.2 Disposal of OOC a) Click the OOC points in control charts, the system will pop up a window as the picture below, click "Action" button to process the OOC points; b) Type in the reason and action of OOC in the window of OOC Action; c) Users can choose an appropriate action from the history experience database, or save the new action to history experience database. ~ 52 ~ 3.3 Audit mechanism of OOC disposal a) The action of OOC points should be approved by the senior administrator, for rejected action need to be handled again; b) Manager can batch process the OOC data point. ~ 53 ~ 4 Support Company Website: http://www.smartspc.com Support Email: [email protected]; Sales Email: [email protected] ~ 54 ~