1
GEOSYSTEM® LabSuite4
Software for Atterberg Limits, Grain Size Distribution Tests,
Soil Classification and
Moisture-Density Tests
User’s Guide
Copyright 2005-2009 Von Gunten Engineering Software, Inc.
363 West Drake #10
Fort Collins, CO 80526
http://www.geosystemsoftware.com
Information in this document is subject to change without notice and does not represent a commitment on the part of Von Gunten Engineering Software, Inc. The software described in this document
is furnished under a license agreement, and the software may be used or copied only in accordance
with the terms of that agreement. The licensee may make copies of the software for backup purposes
only. No part of this manual may be reproduced in any form for purposes other than the licensee’s
personal use without the written consent of Von Gunten Engineering Software, Inc.
Copyright Von Gunten Engineering Software, Inc. 2005-2009. All rights reserved.
Published in the United States of America.
GEOSYSTEM® is a registered trademark of VES, Inc.
Windows® is a registered trademark of Microsoft Corporation
Last revised October 9, 2009.
Contents
1 Introduction
1.1 Program Features . . . . . . . . . .
1.1.1 New Features in Version 4
1.2 Tutorial . . . . . . . . . . . . . . .
1.3 Contacting Technical Support . . .
.
.
.
.
1
1
2
6
6
.
.
.
.
.
.
.
.
.
.
.
.
.
.
.
.
.
.
.
.
.
.
.
.
.
7
7
8
8
9
10
12
12
13
15
16
17
18
20
21
21
22
23
24
24
25
25
27
28
32
33
3 Entering Grain Size Test Data
3.1 Sample and Test Information . . . . . . . . . . . . . . . . . . . . . . .
3.1.1 Sample Info. Selection Lists . . . . . . . . . . . . . . . . . . .
35
35
40
.
.
.
.
.
.
.
.
.
.
.
.
.
.
.
.
.
.
.
.
.
.
.
.
.
.
.
.
.
.
.
.
.
.
.
.
.
.
.
.
.
.
.
.
.
.
.
.
2 Configuration
2.1 Data Entry Options . . . . . . . . . . . . . . . . . . . .
2.2 Reporting Options . . . . . . . . . . . . . . . . . . . . .
2.2.1 Printout Margins . . . . . . . . . . . . . . . . .
2.2.2 General Chart Report Options . . . . . . . . . .
2.2.3 Automatically Exporting Reports . . . . . . . .
2.3 Grain Size Distribution Configuration . . . . . . . . . .
2.3.1 Grain Size Chart Scales . . . . . . . . . . . . . .
2.3.2 Grain Size Charting Options . . . . . . . . . . .
2.3.3 Grain Size Chart Reports . . . . . . . . . . . . .
2.3.4 Grain Size Test Calculation Options . . . . . . .
2.3.5 Sieve Opening Size Measurements . . . . . . . .
2.3.6 Grain Size Specification Envelopes . . . . . . . .
2.3.7 Sieve Nests . . . . . . . . . . . . . . . . . . . . .
2.4 Atterberg Limits Configuration . . . . . . . . . . . . . .
2.4.1 Plasticity and Blows vs. Moisture Chart Settings
2.4.2 Atterberg Limits Chart Reports . . . . . . . . . .
2.4.3 Atterberg Limits Calculation Options . . . . . .
2.5 Soil Classifications Configuration . . . . . . . . . . . . .
2.5.1 USDA Chart Report Settings . . . . . . . . . . .
2.6 Moisture-Density Test Configuration . . . . . . . . . .
2.6.1 Moisture-Density Report Settings . . . . . . . .
2.6.2 Moisture-Density Calculation Options . . . . . .
2.6.3 Moisture-Density Test Specifications . . . . . .
2.7 Saving Sets of Configuration Settings . . . . . . . . . . .
2.8 The Container List . . . . . . . . . . . . . . . . . . . . .
iii
.
.
.
.
.
.
.
.
.
.
.
.
.
.
.
.
.
.
.
.
.
.
.
.
.
.
.
.
.
.
.
.
.
.
.
.
.
.
.
.
.
.
.
.
.
.
.
.
.
.
.
.
.
.
.
.
.
.
.
.
.
.
.
.
.
.
.
.
.
.
.
.
.
.
.
.
.
.
.
.
.
.
.
.
.
.
.
.
.
.
.
.
.
.
.
.
.
.
.
.
.
.
.
.
.
.
.
.
.
.
.
.
.
.
.
.
.
.
.
.
.
.
.
.
.
.
.
.
.
.
.
.
.
.
.
.
.
.
.
.
.
.
.
.
.
.
.
.
.
.
.
.
.
.
.
.
.
.
.
.
.
.
.
.
.
.
.
.
.
.
.
.
.
.
.
.
.
.
.
.
.
.
.
.
.
.
.
.
.
.
.
.
.
.
.
.
.
.
.
.
.
.
.
iv
CONTENTS
3.2 Sieve Test Data Entry . . . . . . . . . . . . . .
3.2.1 #200 Wash Test . . . . . . . . . . . . .
3.2.2 Entering the Sample Weight . . . . . .
3.2.3 Cumulative Pan Weight . . . . . . . . .
3.2.4 Entering Sieve Sizes . . . . . . . . . . .
3.2.5 Entering Sieve Weights . . . . . . . . .
3.2.6 Split Samples . . . . . . . . . . . . . . .
3.2.7 Saving the Current Test as a Sieve Nest
3.3 Hydrometer Test Data Entry . . . . . . . . . .
3.3.1 Test Background Information . . . . .
3.3.2 The Hydrometer Test Readings Grid . .
.
.
.
.
.
.
.
.
.
.
.
42
42
43
44
45
46
47
48
50
50
52
4 Viewing and Modifying the Particle Size Curve
4.1 Selecting the .45-Power Curve Maximum Density Line . . . . . . . . .
4.2 The Chart Calculator . . . . . . . . . . . . . . . . . . . . . . . . . . .
53
54
54
5 Entering Atterberg Limits Test Data
5.1 Atterberg Limits Sample Information . .
5.2 Atterberg Limits Test Entry . . . . . . . .
5.2.1 Liquid Limit Test Data Entry . . .
5.2.2 Plastic Limit Test Data Entry . . .
5.2.3 Natural Moisture Test Data Entry
.
.
.
.
.
55
55
56
56
58
58
.
.
.
.
.
.
59
59
61
62
63
65
66
.
.
.
.
.
.
.
67
67
67
68
69
69
70
72
.
.
.
.
.
.
.
.
.
.
.
.
.
.
.
6 Soil Classifications
6.1 USCS Classification . . . . . . . . . . . . . . .
6.1.1 Classifying Soil with +3 Inch Material
6.2 AASHTO Classification . . . . . . . . . . . . .
6.3 Burmister Classification . . . . . . . . . . . . .
6.4 USDA Classification . . . . . . . . . . . . . . .
6.5 AS 1726 Classification . . . . . . . . . . . . . .
7 Entering Moisture-Density Test Data
7.1 Moisture-Density Sample Information . . . .
7.2 Moisture-Density Test Entry . . . . . . . . .
7.2.1 Test Specifics . . . . . . . . . . . . . .
7.2.2 Sieve Percentages . . . . . . . . . . .
7.2.3 Oversize Correction . . . . . . . . . .
7.2.4 Proctor Test Data . . . . . . . . . . .
7.2.5 California Test Method 216 Test Data
.
.
.
.
.
.
.
.
.
.
.
.
.
.
.
.
.
.
.
.
.
.
.
.
.
.
.
.
.
.
.
.
.
.
.
.
.
.
.
.
.
.
.
.
.
.
.
.
.
.
.
.
.
.
.
.
.
.
.
.
.
.
.
.
.
.
.
.
.
.
.
.
.
.
.
.
.
.
.
.
.
.
.
.
.
.
.
.
.
.
.
.
.
.
.
.
.
.
.
.
.
.
.
.
.
.
.
.
.
.
.
.
.
.
.
.
.
.
.
.
.
.
.
.
.
.
.
.
.
.
.
.
.
.
.
.
.
.
.
.
.
.
.
.
.
.
.
.
.
.
.
.
.
.
.
.
.
.
.
.
.
.
.
.
.
.
.
.
.
.
.
.
.
.
.
.
.
.
.
.
.
.
.
.
.
.
.
.
.
.
.
.
.
.
.
.
.
.
.
.
.
.
.
.
.
.
.
.
.
.
.
.
.
.
.
.
.
.
.
.
.
.
.
.
.
.
.
.
.
.
.
.
.
.
.
.
.
.
.
.
.
.
.
.
.
.
.
.
.
.
.
.
.
.
.
.
.
.
.
.
.
.
.
.
.
.
.
.
.
.
.
.
.
.
.
.
.
.
.
.
.
.
.
.
.
.
.
.
.
.
.
.
.
.
.
.
.
.
.
.
.
.
.
.
.
.
.
.
.
.
.
.
.
.
.
.
.
.
.
.
.
.
.
.
.
.
.
.
.
.
.
.
.
.
.
.
.
.
.
.
.
.
.
.
.
.
.
.
.
.
.
.
.
.
.
CONTENTS
8 Viewing and Modifying the Moisture-Density Curve
8.1 Toolbar Controls . . . . . . . . . . . . . . . . . . . .
8.2 Reshaping the Curve . . . . . . . . . . . . . . . . . .
8.3 Changing How the Curve is Displayed . . . . . . . .
8.4 Creating Curves for One-Point Tests . . . . . . . . .
v
.
.
.
.
.
.
.
.
.
.
.
.
.
.
.
.
.
.
.
.
.
.
.
.
.
.
.
.
9 Reporting Your Data
9.1 Chart Reports . . . . . . . . . . . . . . . . . . . . . . . . . . . . .
9.1.1 Selecting a Scale for Moisture-Density Reports . . . . . .
9.1.2 Printing Your Reports . . . . . . . . . . . . . . . . . . . .
9.1.3 Selecting a Chart Report Format . . . . . . . . . . . . . .
9.2 Data Summary Reports . . . . . . . . . . . . . . . . . . . . . . .
9.3 Exporting Reports To Files . . . . . . . . . . . . . . . . . . . . .
9.4 Exporting XML Files . . . . . . . . . . . . . . . . . . . . . . . .
9.5 Listing the Results From Multiple Tests . . . . . . . . . . . . . .
9.5.1 Grain Size Test Results Calculated by the Program . . . .
9.5.2 Atterberg Limits Test Results Calculated by the Program
9.5.3 Soil Classification Results Calculated by the Program . .
9.5.4 Moisture-Density Results Calculated by the Program . . .
9.6 Technical Documentation . . . . . . . . . . . . . . . . . . . . . .
Index
.
.
.
.
.
.
.
.
.
.
.
.
.
.
.
.
.
.
.
.
.
.
.
.
.
.
.
.
.
.
.
.
.
.
.
.
.
.
73
74
75
77
79
.
.
.
.
.
.
.
.
.
.
.
.
.
81
82
84
85
86
87
88
91
91
92
96
96
97
97
99
vi
CONTENTS
1. Introduction
LabSuite reduces and reports data from moisture-density (i.e., "Proctor" or "compaction" tests),
Atterberg limits and sieve and hydrometer grain-size distribution tests and classifies the soil based
upon USCS, AASHTO, Burmister, USDA and Australian Standard (AS) 1726 standards.
; The software’s moisture-density test calculations are compliant with ASTM D
698 and D 1557, AASHTO T 99 and T 180 and California Test method 216 (CT216). Oversize (rock) correction of test results can be performed according to
ASTM D 4718, AASHTO T 224 and CT-216.
; Sieve and hydrometer test calculations are compliant with ASTM D 422, D 1140,
C 136 and C 117 standards and AASHTO equivalents (AASHTO T 27 and T 11),
and Australian standards 1141.11, 1141.12 and 1289.3.6.1.
; Atterberg limits test calculations are compliant with ASTM D 4318, AASHTO T
89, and Australian Standards AS 1289.3.1.1, 1289.3.2.1 and 1289.3.3.1.
; Supported soil classification methods are: ASTM D 2487 (USCS), AASHTO M
145 (ASTM D 3282), USDA, Burmister and Australian Standard AS 1726.
1.1
Program Features
This section provides a list of some of LabSuite’s features that might go unnoticed without
closely reading the program’s manual.
• Test data can be printed in a variety of different formats, including one that includes all of
your raw test readings, which is handy for archiving your test data in paper form.
• Grain size data may be entered as either raw testing data or as final calculated test results
(i.e., sieve size and percent passing). The latter option allows you to chart pre-calculated
grain size tests without having access to the original testing data.
• Several different sieve testing methods (i.e., weighing each sieve and its retained material,
or weighing a cumulative pan) are supported.
• Sieves may be entered as numbered (e.g., #10), inch-sized (e.g., 1") and/or millimeter-sized
(e.g., 75mm.).
• Automatic determination of hydrometer temperature correction values from a single correction reading eliminates ASTM D 422 Section 7.2 multiple correction values requirement.
• Both 151H and 152H hydrometers are supported.
• Interactive curve shaping facility can be used to remove poor data points from the grain
size distribution curve.
1
2
Introduction
• Fineness modulus, percentage diameters (e.g., D10 , D30 and D60 ), coefficient of uniformity
(Cu ) and curvature (Cc ), and fractional components (e.g., the percentage of cobbles, gravel,
sand, silt and clay in the material tested) are calculated.
• Both the standard multi-point (up to 6 test points) liquid limit test and the ASTM D 4318
Method B (one-point) test are supported.
• Up to 4 plastic limit moistures may be entered.
• A second oven-dried liquid limit test may be entered if an organics check is necessary:
ASTM D 2487, otherwise known as the USCS classification method, requires a second
liquid limit test after oven-drying if the sample is suspected to contain significant amounts
of organics.
• Calculated liquid and plastic limits results are also automatically used to classify the soil
using ASTM, AASHTO, USDA, Burmister and Australian Standard (AS 1726) methods.
• Atterberg limits calculations include support for one-point liquid limit tests and calculation
of plasticity and liquidity indices.
• Optional automatic averaging of two moisture content tests per compaction point.
• Compaction test specification editor supports adding new, modified or updated compaction
test specifications to the program’s list of supported test types.
• Automatic adjustment of compaction test results to account for oversize material (i.e.,
"rock correction") via ASTM D 4718, AASHTO T 224 or CT-216.
• Limited support for creating a compaction curve from a single moisture-density test point.
• If the GEOSYSTEM Boring Log Drafting program is licensed, calculated results such as the
percent passing the #200 sieve, Atterberg limits and soil classification results are available
for inclusion on boring log reports.
1.1.1
New Features in Version 4
We’ve been collecting requests for new features since releasing our first DOS programs in
1984. The new program finally puts check marks next to many of the items on our most-wanted list:
Direct creation of .PDF files
.PDF files are great for e-mailing reports to your clients because your client receives an exact picture of the printed report. However, Adobe’s Acrobat program
(which is typically used to create these files) is expensive, difficult to use and
must be licensed for every computer that needs to create .PDF files. LabSuite’s
ability to directly create .PDF files of chart and summary reports means that you
won’t need to pay Adobe for a separate .PDF package.
Multiple sample splits
Older GEOSYSTEM grain size programs supported 1 split of the sample during
sieve testing; the new program supports an unlimited number of splits per test.
www.geosystemsoftware.com
LabSuite by GEOSYSTEM Software
LabSuite User’s Guide
3
Container weight database
LabSuite may be set up to keep a list of sample container IDs and weights. You
can use this feature avoid weighing:
• The container used for hygroscopic moisture content tests.
• The container used to weigh the sieve test sample.
• The pan used for cumulative weight retained sieve tests.
• Moisture content test sample containers.
New Particle Diameter Calculations
LabSuite adds reporting for D20 , D80 , D90 and D95 .
Support for U.S.D.A., Burmister, AASHTO, Australian Standard 1726 and
Wentworth classifications
Each soil classification system specifies different particle sizes for breaking down
material into component fractions; e.g., Burmister’s sand classification extends
from #10 to #200 while the USCS/ASTM sand size ranges from #4 to #200.
LabSuite allows you to specify which classification to use on a project-by-project
basis.
Specifications can include tolerances
Each sieve in a specification envelope can be provided with a tolerance; e.g.,
#200: 10%-15%, ±2%
Test results falling within the tolerance will not be flagged as failing.
New particle size chart types
You can now choose from semi-log, x^.45, Wentworth (Phi scale), log(size) vs.
probability and linear particle size distribution charts.
Selectable minimum and maximum diameters for the particle distribution chart
Choose a 9-inch to 42-inch scale for plotting riprap, or a .1mm. to 75mm. scale
for aggregates, etc.
Selectable particle size distribution chart scale labels
E.g., Percent Finer or Percent Passing; Grain Size in mms. or Particle Diameter, mm., etc.
Particle distribution charts can plot either percent retained or percent passing
You can also plot charts showing percent passing (i.e., percent finer) on the left
side and percent retained on the right.
Curves may be plotted in color
When printed on a color printer, LabSuite can draw each test’s curve in a different color.
Specification envelopes may be omitted from particle distribution charts
This is useful if your specification includes just a few points: the envelope will
not be shown on the chart, but the program will still report whether the calculated percentages pass the specification.
Copyright 2005-2009 GEOSYSTEM Software, Inc.
http://geosystemsoftware.com/support.htm
4
Introduction
New report form designed for filter media tests
The new GSFILTER report form omits all soil-specific information, such as the
classification, Atterberg limits, % gravel, sand, silt, clay, etc. GSFILTER also
supports specification ranges for Cu and D10 ; e.g., D10 should be between 10 and
20%.
Reports can include a disclaimer
Your reports can include a disclaimer such as This report contains test results
of a randomly selected sample and may not be indicative of the properties of
similar materials used or sampled from the same site. This report shall not
be altered or reproduced without the expressed written consent of the testing
laboratory.
Reports can include an area for reporting (or signing) by the test technician and
report reviewer
(I.e., "Tested by" and "Checked by".)
Fully automatic export of test reports
Whenever you enter a test or modify its data, LabSuite can automatically generate a .PDF version of the test report in a directory of your choosing. You can use
this feature to maintain an archival copy of a project’s reports (it’s always better
to store your data in as many formats as is possible if you want to be able to review your results many years down the road), or (if your webserver’s directories
are available on your local network) make your reports web-accessible.
Testing data may be exported to XML files
Microsoft Excel XP can directly read these files, so your clients who want to
do their own data processing with a spreadsheet can import your testing data
directly into Excel.
Selectable margins for all printouts
This feature can be used to make space at the top of the page for printing your
reports on letterhead.
Reports can be copied to the Windows clipboard
From the clipboard, you can paste your test reports directly into Word documents.
User-Specified Sieve Opening Sizes
If you certify your sieves’ opening sizes with a statistical measurement process
you can now use each sieve’s measured opening size instead of the standard
opening size. For example, LabSuite normally uses an opening size of 2 mm.
for a #10 sieve: if your sieve’s openings averages 1.994 mm. with an optical
measurement device, you can report the diameter of particles passing that sieve
as 1.994 mm. instead of 2 mm.
Natural Moisture and Liquidity Index Calculations
The software can calculate a soil’s liquidity index based upon the soil’s natural
moisture content and liquid and plastic limits.
www.geosystemsoftware.com
LabSuite by GEOSYSTEM Software
LabSuite User’s Guide
5
Maximum Density/Optimum Moisture Point Shown Directly on Proctor Charts
Moisture-density curves can now optionally denote the point of maximum density and optimum moisture directly on the chart as required by, e.g., ASTM D
698 §12.1.11.
Current Compaction Test Support
LabSuite adds support for ASTM D 698-07, D 1557-02 and AASHTO T 224-01.
Data-averaging Compaction Curve Plotting Option
As an option, compaction curves can be drawn using a "data-averaging" mathematical model: These curves average the distance between the curve and each
test point, which can be used to smooth out compaction test errors.
Selective Omitting of Test Points from the Compaction Curve
Bad compaction test points can be dropped from the compaction curve while still
including the test data on summary reports for documentation purposes.
New Combined Grain Size and Moisture-Density Report Form
The program includes a new report form that combines moisture-density and
grain size test data onto a single report page.
Per-Test Specification Results Rounding
Different moisture-density test specifications feature different calculated results
rounding requirements (e.g., ASTM D 698 requires reporting the maximum dry
density to 0.1 pcf, while ASTM D 1557 requires rounding to 0.5 pcf); LabSuite
now allows you to select the rounding criteria for maximum density and optimum moisture results on a per-test specification basis.
When a tested sample is taken from a borehole, the sample descriptions may now
be different than the boring log soil layer description.
Many times, at the depth where a sample was taken the material description
entered into the boring log may be something like Same as above. With older
GEOSYSTEM programs, you’d see Same as above in the Material Description
block of your test report, so you’d need to go back to the boring log data entry
screen, change Same as above to whatever the material layer’s description
was, print the lab. test report, then change the description back to Same as
Copyright 2005-2009 GEOSYSTEM Software, Inc.
http://geosystemsoftware.com/support.htm
6
Introduction
above. The new program allows you to pick the sample’s description from a list
of material descriptions entered for the borehole, without changing the sample’s
description in the boring log (e.g., the lab. test reports could print Silty, sandy
clay as the material description, while the boring log continues to show Same
as above).
1.2
Tutorial
If you’re just starting out with the software, consider taking the program’s thirty minute
tutorial:
1. Start the GEOSYSTEM for Windows package: If you have a "GEOSYSTEM" shortcut on
your desktop, double-click on it; if you don’t have the shortcut, click on your "Start" button and select Programs > GEOSYSTEM > GEOSYSTEM for Windows.
2. On the left side of the program’s screen is a directory box: navigate to the directory where
your GEOSYSTEM programs are installed. (If you’ve installed the software onto your own
hard disk, this will probably be C:\PROGRAM FILES\GEOSYS.)
3. In the program folder you will find a file called DEMO: double-click on it.
4. The software should display the contents of the DEMO project. On the left side of the
screen is a yellow box listing the material sources from which the DEMO project’s testing
samples were taken: click on either Boring B-4 or B-4.
5. On the right side of the screen you should see a list of samples taken from Boring B-4: find
the data entry card for sample S-4 and click on the underlined GrainSize at the bottom
of that card.
6. Select Help > Tutorial, and the program will begin displaying a series of yellow tutorial
cards at the bottom of the data entry window.
1.3
Contacting Technical Support
If you have any questions on installing or operating our software, please feel free to contact
GEOSYSTEM technical support. We do not charge for support, though we can only help with software that we are currently selling (we cannot answer questions about older versions our programs).
You can contact us through our support page at http://www.geosystemsoftware.com/support.htm.
; If you think that the program’s calculated results "don’t look quite right", please
give us something more to work with: do the calculations by hand and fax your
calculations to +1 970/223-8788 prior to submitting a support question.
www.geosystemsoftware.com
LabSuite by GEOSYSTEM Software
2. Configuration
LabSuite features a number of configurable options for data entry, test results calculation
and report generation. Before typing in your first test set you should make sure that the package
is correctly configured for your specific testing and reporting standards. To do this, select Options
> Program Setup.
; Note that these settings affect every test entered into the current project file.
2.1
Data Entry Options
Figure 2.1: Data Entry Settings
Selecting Options > Program Setup then clicking on Data Entry in the navigation list at the
dialog’s left side provides you with the following options:
Prompt text color
Sets the color of all data entry prompts. Click Set to select a color or Reset to
restore the program’s default color.
Navigation tab placement
Navigation tabs allow you to change from one window to another (for example,
between the test data entry windows and the report preview window). The tabs
look like this:
Navigation tabs may be placed at either the top or the bottom of the screen by selecting one of the
Navigation tab placement options.
7
8
Configuration
Container weights are entered as
LabSuite can be set up to keep a list of container IDs and associated weights –
when entering moisture content data, instead of entering the container weight
you can enter the container ID and the program will look up the associated
weight. To do this, select Tare ID in this box then enter your list of container
IDs and weights into the program’s container database (Options > Container
List).
2.2
Reporting Options
The following subsections cover settings that affect the program’s printed reports.
2.2.1
Printout Margins
Figure 2.2: Setting the Report Margins
The Margins selection on the Setup dialog (Options > Program Setup then click on Margins
in the navigation list at the dialog’s left side) allows you to select the whitespace used at the top,
bottom, left and right sides of chart and summary reports.
; The measurement units (inches or cms.) used for specifying margins are determined by the Regional settings in the Windows Control Panel.
www.geosystemsoftware.com
LabSuite by GEOSYSTEM Software
LabSuite User’s Guide
2.2.2
9
General Chart Report Options
Figure 2.3: General Chart Report Settings
The basic appearance of all chart reports generated by LabSuite may be customized by selecting Options > Program Setup and then clicking on General Settings underneath Chart Reports in
the navigation list at the dialog’s left side.
; Additional settings that cover grain size distribution chart reports may be found
in § 2.3.3.
; Additional settings that cover Atterberg limits chart reports may be found in
§ 2.4.2.
; Additional settings that cover the chart reports created for USDA soil classifications may be found in § 2.5.1.
; Additional settings that control the appearance of moisture-density reports may
be found in § 2.6.1.
Printed reports use color curves
If selected, curves plotted on chart reports are shown in a program-selected color.
; Note: the first curve printed on a chart is always black, so the checkbox has
no effect unless the chart includes more than one curve.
PDF reports use color curves
Determines whether chart reports exported as .PDF files show curves in programselected colors.
Include a disclaimer
If selected, a disclaimer is printed down the left margin of chart reports. The
disclaimer is listed in the Disclaimer field directly below the checkbox, and may
be modified after checking the Include a disclaimer box.
Copyright 2005-2009 GEOSYSTEM Software, Inc.
http://geosystemsoftware.com/support.htm
10
Configuration
; The figure shown on page 36 includes a sample of how the disclaimer is
printed on a chart report.
Drop "Tested by" from reports if a name is not entered
The Sample Info. window includes a data entry field titled Tested by. This
field, along with the Drop "Tested by" from reports if a name is not entered
checkbox on the program’s setup dialog affects the appearance of chart reports:
• If you do not fill in the Tested by data entry field and Drop "Tested by" from
reports if a name is not entered is not checked, "Tested by" will appear
below chart report’s bottom margin, along with an area for a signature.
• If you do not fill in the Tested by data entry field and Drop "Tested by" from
reports if a name is not entered is checked, "Tested by" will NOT appear
below chart report’s bottom margin.
• If the Tested by data entry field is filled in: "Tested by" will appear below
chart report’s bottom margin, followed by the name entered into the Tested
by data entry field.
Drop "Checked by" from reports if a name is not entered
Is similar to Drop tested by... discussed above. Leaving this box unchecked
and leaving the Checked by data entry field blank provides an area below chart
reports’ bottom border for the report’s reviewer to sign the page.
Preferred classification system
Several moisture-density report formats include room for only a single soil classification; for these forms, the Preferred classification system box selects
which classification will be included on the report.
2.2.3
Automatically Exporting Reports
LabSuite can automatically export versions of its test reports into a selected hard disk subdirectory. This feature can be used to maintain an archival copy of a project’s reports (which is useful
because it’s always better to store your data in as many formats as is possible if you want to be able
to review your results many years down the road), or, if your webserver’s directories are available
from your local network, you can make your test reports web-accessible by configuring LabSuite to
automatically store copies of each test report in a webserver directory.
; If your webserver is not accessible from your local network, you can use the
GEOSYSTEM Bindery program to export your grain size test reports to the web
and notify your clients via e-mail that new reports are available for review. The
program can also fax and e-mail your reports directly to clients.
For more information, please see www.geosystemsoftware.com/bindery.
If you select Options > Program Setup then click on Automatic Report Export in the lefthand navigation panel, you’ll be presented with the following dialog and options:
www.geosystemsoftware.com
LabSuite by GEOSYSTEM Software
LabSuite User’s Guide
11
Figure 2.4: Automatic Report Export Dialog
Chart report (Adobe .PDF format)
If this option is checked, LabSuite will automatically export the test’s chart report in a format readable by Adobe Acrobat Reader.
Summary report (Adobe .PDF format)
If this option is selected, LabSuite automatically exports the test’s summary
report into an Adobe Acrobat .PDF file.
Raw data (XML format)
If this option is selected, LabSuite exports an XML file listing the test’s data and
calculated results.
Path to exported files
This is the file path to where you want to store your exported files. If the path
does not exist, the program will offer to create it for you when you click on the
dialog’s OK button.
Reset Path to Default
This sets the Path to exported files to be a directory called "Bindery" stored
inside your project’s data file folder, which is useful if you want to export your
reports as an archival copy of your data.
Create .PDF pages in A4 page size
If this box is not checked, LabSuite will export your reports as letter-sized (8.5" x
11.0") pages; if the box is checked, the .PDF reports will be created as A4-sized
(210mm. x 297mm.) pages.
; LabSuite starts the test report exporting process when you select Save and Exit
or when you click on the program’s close button. This may delay the program for
a few seconds while exiting.
Copyright 2005-2009 GEOSYSTEM Software, Inc.
http://geosystemsoftware.com/support.htm
12
Configuration
; LabSuite does not have a soil classifications summary report. It does have a chart
report featuring the USDA textural triangle, but because this report is not a necessity for most organizations, it’s not enabled by default (even if the Chart report
(Adobe .PDF format) option is selected). Click on USDA Chart Reports underneath Soil Classifications in the left-hand navigation panel to enable USDA
chart report exporting.
2.3
Grain Size Distribution Configuration
The following sections cover configuration options that affect the entry and reporting of grain
size distribution test data.
2.3.1
Grain Size Chart Scales
Figure 2.5: Chart Scale Settings
Selecting Options > Program Setup and clicking on Scales underneath Grain Size Chart
in the navigation list at the dialog’s left side allows you to modify the scales shown on the sides of
grain size distribution charts:
Minimum diameter
Maximum diameter
These fields select the extent of the particle diameter scale on the grain size
distribution chart. Values may be specified in either inches or millimeters; use
the units selection box just to the right of the minimum and maximum diameter
fields to specify the units that you’re using.
You do not need to use the same units for the maximum diameter and minimum
diameter values; for example, most soil sample chart scales extend from 6" to
0.001mms., so the minimum diameter would be 0.001 with the units selection
being set to mms.; the maximum diameter would be specified as 6 with the maximum diameter units selection set to inches.
www.geosystemsoftware.com
LabSuite by GEOSYSTEM Software
LabSuite User’s Guide
13
Scale captions
Use the Left, Right and Bottom scale captions fields to change the captions
printed next the scales printed on a grain size distribution chart. Note that the
Right scale caption is not printed unless the Percent retained scale option is
set to Left is percent finer, right is percent retained.
Percent retained scale
This selection offers the following options for the grain size distribution chart:
• Chart does not include a percent retained scale: The left-hand chart scale
is of percent finer and no scale is shown on the chart right side
• Percent retained on chart left side: The left-hand chart scale is of percent
retained, while no scale is shown on the right side of the chart
• Left is finer, right is percent retained: The chart includes a percent finer
scale on the left side and a percent retained scale on the right side
; Note that this option has no effect on log(size) vs. probability charts.
2.3.2
Grain Size Charting Options
Figure 2.6: Charting Options
If you select Options > Program Setup then click on Charting Options underneath Grain
Size Chart in the navigation list at the dialog’s left side you can change several options that affect
how grain size distribution charts are drawn:
Copyright 2005-2009 GEOSYSTEM Software, Inc.
http://geosystemsoftware.com/support.htm
14
Configuration
Chart style
LabSuite supports five types of grain size distribution charts:
• Semi-log: Plots percent retained or passing vs. log10 (grain diameter). This is
the customary chart used for reporting soil grain size distribution test results.
• Log(size) vs. probability: Plots log10 (grain diameter) vs. probability (i.e., the
standard normal distribution). Log(size) vs. probability charts are normally
used for plotting filter media test results.
• Linear: Plots percent retained or passing vs. grain diameter. This chart style
is sometimes used when plotting filter media test results.
• Diameter^0.45: Plots percent retained or passing vs. grain diameter raised to
the 0.45 power. Typically used for plotting pavement aggregate size distributions.
• Phi (Wentworth): Plots percent passing or retained vs. -log2 (grain size diameter). Wentworth-classified materials are typically plotted using this chart
style.
Curve width
Determines the width of the grain size distribution curve.
Do not plot curves for tests with two points
If selected, tests performed with only two sieves (or tests performed with a single sieve and a #200 wash) are plotted using only graph markers (e.g., circles,
triangles, squares, etc.) without a line connecting the markers. Avoids having a
straight line connect the two test points.
Connect test points with lines instead of curves
If selected, connects points on the grain size distribution chart with straight lines
instead of spline curves.
Minimum number of specification points to plot
When given a material specification with a small number of control points such
as:
#40 sieve: 80%-100% finer
#200 sieve: 0%-5% finer
it isn’t usually desirable to plot the resulting specification envelope on the grain
size distribution chart because the small number of control points do not make
for a usable "envelope". Use the Minimum number... box to select the minimum
number of control points that LabSuite will use to plot specification envelopes.
Specification sets with less control points will still be used to show whether the
test is in or out of spec.; they just won’t be shown graphically on the grain size
distribution chart.
www.geosystemsoftware.com
LabSuite by GEOSYSTEM Software
LabSuite User’s Guide
2.3.3
15
Grain Size Chart Reports
Figure 2.7: Chart Report Settings
Particle size distribution chart reports may be customized by selecting Options > Program
Setup and then clicking on Chart Reports underneath Grain Size in the navigation list at the dialog’s
left side:
Report title
The chart report title is a single line of text shown at the top of the report.
Typically the title reads Particle Size Distribution Report or Grain
Size Distribution Report - ASTM D 422.
Label sample description as
Chart reports usually include an area for reporting a description of the sample (e.g., Brown sandy clay) with a title such as Soil Description. If
the material being tested is aggregate, the sample description may be labeled
Type of Aggregate (or alternatively, a more generic title such as Material
Description) by entering the new label into the Label sample description
as field.
Print fineness modulus with testing remarks
This option appends the calculated fineness modulus (see ASTM C 136 or AASHTO
T 27) to the end of the testing remarks on test reports. Note that the user is responsible for selecting a sieve nest that corresponds to AASHTO’s specification
– LabSuite adds the total percentage of material retained on any of the following
sieves: 6", 3" 1.5", 3/4", 3/8", #4, #8, #16, #30, #50 and #100 and divides the
sum by 100. If sieves are missing from the list, the resulting fineness modulus
will not be compliant with C 136.
Copyright 2005-2009 GEOSYSTEM Software, Inc.
http://geosystemsoftware.com/support.htm
16
Configuration
2.3.4
Grain Size Test Calculation Options
Figure 2.8: Calculated Values Settings
The Calculated Values selection on the Settings dialog (Options > Program Setup then click
on Calculated Values underneath Grain Size Distribution in the navigation list at the dialog’s left
side) includes several options that affect how grain size distribution calculated results are reported:
Material larger than gravel is
When reporting the percent of material larger than gravel, the program can label
the percentage as either +3", +75mm, or Cobbles. (The difference is purely
semantical and does not result in any change in calculated results.)
Minimum reported diameter sizes (in mm.): D60
Specifies the smallest calculated diameter that will be reported for D60 . If the
diameter calculated as D60 is smaller than the specified minimum reported diameter size, the software will not report a D60 value.
Minimum reported diameter sizes (in mm.): D80+
Specifies the smallest calculated diameter that will be reported for D80 , D85 , D90
and D95 . If the calculated diameter is smaller than the specified minimum reported diameter size, the value will not be reported.
Percentages: Report to
Determines the number of decimals to which percent finer/percent coarser (i.e.,
percent passing/percent retained) values will be reported.
Report #200 and smaller to 1 decimal if less than 10%
ASTM C 136 and AASHTO T 27 specifies that material percentages are to be
reported to the nearest whole number, with the exception that if the percentage passing the #200 sieve is less than 10% it should be reported to the nearest
0.1%. If the Report #200 to 1 decimal place if less than 10% option is
selected, the program reports the #200 percentage, and smaller sieves and all hydrometer results, to 1 decimal place if the percentage is less than 10. This option
is unavailable if all percentages are reported to 1 place (see above).
www.geosystemsoftware.com
LabSuite by GEOSYSTEM Software
LabSuite User’s Guide
2.3.5
17
Sieve Opening Size Measurements
Figure 2.9: Specifying Sieve Opening Sizes
If you certify your sieves’ opening sizes with a statistical measurement process you can use
each sieve’s statistically measured opening size instead of the program’s default opening sizes. For
example, LabSuite normally uses an opening size of 2 mm. for a #10 sieve: if your sieve’s openings averages 1.994 mm. with an optical measurement device, you’ll want to report the diameter of
particles passing that sieve as 1.994 mm. instead of 2 mm.
To use the as-measured opening sizes for the sieves used for a particular sieve test, you’ll need
to enter that test’s list of sieves into LabSuite’s Sieve Opening Sizes database:
1. Select Options > Program Setup then click on Sieve Opening Sizes in the left-hand
navigation panel.
2. If you’ve already entered a similar opening sizes list, you can drop down the Lists box,
select your opening sizes list from the box and click on the Copy button.
Alternatively, if you do not already have a similar opening sizes list:
Click on the New button in the Size List box on the right side of the dialog.
3. Next, at the Name prompt, enter a unique name for your opening sizes list (i.e., not used
for one of the opening sizes lists already stored in the program’s database).
4. After you’ve entered your list name, pressing Enter brings you to the opening sizes grid:
For each sieve you’ve measured, enter the sieve’s designated size (e.g., #4 or 1.5in. or
2mm.) into the Sieve column then enter the measured sieve size in the Size, mm. column.
The right-most column, labeled ID, can be used to enter a sieve tracking number or label.
LabSuite doesn’t use IDs: they’re included as a convenience so that you can correlate a
sieve to its measurement papers.
; You can list your sieves in any order (i.e., by increasing or decreasing opening
size).
Copyright 2005-2009 GEOSYSTEM Software, Inc.
http://geosystemsoftware.com/support.htm
18
Configuration
; Because an opening sizes list contains the measurements for a specific stack of
sieves, you’ll end up entering some sieves’ measurements in more than one opening sizes list as they’re used in different sieve stacks.
; For reference, LabSuite includes a list of its default opening sizes that you can
view by selecting (Default opening sizes) from the list selection box. This
list may not be edited.
2.3.6
Grain Size Specification Envelopes
Specification envelopes provide upper and lower percentage boundaries for various particle
sizes. For example, your client may specify that a given delivered material consist 100% of particles
smaller than 3/8", and contain a total of 10% to 20% particles smaller than the #200 sieve.
LabSuite uses specification envelopes to flag (during data entry and on printed reports) tests
that do not pass your or your client’s requirements. For example, some chart reports such as GSPASS
include a table listing the percent finer for each sieve size, along with the specification (if any) for that
opening size and whether the test passes the specification.
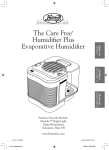
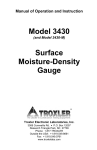
Specification envelopes can be shown visually on particle distribution charts, as you can see
in the following sample:
Figure 2.10: Grain Size Distribution Chart with Specification Envelope
; You can stop the program from drawing the gray specification envelope on the
chart report using the Minimum number of specification points to plot selection in the Charting Options page of the program’s Settings dialog.
; Specification envelopes are always optional; you don’t have to provide a material
specification in order to enter a grain size test.
www.geosystemsoftware.com
LabSuite by GEOSYSTEM Software
LabSuite User’s Guide
19
LabSuite is shipped with a database of standard specification envelopes taken from ASTM,
AASHTO, Superpave and ISSA (International Slurry Surfacing Association) standards. You can also
add your own envelopes to the database:
Figure 2.11: Specification Envelopes Dialog
1. Select Options > Program Setup, then click on Specification Envelopes in the left-hand
navigation panel.
2. Click on the New button in the Envelope box on the right side of the dialog.
3. At the Name prompt, enter a unique name for your envelope (i.e., not used for one of the
specification envelopes already stored in the program’s database).
4. After you’ve entered your envelope name, pressing Enter brings you to the specifications
grid. For each sieve in your specification, enter the sieve’s opening size and the specification’s lower and upper boundaries.
; Opening sizes should be entered as follows: use a "#" sign for numbered sieves
(e.g., #40); measured sieve openings should normally be entered in dimension
units appropriate for the project file on which you’re working (i.e., if you’ve configured the project to use SI units, enter your sieve opening sizes in millimeters;
for a US unit project, enter your sieve opening sizes in inches). If you need to
enter a millimeter size into an envelope used for a US unit project, add MM. to
the end of the measurement (e.g., 2MM.).
; Lower and upper limits should be entered as percentages (e.g., 30 is 30 percent).
; You can also enter a tolerance for each opening size so that any tested sieve falling
outside the specification’s lower and upper limit boundaries by less than the specified tolerance will be considered by the program to be passing the specification.
Alternatively, you can leave the Tolerance column empty for any of the sieves in
your envelope and the program will consider the tolerance to be 0%.
; Material specifications are normally given in terms of a lower and upper limit
(e.g., the material should have between 10% and 40% finer than the #40 sieve); however, an alternative specification is given in terms of: X% of the material should
Copyright 2005-2009 GEOSYSTEM Software, Inc.
http://geosystemsoftware.com/support.htm
20
Configuration
be larger than the Y sieve size (e.g., 50% of the material is to be larger than the #200
sieve). To enter a specification such as this, enter the required percentage as the
specification’s lower limit and enter 100 as the specification’s upper limit.
; If you’re given a specification such as: X% of the material should be smaller than
the Y sieve size, enter X-.01 as your upper limit (e.g., if your specification says
50% of the material should be smaller than the #200 sieve, enter 49.99 as your
upper limit), and enter 0 as your lower limit. There is one exception to this
rule: if the largest sieves in your specification require 100% smaller (e.g., 100% of
the material must be smaller than the 3" sieve), enter 100 as both the lower and
upper limits for the sieve.
2.3.7
Sieve Nests
LabSuite can be configured to save a list of the sieves used in a particular sieve nest. When
you start a new test, the program can automatically fill in the test’s sieve sizes from the list of sieves
in your saved sieve nest. The program’s Sieve Nest editor allows you to enter and delete these lists.
Figure 2.12: Sieve Nest Dialog
To create a list of sieves:
1. Select Options > Program Setup then click on Sieve Nests in the left-hand navigation
panel.
2. Click on the New button in the Sieve Nest box on the right side of the dialog.
3. At the Name prompt, enter a unique name for your list (i.e., not used for one of the sieve
nests already stored in the program’s database). Names may be anything that describes
the set of sieves that you’ll be entering: as an example, here are a couple of the predefined
sieve nests shipped with the program:
ASTM D422 Uniform-Spacing Set
ASTM D422 Recommended Sieve Set #1
www.geosystemsoftware.com
LabSuite by GEOSYSTEM Software
LabSuite User’s Guide
21
4. After you’ve entered your sieve nest name, pressing Enter brings you to the sieve sizes
grid. Enter the size of each sieve in your sieve nest, in order of decreasing opening size
(e.g., 3", 2" 1.5", etc.).
; Enter sieve sizes as follows: use a "#" sign for numbered sieves (e.g., #40);
measured sieve openings should normally be entered in dimension units appropriate for the project file on which you’re working (i.e., if you’ve configured
the project to use SI units, enter your sieve opening sizes in millimeters; for a
US unit project, enter your sieve opening sizes in inches). If you need to enter
a millimeter size into an envelope used for a US unit project, add MM. to the
end of the measurement (e.g., 2MM.).
§ 3.2.7 provides instructions on using your sieve nest as a starting point for entering a new
sieve test.
2.4
Atterberg Limits Configuration
The following sections cover configuration options that affect the entry and reporting of
Atterberg limits test data.
2.4.1
Plasticity and Blows vs. Moisture Chart Settings
Figure 2.13: Limits Chart Settings
Selecting Options > Program Setup and clicking on Charts underneath Atterberg Limits in
the navigation list at the dialog’s left side allows you to modify the appearance of the Atterberg blows
vs. moisture and plasticity charts:
Copyright 2005-2009 GEOSYSTEM Software, Inc.
http://geosystemsoftware.com/support.htm
22
Configuration
Plasticity chart style
The ASTM D 2487 (USCS), AASHTO M 145 and AS 1726 soil classification
standards incorporate a chart of liquid limit vs. plasticity index; the format of
this chart is unique to each standard. Plasticity chart style selects which type
of plasticity chart will be shown on Atterberg limits chart reports. After selecting
the plasticity chart type, make sure to select the option to show the plasticity
chart on reports instead of the blows vs. moisture chart.
Blows scale maximum value
This determines the value at the right side of the blows scale, and is typically 40.
Regardless of your choice, the program will automatically expand this scale if
you pick a number that is too small to plot a particular test’s liquid limits values.
Select the moisture scale minimum and maximum values
Checking this box allows you to manually select the minumum and maximum
moisture content scale values on the blows vs. moisture chart. If this box is
unchecked, the program will select the scale for you.
2.4.2
Atterberg Limits Chart Reports
Figure 2.14: Limits Chart Report Settings
Selecting Options > Program Setup and clicking on Chart Reports underneath Atterberg
Limits in the navigation list at the dialog’s left side allows you to modify the appearance of the Atterberg limits chart reports:
Report title
The chart report title is a single line of text shown at the top of the Atterberg limits chart report. Typically the title reads Atterberg Limits Test Report
or Atterberg Limits Test Results - ASTM D 4318.
Chart to include on the report
Atterberg limits chart reports include a space for a chart plotting either blows vs.
moisture or plasticity (liquid limit vs. plasticity index).
www.geosystemsoftware.com
LabSuite by GEOSYSTEM Software
LabSuite User’s Guide
2.4.3
23
Atterberg Limits Calculation Options
Figure 2.15: Limits Calculated Values Settings
The Calculated Values selection on the Settings dialog (Options > Program Setup then
click on Calculated Values underneath Atterberg Limits in the navigation list at the dialog’s left
side) includes several options that affect how Atterberg limits results are reported:
Round Atterberg limits to
Determines the number of digits to the right of the decimal that will be printed
when reporting the liquid and plastic limit, plasticity index and liquidity index. (Note that ASTM D 4318, AASHTO T 89, and Australian Standards AS
1289.3.x.1 all specify that Atterberg limits values are to be rounded to the nearest
whole number.)
When plastic limit>=liquid limit, report plasticity index as
ASTM D 4318 and AS 1289.3.3.1 disagree on how the plasticity index is to
be reported if the sample’s plastic limit is larger than its liquid limit: ASTM
indicates that the soil should be reported as NP (see Section 18.1.1), while the
Australian Standard indicates that the plastic limit is to be reported as 0 (see
Section 5, note c). The When plastic limit>=liquid limit, report plasticity
index as selection allows you to choose between the two reporting options.
Copyright 2005-2009 GEOSYSTEM Software, Inc.
http://geosystemsoftware.com/support.htm
24
Configuration
2.5
Soil Classifications Configuration
LabSuite features a minimal amount of configuration options for soil classification results,
as covered in the next section.
2.5.1
USDA Chart Report Settings
Figure 2.16: USDA Chart Report Settings
LabSuite can produce chart reports featuring the USDA textural triangle. The software offers
a single feature for customizing the report: The chart report title, which is a single line of text shown
at the top of the report, can be changed by selecting Options > Program Setup and then clicking on
USDA Chart Reports underneath Soil Classifcations in the navigation list at the dialog’s left side.
; Typically the title reads USDA Soil Classification or Soil Classification
Report.)
LabSuite can be set up to automatically export a .PDF version of the USDA chart report
whenever the sample’s classification changes (i.e., because you’ve changed the sample’s grain size
distribution or Atterberg limits data). To do this:
1. Begin by turning on the program’s automatic chart report exporting option: Select Options
> Program Setup then click on Automatic Report Export in the left-side navigation list,
and make sure that the Chart report (Adobe .PDF format) option is selected.
2. Next, turn on the option to export USDA chart reports (the automatic USDA chart report
export is a separate option because most users do not need these reports): Click on USDA
Chart Reports underneath Soil Classifcations in the navigation panel, then make sure
that the Automatically export USDA chart reports as .PDF files box is checked.
www.geosystemsoftware.com
LabSuite by GEOSYSTEM Software
LabSuite User’s Guide
2.6
25
Moisture-Density Test Configuration
The following section covers configuration options that affects the reporting of moisturedensity test data.
2.6.1
Moisture-Density Report Settings
Figure 2.17: Moisture-Density Report Settings
Selecting Options > Program Setup and clicking on Chart Reports underneath MoistureDensity in the navigation list at the dialog’s left side allows you to modify the appearance of reports
produced for moisture-density tests:
Report title
The chart report title is a single line of text shown at the top of the moisturedensity chart report. Typically the title reads, e.g., Compaction Test Report
or Moisture-Density Test Results.
Curve width
Determines the width of the moisture-density curve when drawn on a moisturedensity chart report.
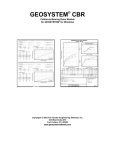
Draw extrapolated one-point curves on chart reports
Draw one-point test match curves on chart reports
LabSuite supports a simplified version of the AASHTO T 272 one-point test
matching procedure that extrapolates a one-point test’s compaction curve from
a pair of existing tests’ compaction curves. For one-point tests that have an
extrapolated compaction curve, LabSuite can be configured to plot the extrapolated compaction curve (by checking the Draw extrapolated one-point curves
on chart reports box) and/or the pair of existing tests’ compaction curves (by
checking the Draw one-point test match curves on chart reports box).
Copyright 2005-2009 GEOSYSTEM Software, Inc.
http://geosystemsoftware.com/support.htm
26
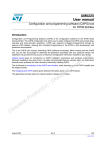
Configuration
Figure 2.18: Synthesized One-Point Test Curve and Match Curves
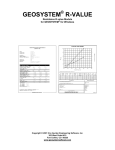
Denote point of max. dens./opt. moist. on charts
Selecting this option adds a small call-out box to the moisture-density chart
pointing to the point of maximum density/optimum moisture. The selection
is required by many test standards (e.g., ASTM D 698).
Figure 2.19: Moisture-Density Chart with Call-Out Box
www.geosystemsoftware.com
LabSuite by GEOSYSTEM Software
LabSuite User’s Guide
2.6.2
27
Moisture-Density Calculation Options
Figure 2.20: Moisture-Density Calculated Values Settings
The Calculated Values selection on the Settings dialog (Options > Program Setup then
click on Calculated Values underneath Moisture-Density in the navigation list at the dialog’s left
side) includes several options that affect how moisture-density test results are reported:
Density units
This selection changes the units to be used to report calculated densities, regardless of the units used to enter the compaction test data.
Round max. density to
This selection box controls the program’s rounding of calculated maximum density values. Note that the list of available rounding options changes depending
upon which density units have been selected.
Round opt. moisture to
This selection box controls the program’s rounding of calculated optimum moisture content percentages.
; Using the Test Specification editor (see § 2.6.3) you can override the rounding selection on a per-test specification basis: This can be useful for setting
the test results rounding selection for particular moisture-density test specifications that mandate a specific rounding procedure for test results. If your
Round max. density to and Round opt. moisture to selections are not reflected in your reported test results, use the Test Specification editor to check
to see if your test specification overrides the default rounding settings.
Test specifications
Clicking on the Edit button brings up the Moisture-Density test specification
editor, covered in § 2.6.3
Copyright 2005-2009 GEOSYSTEM Software, Inc.
http://geosystemsoftware.com/support.htm
28
Configuration
2.6.3
Moisture-Density Test Specifications
Figure 2.21: Test Specification Editor
LabSuite incorporates a list of different moisture-density test specifications, which consists
of:
• The physical requirements of the test, such as the dimensions of the mold, the number of
soil layers and blows per layer and the hammer weight and drop.
• Oversize correction requirements such as the size of sieve used to separate out oversize
material and the oversize moisture and density correction method.
• Unique reporting requirements, such as whether to report the non-oversize corrected test
results as well as the corrected test results.
Each moisture-density test entered into the system must be associated with a test specification
from this list.
To edit the program’s test specification database, select Options > Program Setup then click
on Calculated Values underneath Moisture-Density in the navigation list at the dialog’s left side,
then click on the Edit button.
To edit a test specification:
Test specifications currently stored in the database are listed on the left-hand
side of the panel: To view or edit a specification in the list, simply click on the
specification’s name.
To create a new test specification:
You can add a new test specification by clicking on the New button, or you can
start with an existing test specification and save it under a new name by clicking
on the test specification in the left-hand list, then click on the Copy button.
To remove a test specification from the database:
Click on the test specification’s name in the specification list then click on the
Delete button.
A moisture-density test specification includes the following information:
www.geosystemsoftware.com
LabSuite by GEOSYSTEM Software
LabSuite User’s Guide
29
Specification name
Each specification must be associated with a unique name that describes the test
method. A typical specification name would be ASTM D 698-91, Method A.
Standard/modified/other
Two test specifications may share the same name if different values are entered
into the Standard/modified/other field for the two specifications: for example, there may be two ASTM D 698-91, Method A test specifications - one
Standard, the other Modified.
Oversize material is larger than
For test procedures that require an oversize material correction, this selection
specifies the sieve opening size that denotes the oversize material boundary.
Test method
Select Proctor test for a normal moisture-density test not involving the California Test Method 216 (CT-216) procedure.
For CT-216 tests, LabSuite supports two test methods: a modified CT-216 test
procedure where moisture contents are taken at each test point (this method
is labeled as CT-216 with added moisture content tests in the test
method selection box), and a by-the-book CT 216 procedure without moisture
contents (labeled California Test 216 in the selection box).
This specification requires a unique rounding selection
The software has maximum dry density and optimum moisture content rounding settings (Round max. density to and Round opt. moisture to, covered
in § 2.6.2) that affect almost every test specification; however, you can choose
to override these settings for individual test specifications. This can be useful
for setting the test results rounding selection for particular moisture-density test
specifications that mandate a specific rounding procedure for test results (e.g.,
ASTM D 698 requires reporting the maximum dry density to 0.1 pcf, while
ASTM D 1557 requires rounding to 0.5 pcf).
If you would like to require a particular rounding procedure for a given test
specification, check the This specification requires a unique rounding selection box, then select the proper rounding option in the Max. density and
Opt. moist. boxes.
Max. density
These options control the rounding of the maximum density and optimum moisture content results calculated by the program for a test using the current test
specification. The selection boxes are only available if the This specification requires a unique rounding selection box is checked; otherwise, the program
rounds the results for tests using the test specification according to the rounding
settings chosen in § 2.6.2.
Copyright 2005-2009 GEOSYSTEM Software, Inc.
http://geosystemsoftware.com/support.htm
30
Configuration
Density correction
Selects the method by which density results from tests using the specification
are to be corrected for the presence of oversize material (i.e., rock). Select No
oversize density correction if you do not want to correct the calculated densities.
Moisture correction
Selects the method by which moisture content results from tests using the specification are to be corrected for the presence of oversize material. Select No
oversize moisture correction if you do not want to correct the calculated moisture contents.
; You can stop the program from correcting the moisture and density results for
any given test, even if the test’s specification requires corrections: Simply do not
enter a percentage for the oversize material, or a bulk specific gravity.
Correct
LabSuite can apply the density and moisture oversize corrections to each test
point or just to the calculated maximum dry density and optimum moisture content.
; The only real difference between the two options is that if the option to apply
the corrections to each test point is chosen, you can opt to have the program plot
both the corrected and uncorrected curves as part of the hardcopy reports; if the
option to apply the corrections only to the final results is chosen, the corrected
maximum density/optimum moisture content will be reported, but charts will
only include the uncorrected curve.
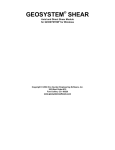
Report the uncorrected results in addition to the corrected results
When an oversize correction is applied, the program can be configured to report
uncorrected maximum dry density/optimum moisture values in addition to the
corrected test results. This selection affects both the data summary report and
the chart report. For example, the following figures demonstrate the effect of
selecting and unselecting this option on the PRGEOSYS chart report:
Figure 2.22: Chart Report Test Results Box Showing Corrected Results
Figure 2.23: Chart Report Test Results Box Showing Corrected and Uncorrected Results
Report the uncorrected curve in addition to the corrected curve
When this option is selected, LabSuite will plot two curves on moisture-density
charts: One curve will be plotted using the original, uncorrected, test results,
while the second curve will be plotted using the test’s density and moisture results after correcting for the presence of oversize material.
www.geosystemsoftware.com
LabSuite by GEOSYSTEM Software
LabSuite User’s Guide
31
; This option will not be available if you select Only the max. density and
opt. moisture in the Correct box because there is no corrected curve: The
uncorrected is plotted to calculate an uncorrected maximum density and optimum moisture content, then the oversize correction is applied to the results.
Mold diameter
Mold height
For non-CT-216 tests, LabSuite utilizes the mold diameter and height required
by the selected test specification to calculate a mold volume that is used during
data entry as a default for each compaction point’s Mold volume test data entry
field.
Hammer wt.
Hammer drop
Blows per layer
Number layers
These fields are optional. If data are entered for all four prompts, it will be
included as part of the test specification listed on chart reports.
; Because LabSuite does not automatically include measurement units as part
of the specification listing, make sure to add lb. or kg. to the hammer
weight and in. or cms. to the hammer drop.
Copyright 2005-2009 GEOSYSTEM Software, Inc.
http://geosystemsoftware.com/support.htm
32
Configuration
2.7
Saving Sets of Configuration Settings
Figure 2.24: Saving Configuration Settings
If you perform several different grain size test procedures, or test radically different types of
materials (such as riprap and filter media), you’ll find yourself constantly switching between different
grain size test settings. For example:
• Riprap may require the chart scales to stretch from 3" to 42".
while
Filter material is plotted on a log(size) vs. probability chart
and
Soil tests are conventionally plotted on a log(size) vs. percent retained chart.
LabSuite allows you to save your grain size settings selections: before entering data for a
new test you can recall a saved group of settings to ensure that the program is properly configured
for the type of material tested. For example, you can load the Riprap settings before entering a riprap
test, or load the Filter settings before entering a filter test, etc.
; Every test entered into a given GEOSYSTEM project file shares the same configuration settings. Because of this, if the tests that you’ve performed for a given
project need several different configurations, you’ll need to create a new project
file for each different configuration.
To save your current program settings:
1. Select Options > Program Setup then click on Saved Settings in the navigation list at
the dialog’s left side.
2. In the Save this configuration as: field, enter a name: When you start a new test that
uses the same settings, you load them from the Current saved settings: list by clicking
on your chosen name.
www.geosystemsoftware.com
LabSuite by GEOSYSTEM Software
LabSuite User’s Guide
33
To use your saved settings for a new test:
1. Open the Settings dialog (Options > Program Setup).
2. Click on Saved Settings in the navigation list at the dialog’s left side.
3. Click on your settings name in the Current saved settings: box then click on the Load
button.
; To delete a saved batch of settings click on the settings name in the Current
saved settings: box then click on the Delete button.
2.8
The Container List
LabSuite may be set up to keep a list of sample container IDs and weights. You can use this
feature avoid weighing:
• The container used to weigh the grain size sieve test sample.
• The pan used for cumulative weight retained sieve tests.
• The container used for hygroscopic moisture content tests.
• The container used for Atterberg limits moisture content tests.
• The container used for the moisture content tests performed as part of a moisture-density
(Proctor) test.
Instead of weighing your containers every time they’re used, you can enter their weight and
ID (any label that can uniquely identify the container) into the program’s container weight database.
When you use an ID’d container for a test, record the container’s ID as part of your testing information and enter the ID into LabSuite instead of the container weight.
To set up the container list, select Options > Container List.
Figure 2.25: The Container List Dialog
Copyright 2005-2009 GEOSYSTEM Software, Inc.
http://geosystemsoftware.com/support.htm
34
Configuration
To add a new container to the list:
Click on the first blank row in the list and enter the container ID and container
weight.
; Container IDs may be any combination of alphabetic and numeric characters;
e.g., ACD or 123. IDs that differ only by case (e.g., 3A and 3a) are considered
identical.
; Container IDs may be added to the list in any order.
To remove a container from the list:
Click in either the Container ID or Weight columns of the row you want to delete
then click on the Delete button.
; The container list is always optional: if you run a test with a container that is not
on your container list, you can skip entering a container ID and instead enter the
container’s weight.
After you’re through entering your container weights, close the dialog then select Options
> Program Setup, click on Data Entry in the Setup dialog’s left-hand navigation panel, then select
Tare ID in the Container weights are entered as box.
www.geosystemsoftware.com
LabSuite by GEOSYSTEM Software
3. Entering Grain Size Test Data
Data entry for a grain size distribution test is split into three steps:
• Sample and test background information, which covers basic information about the grain
size distribution test and the sample tested.
• Sieve test data entry.
• Hydrometer test data entry.
Begin by selecting Test > Enter GrainSize Data. The following sections discuss each subsequent data entry step in further detail.
3.1
Sample and Test Information
Figure 3.1: Sample Info. Window
The grain size test initial data entry window covers basic information about the test and
the sample tested. This window is displayed by clicking on the Sample Info. navigation tab, or by
selecting Window > Sample Info.
Some items on the window may be automatically filled in by other data reduction modules.
(For example, the sample’s USCS classification is automatically calculated after the percent passing
35
36
Entering Grain Size Test Data
the #4 and #200 sieves and the soil’s plastic and liquid limit are determined.) Leave these fields blank;
after you’ve completed data entry for the lab tests, the missing information will be automaticalled
filled in.
; Because LabSuite supports a number of different report formats, the information
requested on this screen varies according to which report format is selected; e.g.,
some formats may include a place for listing the sample’s USCS classification,
while others may omit this information.
You can select from the program’s different report forms with the Report form
toolbar at the top of the report preview window (Window > Report Preview).
While most of the information requested on the Sample Info. window is self-explanatory; a
few require further definition:
Tested by
Checked by
If you fill in either of these fields, the information that you enter will be shown
below the border of the test’s chart report, as the following figure demonstrates:
Figure 3.2: Report With Tested By and Checked By
; When printing more than one test per page, LabSuite will use the "Checked
by" name entered for the first test placed on the page.
Material description
LabSuite normally uses the material description that you entered into the Material Description field on the Data Manager window (that’s the window with
the numbered sample cards where you entered the sample’s number, depth, etc.).
However, if you’re entering boring log data, the material description at the depth
where you took your lab. test sample may only be something like:
grades to slightly silty
with the full stratigraphy description entered at some depth above the lab. test
sample. If this is the case, you can either override the default description or click
on the link that reads Click here to select from a list of material descriptions: this drops down a box listing all of the material descriptions entered into
the current source folder. Double-click on one of the descriptions to select it.
Sieve test style
This selection box is used to specify how you weighed the material retained on
each sieve:
www.geosystemsoftware.com
LabSuite by GEOSYSTEM Software
LabSuite User’s Guide
37
• Cumulative weight retained indicates that after shaking the sieves you emptied each sieve into a common pan; the pan should have been weighed after
each sieve’s retained material was added. ("Cumulative" means that you’re
accumulating the material retained on each sieve into a single pan.)
• Per-sieve weight retained indicates that you’ve weighed each sieve when
empty; after shaking the sieves, each sieve was weighed a second time along
with the material retained on the sieve.
• Selecting Precalculated lets you enter your own percentages. This option is
useful if you need to graph sieve sizes and percentages provided by a client.
; Note: if you change this selection after entering sieve test data, any grain size
test data that you’ve already entered for the sample will be erased.
The following table lists the data requested for each sieve that you test:
Sieve Test Style What You Need to Enter
Cumulative weight Cumulative pan weight (entered once per test)
retained Sieve size
Cumulative weight retained
Per-sieve weight Sieve size
retained Combined weight of the sieve and the material retained on the
sieve
Sieve weight
Precalculated Sieve size
Percent finer
Opening sizes
If you certify your sieves’ opening sizes with a statistical measurement process
LabSuite gives you the ability to precisely specify the opening size of each sieve
that you use in your test. (For example, a #10 sieve is normally considered to
have a 2 mm. opening size; if your sieve’s openings averages 1.994 mm. with
an optical measurement device, you can have LabSuite report the diameter of
particles passing that sieve as being smaller than 1.994 mm. instead of 2 mm.)
LabSuite does this by keeping a list of the sizes of the various sets of sieves that
you use for your tests (one set = all of the sieves used for a given test).
If you’ve set up this list through the program’s Setup dialog, use the Opening
sizes selection box to choose the sieve sizes list for the test that you’ll be entering.
If you haven’t set up the sieve sizes list, or if you used sieves that you haven’t entered into the sizes list, select (Default opening sizes) from the opening
sizes selection box.
Copyright 2005-2009 GEOSYSTEM Software, Inc.
http://geosystemsoftware.com/support.htm
38
Entering Grain Size Test Data
Classification system
Each method used to classify soil (i.e., USCS, Burmister, Wentworth, etc.) subdivides material into gravel, sand, silt and clay at different particle sizes. (For
example, the USCS system defines sand as material between #4 and #200 in size,
while Burmister defines sand as being between #10 and #200.) You can select
your preferred classification system for the test that you’ll be entering at the
Classification system box.
Your selection affects the percentages reported for gravel, sand, silt and clay, as
well as the appearance of most of the program’s chart reports. Following is a section of a GSGEOSYS report form printed for a test using different classification
system selections:
Figure 3.3: USCS
Figure 3.4: USCS without coarse/medium/fine divisions
Figure 3.5: Wentworth
Figure 3.6: Burmister
; There’s two USCS selection options:
USCS without coarse/medium/fine divisions
and
USCS
The latter option reports Gravel and Sand percentages without subdividing
the gravel size into "coarse" and "fine" and the sand into "coarse", "medium" and
"fine".
; We’ll be posting more particle classification systems on our website as they’re
requested by LabSuite’s users. Click on the More... button to view an updated list.
www.geosystemsoftware.com
LabSuite by GEOSYSTEM Software
LabSuite User’s Guide
39
Specification
Specification envelopes provide upper and lower boundaries for some of the sieves
in your test; for example, your client may require that a given delivered material
test with 100% of its particles smaller than the 3/8" sieve, and with between
10% and 20% of its particles smaller than #200 sieve. The program maintains
a database of specification envelopes taken from ASTM, AASHTO, Superpave
and ISSA (International Slurry Surfacing Association) standards; you can also
add your own envelopes to the database through the Specification Envelopes
window on the program’s Setup dialog (Options > Program Setup).
If you have a specification envelope that you’d like to associate with the test
that you’ll be entering, use the Specification box to select your envelope. If
you do not want to use a specification envelope, select (no specification
envelope) from the Specification box.
Copyright 2005-2009 GEOSYSTEM Software, Inc.
http://geosystemsoftware.com/support.htm
40
Entering Grain Size Test Data
3.1.1
Sample Info. Selection Lists
If you find that you’re typing the same information into one of the data entry fields on the
Sample Info. window for test after test, you can use the program’s Selection List feature to turn the
field into a popup list of selections that can be inserted into the field with a simple mouse click. There
are a couple of cases where this feature can be especially useful:
; You can set up a list of standard entries for fields such as "Tested By", "Checked
By", etc. so that you can select – with a single mouse click – from a list of personnel instead of typing in the same names over and over for every test you enter.
; Selection Lists can also be used to easily insert boilerplate text into, for example,
the testing remarks field. This can be very handy if the same basic text is always
typed into a particular data entry field.
To create a selection list for a field:
Right-click on the field and select Make a Selection List. This shows an empty
selection list box that you’ll need to fill with selection entries (such as personnel
names, or your test remarks boilerplate text):
Figure 3.7: Empty Selection List for "Tested by"
www.geosystemsoftware.com
LabSuite by GEOSYSTEM Software
LabSuite User’s Guide
41
Next, right-click within the empty selection list and select Edit, Delete and Add
Entries. When you’ve done this LabSuite will show the Selection List Editor
dialog:
Figure 3.8: Selection List Editor
(The editor box above has already been filled in with a number of testing personnel names.)
Each selection that you want to appear is typed on a separate line: Type a selection, then follow by pressing the Enter key (this will show up as a ¶ sign at
the end of the entry). (You can delete entries by simply deleting the line of text
that defines the entry, including the ¶ sign at the end of the line.) When you’re
finished, click OK to save the list.
To use a selection list
Once you’ve created a selection list for a given data entry field, that list will
automatically appear when you click in the data entry field, at which point you
can either click on one of the items in the list (which will automatically fill in
your data entry field with that item), or manually type data into your field.
The figure below shows a sample "Tested by" selection list:
Figure 3.9: Sample Selection List
To delete a data entry field’s selection list:
Right-click on the data entry field then select Delete the Selection List. This
action can be undone: You can make your selection list reappear by right-clicking
within the data entry field and selecting Make a selection list again (the program
will have preserved your original selection list entries).
Copyright 2005-2009 GEOSYSTEM Software, Inc.
http://geosystemsoftware.com/support.htm
42
Entering Grain Size Test Data
3.2
Sieve Test Data Entry
The sieve test data entry window may be viewed by selecting Window > Sieve Test, or by
clicking on the Sieve Test navigation tab.
Figure 3.10: Sieve Test Data Entry Window
The following sections cover the data entry process for sieve tests.
3.2.1
#200 Wash Test
If the sample was washed on a #200 sieve prior to performing a standard sieve test, begin
data entry for your sieve test by entering the after-wash sample weights into the If you washed the
sample over a #200 sieve, enter the post-wash weights here box. LabSuite uses your #200
wash data as follows:
• The amount washed through the sieve is printed on data summary reports as an alternate
#200 percentage value.
• The weight of the material washed out is used in calculating percent-retained values for
post split-sample sieves (see the program’s technical documentation for details).
• If you do not enter data for a #200 sieve as part of your sieve test data, LabSuite will use
the percent washed out when it charts your test data – that percentage will be charted as
the percent passing the #200 sieve.
www.geosystemsoftware.com
LabSuite by GEOSYSTEM Software
LabSuite User’s Guide
43
; If you did not wash the complete sample over a #200 sieve prior to performing
a standard sieve test, press Enter without typing anything into the Dry sample
and tare weight (grams) field.
3.2.2
Entering the Sample Weight
Before entering any sieve data you’ll need to enter the weight of the sample that you tested:
In the Dry Sample and Tare (grams) column on the first row of the grid, type in the total weight of
the sample and its container, then press Enter and type the container weight into the Tare (grams)
column. Enter 0 for the container weight if you "tared out" the scale with the sample container.
Figure 3.11: Sample Weights Entry
; If the sample was washed over a #200 sieve prior to sieving, the total sample
weight that you’ll be entering is the dry weight of the sample prior to washing.
You only need to fill in the Dry Sample and Tare (grams) and Tare (grams) columns on
the first row of the grid. On subsequent rows, leave these two columns blank, unless the sieve that
you’ll be entering on that row was the first sieve tested with a smaller (split) sample, in which case
you’ll need to fill in the Dry Sample and Tare (grams) and Tare (grams) columns with the weights
of the split sample and its container.
The following image may help explain the situation:
Copyright 2005-2009 GEOSYSTEM Software, Inc.
http://geosystemsoftware.com/support.htm
44
Entering Grain Size Test Data
Figure 3.12: Completed Sieve Test Data Entry Form
• Row 1 of the grid lists the weight of the original sample and tare weight (4442.0 and
213.7, respectively, which means that the sample weighed 4228.3 grams) and the weight
of the cumulative pan, which was 0 because the scale was zeroed after the cumulative pan
was placed on it.
• Rows 2-7 do not list sample or cumulative pan weights, so LabSuite knows that the 1.5",
1", .75", .5", .375", #4 and #10 sieves were all tested using the full 4228.3 gram sample.
• Row 8 indicates that the sample was split and that a 50.13 gram sample was sieved through
the #20, #40, #60, etc. sieves.
; After you’ve entered the initial sample weights, when you start a new row on
the data entry grid the editing cursor will proceed directly to the Sieve Opening
Size column. If you split the sample before testing the sieve whose data you’ll be
entering on that grid row, press the left arrow key to jump to the Dry Sample
and Tare (grams) column then enter the split sample’s weights.
; If you’re upgrading to LabSuite from an older GEOSYSTEM Grain Size Distribution program, you may be interested to know that the program now supports
more than one sample split per sieve test.
3.2.3
Cumulative Pan Weight
If you’ve chosen the Cumulative weight retained test style, after the sample tare weight
you’ll be asked to enter the Cumulative Pan Tare Weight: In this column you need to enter the
weight of the pan in which you accumulated the material retained on each sieve.
www.geosystemsoftware.com
LabSuite by GEOSYSTEM Software
LabSuite User’s Guide
45
; If you "tared out" the scale after placing the cumulative pan on it, enter 0 as the
Cumulative Pan Tare Weight.
; If you split your sample, LabSuite assumes that the cumulative pan is emptied
before the first post-split sieve is weighed.
3.2.4
Entering Sieve Sizes
The term opening size refers to the dimension of the openings in a wire mesh sieve. When
you enter sieve test data, the program will need to know the opening size of each sieve used in the
test – this information is entered into the Sieve Opening Size column on the sieve test grid.
; Measured sieve openings should normally be entered in dimension units appropriate for the project file on which you’re working: If you’ve configured the
project to use SI units, enter your sieve opening sizes in millimeters; for a US
unit project, enter your sieve opening sizes in inches. (To change your project’s
dimension units, start your GEOSYSTEM program, open the project, then select
Project > Dimension Units.
To enter a metric opening size into a US unit project, add an mm. to the end of
the measurement (e.g., 0.075mm.). Similarly, to enter an opening size in inches
into a SI unit project, add in. to the end of your measurement (e.g., 1 in.).
; You can enter fractional sizes such as "one half" as either a decimal number (e.g.,
0.5 or just .5) or by using the "/" symbol as the fraction mark (e.g., 1/2, or
1-1/2 for a 1.5 inch sieve).
; The first numbered sieve should be entered with a "#" sign; e.g., #4. For subsequent sieves you can drop the "#" because LabSuite will assume that all sieves
smaller than the first numbered sieve are also numbered sieves.
The dimensions of numbered sieves are taken from reference standards; your sieves’ openings
may be slightly larger or smaller than the reference sizes. For example, the standard opening size for
a #10 sieve is 2mm., but if you were to average the opening sizes of a given sieve’s mesh, you might
come up with 1.98mm. If you were to use our hypothetical sieve in a sieve test, you might prefer
that LabSuite program mark the percent retained on that sieve against 1.98mm. on the particle size
distribution chart.
Copyright 2005-2009 GEOSYSTEM Software, Inc.
http://geosystemsoftware.com/support.htm
46
Entering Grain Size Test Data
As an example, the following image is taken from a section of a particle size distribution
chart. The standard sieve sizes listed at the top of the chart are always drawn at the hypothetical
exact opening size (4.7mm. for the #4, 2mm. for the #10 and 0.85mm. for the #20). Within the chart
are three points from a curve: notice that the left and right points fall directly on the vertical lines
that LabSuite drew to denote the exact #4 and #20 opening sizes, while the point in the middle falls
somewhat to the right of the #10 line: When this test was entered, the measured dimension of the #10
sieve used for the test was noted as being 1.9mm.; the #4 and #20 sieves were left as-is.
Figure 3.13: Selecting the Size of a Numbered Sieve
If you’ve had your sieves’ opening sizes measured and would like to use the measured sizes:
1. Use the program’s sieve opening sizes tool to specify the measured opening sizes of a batch
of sieves that you’ll be using.
2. On the Sample Info. window displayed when you begin data entry for a new test, select
your opening size list from the Opening sizes box.
3.2.5
Entering Sieve Weights
After entering each sieve’s opening size, you’ll need to enter the weight of material retained
on that sieve:
• If you’re using the cumulative weight retained test style, you’ll need to enter the weight of
the cumulative pan with the sieve’s retained material.
• If you’re using the per-sieve weight retained test method, you’ll need to enter two weights:
a) the weight of the sieve along with the material retained on the sieve, and b) the weight
of the empty sieve.
www.geosystemsoftware.com
LabSuite by GEOSYSTEM Software
LabSuite User’s Guide
3.2.6
47
Split Samples
As you’re entering your sieve test data you may come to a point where the sample was split
and only a portion of the original sample was passed through the smaller sieve sizes. At this point
you need to let the program know that a smaller portion of the original sample was used for the sieve
that you’ll be entering (as well as for subsequent sieves). To do this:
1. When you reach the point where you’ll be entering the opening size for the first post-split
sieve, instead of entering the sieve’s opening size, press the left arrow key: this will bring
you back to the Dry Sample and Tare column.
2. Enter the total weight of the post-split sample and its container, then press Enter and enter
the container weight.
3. Next, if you’re using the cumulative weight retained test method, enter the weight of the
post-split cumulative pan.
Important note: If you’re using the same cumulative pan for both the original and the
post-split sample, you must empty the pan before adding the material from the first postsplit sieve.
4. Finally, enter your first post-split sieve’s data. Enter this sieve’s data on the same grid row
as your post-split sample weights (see row 8 in the following picture).
; Note that previous GEOSYSTEM grain size programs allowed at most a single
sample split per test. The current version allows an unlimited number of sample
splits.
Figure 3.14: Test with Sample Split on Material Passing on #10 Sieve
Copyright 2005-2009 GEOSYSTEM Software, Inc.
http://geosystemsoftware.com/support.htm
48
Entering Grain Size Test Data
3.2.7
Saving the Current Test as a Sieve Nest
After you’ve entered your sieve test you can save the list of sieves that you’ve entered as
a sieve nest: Before entering another test that uses the same set of sieves, if you select your saved
sieve nest from the dropdown Sieve nest box you can avoid entering the test’s sieve sizes because
LabSuite will fill them in for you.
To save a test’s list of sieves as a sieve nest:
1. After you’ve entered the sieve test data, click on the Save Current Sieve Nest button in
the toolbar at top of the sieve test data entry window.
2. Enter a name into the Sieve nest name field. There are no restrictions on what you can
use as a name, but the program will display a warning message if you try to use a name
that’s already used by another sieve nest.
3. After you’ve entered a name for the list of sieves, click the Save button.
; If you find that there’s already a name entered into the Sieve nest name field,
it means that LabSuite has found a sieve nest that exactly matches the one that
you’re trying to save – since the exact same sieve nest is already entered into the
program’s list, you may not want to save it a second time.
; You can delete and modify saved sieve nests through the program’s Setup dialog: Select Options > Program Setup then click on Sieve Nests in the left-hand
navigation panel.
Once you’ve added your sieve nest to the program’s sieve nest database, when you begin data
entry for a new sieve test, start by selecting your sieve nest from the drop-down Sieve nest list in
the toolbar at the top of the screen: LabSuite will fill in the test’s Sieve Opening Size column with
your saved sieve sizes, meaning that you can skip entering the size of each sieve. As an example, the
following screenshot shows the sieve test data entry screen after the built-in ASTM D422 UniformSpacing Set sieve nest was selected:
www.geosystemsoftware.com
LabSuite by GEOSYSTEM Software
LabSuite User’s Guide
49
Figure 3.15: Sieve Test Data Entry Screen After Sieve Nest Selection
If you were entering data for this test, you’d be asked to enter the Dry Sample and Tare and
Tare weights, followed by the weight retained on the 3 inch sieve. The Sieve Opening Size column
is automatically skipped because it has already been filled in for you. When you press Enter after
entering the weight retained on the 3 inch sieve, you’ll be asked for the weight retained on the 1.5
inch sieve – the 1.5 inch Sieve Opening Size column is skipped.
; If you need to enter data for a sieve not listed in the sieve nest that you
selected: When you reach the sieve test grid row for the first sieve smaller than
the missing sieve, select Edit > Insert Data Row.
; If the sieve nest lists sieves that you did not use in your test: In the sieve
test grid, click on the unneeded sieve enter, then select Edit > Delete Data Row.
Copyright 2005-2009 GEOSYSTEM Software, Inc.
http://geosystemsoftware.com/support.htm
50
Entering Grain Size Test Data
3.3
Hydrometer Test Data Entry
The hydrometer test data entry screen may be viewed by selecting Window > Hydrometer
Test, or by clicking on the Hydrometer Test navigation tab.
Figure 3.16: A Portion of the Hydrometer Test Data Entry Window
3.3.1
Test Background Information
Before entering your hydrometer test readings, you’ll need to enter a little background information on the test:
Separation sieve
The separation sieve is the sieve used to separate the material used in the sieve
test from the material to be used in the hydrometer test. Typically (i.e., per
ASTM D 422) the #10 sieve is used.
Percent of original sample finer than the separation sieve
The program usually calculates the percent passing the separation sieve from the
sieve test data that you’ve entered; however, if you did not enter sieve test data,
use this field to enter the percent finer as a number between 0 and 100.
www.geosystemsoftware.com
LabSuite by GEOSYSTEM Software
LabSuite User’s Guide
51
Sample weight (grams)
This is the weight of the hydrometer sample, not the weight of the material passing the separation sieve.
Specific gravity
Enter the specific gravity of the sample.
Hygroscopic moisture
If you performed a hygroscopic moisture test on your hydrometer sample, enter
the test weights into the Hygroscopic moisture box.
; The Container ID field is used if you’ve entered container weights and IDs
into the program’s container list: Rather than entering the weight of the container that you used for the hygroscopic moisture test, you can enter the ID
of the container LabSuite will look up the corresponding weight. Container
ID is not enabled unless you’ve selected tare ID at the Container weights
are entered as prompt on the program’s Setup dialog (Options > Program
Setup then click on Data Entry in the left-hand navigation panel).
; LabSuite will assume zero percent hygroscopic moisture uptake if you do not
enter any hygroscopic moisture data.
Single-point (automatic) temperature correction
Multi-point (linear regression) temperature correction
ASTM D 422 specifies that hydrometer readings are to be corrected for differences due to temperature, meniscus, and dispersing agent specific gravity: A
graph of correction vs. temperature is prepared and each hydrometer test reading is adjusted based on the correction value read off the graph at the test fluid
temperature.
LabSuite also offers a alternative to ASTM’s multi-point correction procedure:
If you take a single correction measurement at a fluid temperature of 20∘ centigrade, LabSuite can use a standard formula for the change in fluid density as
a function of temperature to determine appropriate correction values at other
temperatures.
• To use the ASTM D 422 correction procedure, select Multi-point (linear regression) temperature correction. You’ll be asked to enter up to six hydrometer readings and the corresponding temperature (in ∘ C) of the fluid at
each reading.
• To use LabSuite’s single correction point procedure, select Single-point (automatic) temperature correction. You’ll be asked to enter a correction measurement taken at a fluid temperature of 20∘ centigrade.
Copyright 2005-2009 GEOSYSTEM Software, Inc.
http://geosystemsoftware.com/support.htm
52
Entering Grain Size Test Data
; Hydrometer correction readings should be taken from the top of the meniscus
using the liquid solution (without soil!) that will be utilized for the actual
test.
; Hydrometer correction values are the negative of the readings that
you take (e.g., if your reading was 6, enter -6).
; Corrections for 151H hydrometers should be entered as the number of thousands; e.g., -6.0 instead of -0.006.
Meniscus correction
This value is the height of the meniscus, and should be 0 if all hydrometer test
readings were taken at the bottom of the meniscus; otherwise, it should be a
positive number indicating the height of the meniscus in hydrometer gradations
(e.g., for 152H, usually between +.5 and +1). For the 151H hydrometer, make
sure to enter the correction as the number of thousands (e.g. 0.3 instead of
0.0003).
151H
152H
Check either 151H or 152H, depending upon the type of hydrometer used for
your test.
Effective depth equation
In almost all cases, the default values given for the equation should be accepted
as-is. Before modifying these values, consult ASTM D 422’s Diameter of Soil
Particles calculation section (currently Section 15), and the program’s Technical
Documentation chapter.
; The default values for a 151H hydrometer are
L = 16.294964 - 0.2645*Rm
The default values for a 152H hydrometer are
L = 16.294964 - 0.164*Rm
3.3.2
The Hydrometer Test Readings Grid
For each hydrometer reading, enter the elapsed time (in decimal minutes; e.g., 1 minute
thirty seconds should be entered as 1.5), the temperature (in ∘ C) and the hydrometer reading. 151H
readings should be entered as the number of thousands (e.g. if the reading is 1.0279, enter it as 27.9).
; Use the Enter key to change between cells on the grid; e.g., after you’ve typed in
an elapsed time, press Enter to jump to the temperature column.
; After you’ve typed in the elapsed time, you can skip entering the fluid temperature if it’s the same as the temperature on the row above the one on which you’re
typing: press Enter twice to skip the temperature column.
www.geosystemsoftware.com
LabSuite by GEOSYSTEM Software
4. Viewing and Modifying the Particle Size
Curve
To display a chart of the particle size distribution curve, select Window > Chart, or click on
the Chart navigation tab.
Figure 4.1: Particle Size Chart Review Window
; (FYI: "Cu " stands for Coefficient of uniformity; "Cc " stands for Coefficient of curvature and "F.M." stands for Fineness Modulus.)
If you find that your test data has resulted in an irregularly shaped curve, you can reshape it
from this screen:
To reposition the curve:
The shape of the curve may be adjusted by forcing it to pass through a new point.
To do this, select Curve > Add Shaping Point. When the mouse cursor changes
to a cross, move the cursor to the location desired for the curve to pass through,
then click the left mouse button. The new point (called a shaping point) will be
marked with a "+".
When shown on a chart report, the curve will pass through the new point, although no marker will be plotted to mark the point.
53
54
Viewing and Modifying the Particle Size Curve
To delete a shaping point:
To remove a shaping point, select Curve > Delete Shaping Point, then move the
mouse cursor close to the shaping point (remember, shaping points are drawn
with markers that look like "+" signs) then click the left mouse button.
To remove all shaping points:
Select Curve > Delete All Shaping Points.
If the curve’s shape cannot be adjusted satisfactorily, you can select Curve > Do Not Draw
Curve: This stops the program from drawing the curve on the chart report. Markers showing the
position of each test point will still be drawn.
4.1
Selecting the .45-Power Curve Maximum Density Line
When plotting a diameter^0.45 grain size chart, the program can be configured to draw a
maximum density line from the chart origin to 100% finer at a selectable maximum particle size.
To select a maximum particle size:
Drop down the toolbar list box labeled Max. dens. size and choose a sieve size
from the list.
To turn off the maximum density line:
Select « omit » in the Max. dens. size toolbar list box.
4.2
The Chart Calculator
When you’re previewing the grain size chart chart, selecting Curve > Calculator opens a
dialog where you can check the percent of material smaller than a given particle size, or determine
the particle size that corresponds to a particular percentage.
; To calculate the percent of material smaller than a particular particle size, enter
the size into the dialog’s Particle size box. If you’re working with a project using
US dimensions add mm. at the end of the particle size if you’re entering a size in
millimeters. Conversely, if you’re working with an SI-dimensioned project, add
in. to enter a size in inches. Numbered sieves need to have # at the front; e.g.,
#200.
; To calculate the particle size corresponding to a particular percentage, enter the
percentage into the Percent smaller or Percent larger box.
www.geosystemsoftware.com
LabSuite by GEOSYSTEM Software
5. Entering Atterberg Limits Test Data
Data entry for an Atterberg limits test involves two steps:
• Sample background information, which covers basic information about the sample tested.
• Atterberg test data entry, which involves the actual liquid and plastic limit test data, along
with, optionally, natural moisture data.
Begin by selecting Test > Enter LIMITS Data. The following sections discuss each subsequent data entry step in further detail.
5.1
Atterberg Limits Sample Information
The initial Atterberg limits data entry window covers basic information about the tested
sample. This window is displayed by clicking on the Sample Info. navigation tab, or by selecting
Window > Sample Info. The display is similar to the grain size test sample information window
covered in § 3.1.
Figure 5.1: Atterberg Limits Sample Information Window
55
56
Entering Atterberg Limits Test Data
5.2
Atterberg Limits Test Entry
LabSuite’s Atterberg test data entry window may be viewed by selecting Window > Test
Data or by clicking on the Test Data navigation tab.
Figure 5.2: Atterberg Limits Test Data Entry Window
Data entry for the liquid limit, plastic limit and natural moisture tests is covered in the following sections.
5.2.1
Liquid Limit Test Data Entry
LabSuite supports two distinct liquid limit tests per sample: one on the as-received sample
and a second (optional) test on an oven-dried portion of the sample. (The oven-dried test is used as an
organics check by the ASTM D 2487 (USCS) classification.) Before entering liquid limit data, click
on the "Standard" Liquid Limit Test tab. Afterwards, if you need to enter an oven-dried liquid limit
test, click on the Oven-Dried Organics Check tab then enter your oven-dried liquid limit data.
www.geosystemsoftware.com
LabSuite by GEOSYSTEM Software
LabSuite User’s Guide
57
Tare ID
If the option to enter container weights as tare IDs has been selected, data entry
begins by selecting an ID from the drop-down tare ID list. Once an ID is chosen,
Tare box will be filled in with the weight corresponding to that container.
; If you haven’t yet entered the container and its weight into the program’s
container list, see § 2.8 for instructions on adding it. Alternatively, the tare
ID field may be left blank and a tare weight may be manually entered.
Wt. w+t
Wt. d+t
Tare
These are, respectively: the weights (in grams) of the wet soil and container, dry
soil and container and the container by itself.
Blows
Enter the number of blows required to close the grooved soil.
NV
Check this box if the liquid limit could not be determined.
Use ASTM D 4318 1-point calculation method
If the liquid limit test is to be calculated by the ASTM one-point method, click
on this check box.
Note that the one-point option may be selected for either the natural or ovendried liquid limit or both – the check box lists the selection for the soil type (natural or oven-dried) currently selected. For example, to select the one-point method
for the oven-dried sample, first click on the Oven-Dried Organics Check soiltype tab, then click on the Use ASTM D 4318 1-point calculation method
check box.
Copyright 2005-2009 GEOSYSTEM Software, Inc.
http://geosystemsoftware.com/support.htm
58
Entering Atterberg Limits Test Data
5.2.2
Plastic Limit Test Data Entry
LabSuite supports up to 4 plastic limit moisture content tests. Data entry is similar to the
liquid limit procedure covered above.
NP
Check this box if the plastic limit could not be determined (the check box is only
available if you haven’t entered any plastic limit data).
5.2.3
Natural Moisture Test Data Entry
The software also accepts data for a natural moisture content test used to calculate the soil’s
liquidity index.
; Natural moisture content entry is optional; it’s not required in order to calculate
the soil’s liquid or plastic limit or the plasticity index.
www.geosystemsoftware.com
LabSuite by GEOSYSTEM Software
6. Soil Classifications
After you’ve entered your grain size and Atterberg test information, you may want to check
the soil classification values that the program has calculated for your data. Begin by selecting Test
> Enter Classifications Data, then use the various menu selections underneath Window (e.g., Window
> USCS or Window > AASHTO, etc.) to view the program’s classification windows.
; Although the program will normally extract the sieve percentages and Atterberg
limits values needed to classify your soil directly from your grain size and Atterberg test data, you can also opt to skip entering testing data and directly enter
your own sieve percentages and Atterberg values into the program’s classification
windows.
6.1
USCS Classification
Select Window > USCS to view the USCS classification window.
Figure 6.1: USCS Classification Data Entry Window
59
60
Soil Classifications
Sieve percentages
Enter these values as numbers between 0 and 100.
; The first field requires the percentage retained on the sieve, while the other
sieve percentages reflect the percent passing each sieve.
Atterberg limits
Enter the liquid and plastic Atterberg limits for the soil.
; The oven-dry liquid limit is used only for classifying possibly organic finegrained soils (i.e, when 50 percent or more of the sample is fines). The ovendry liquid limit field may be left blank when classifying coarse-grained soils,
or fine-grained soils where the organic content is known to be minimal.
Diameters at X percent
These values, which represent the grain-size in millimeters at which 60, 30, and
10 percent of the sample is finer.
; Diameters are required only when classifying coarse-grained soils.
; If, after entering your grain size test data, the D10 value is blank, and a
coarse-grained soil is being classified, select Test > Enter GrainSize Data
then select Window > Chart. Next, add a shaping point on the right-side
of the curve that extends the curve below the 10% scale line (this interpolates a D10 value), then return to your classification window (Test > Enter
Classifications Data. (Again, since D10 is used only when classifying coarsegrained soils, this procedure is not required if 50% or more of the sample
consists of fines.)
Borderline soil type
Second symbol
The software allows you to enter a second classification symbol if you think
that the soil is on a borderline between two classifications (see ASTM D 2487,
Section 1.1). Doing so assigns the soil a dual classification such as "CL/CH" or
"GM/SM": the first classification is the one selected by the program, and the
classification after the slash is the one you choose.
If you want to assign a dual classification to the soil, click on the Borderline
soil type check box, then enter the soil’s second classification into the Second
symbol box. (Note that the slash "/" is automatically added so you do not need
to enter it as part of the second classification.)
; The Borderline soil type check box will be disabled if the program classifies
your soil using a dual symbol such as GP-GM or CL-ML.
www.geosystemsoftware.com
LabSuite by GEOSYSTEM Software
LabSuite User’s Guide
61
Add the group name to your soil description
Insert Group Name at the Cursor
The box underneath Add the group name to your soil description lists your
current soil description: if you’d like to insert the classification group symbol
into the description, click inside the box, move the editing cursor to the position
where the group symbol is to be located, then click on the Insert Group Name
at the Cursor button.
6.1.1
Classifying Soil with +3 Inch Material
When your sample contains material larger than 3 inches the program’s classification system
recalculates the Smaller than #4 and Smaller than #200 values to remove the influence of the plus 3
inch material (i.e., the #4 and #200 values are calculated based on a sample that has no material larger
than 3 inches). This is done because the ASTM D 2487 classification is based exclusively on material
smaller than 3 inches.
; The calculation is:
𝑏𝑖𝑎𝑠𝑒𝑑 #4 𝑚𝑎𝑡𝑒𝑟𝑖𝑎𝑙 =
𝑎𝑐𝑡𝑢𝑎𝑙 #4 𝑚𝑎𝑡𝑒𝑟𝑖𝑎𝑙
100 − 𝑝𝑙𝑢𝑠 3 𝑖𝑛𝑐ℎ
While the program can remove the influence of the plus 3 inch material from the #4 and #200
sieve percentages, it cannot do the same for the Diameters at X percent values, so the D60 , D30 and
D10 values will continue to reflect the numbers calculated for the whole sample (including plus 3 inch
material); the #4 and #200 values will reflect a sample without any material larger than 3 inches.
This may or may not cause the program’s classification to be invalid (the Dx values are only used to
distinguish between GW and GP and between SW and SP).
Copyright 2005-2009 GEOSYSTEM Software, Inc.
http://geosystemsoftware.com/support.htm
62
Soil Classifications
6.2
AASHTO Classification
Select Window > AASHTO to view the AASHTO M 145 classification window.
Figure 6.2: AASHTO Classification Data Entry Window
Sieve percentages
Enter these values as numbers between 0 and 100.
; The first field requires the percentage retained on the 3 inch/75 mm. sieve,
while the other sieve percentages reflect the percent passing the various sieves.
Atterberg limits
Enter the liquid and plastic Atterberg limits for the soil.
Highly organic soil
Checking this box forces the soil’s classification to be A-8.
www.geosystemsoftware.com
LabSuite by GEOSYSTEM Software
LabSuite User’s Guide
6.3
63
Burmister Classification
Select Window > AASHTO to view the AASHTO M 145 classification window.
Figure 6.3: Burmister Classification Data Entry Window
Sieve percentages
Enter these values as numbers between 0 and 100.
; The first field requires the percentage retained on the 3 inch/75 mm sieve,
while the other sieve percentages reflect the percent passing the various sieves.
; Note: All fields require data; if all material is smaller than a particular sieve
enter 100 as the percent passing, if all material is larger, enter 0 as the percent
passing.
Copyright 2005-2009 GEOSYSTEM Software, Inc.
http://geosystemsoftware.com/support.htm
Soil Classifications
64
Overall plasticity index
This is the plasticity index of the entire specimen.
Smallest thread diameter
This is the diameter (in inches) of the smallest thread that could be rolled at the
ball moisture of the specimen.
Color
Used to briefly describe the soil color.
Grain shape
Use this field to enter a brief description of the grain shape (e.g., water worn,
angular, etc.).
Other
Use this field to enter any additional information that you want to add to the
end of the identification.
Principal component
Select either Granular or Clay as the component of primary influence on the
behavior of the soil. This is based on engineering judgment.
Add the ID or symbol to your soil description
Insert at the Cursor
The box underneath Add the ID or symbol to your soil description lists
your current soil description: if you’d like to insert the either the Burmister
identification or symbol into the description, click either Insert ID (to insert the
identification) or Insert symbol (to insert the symbol), then click inside the
description box, move the editing cursor to the position where the group symbol
is to be located, then click on the Insert at the Cursor button.
www.geosystemsoftware.com
LabSuite by GEOSYSTEM Software
LabSuite User’s Guide
6.4
65
USDA Classification
Select Window > USDA to view the USDA classification window.
Figure 6.4: USDA Classification Data Entry Window
Sieve percentages
Enter these values as numbers between 0 and 100.
; Note: All fields require data: if all material is smaller than a particular sieve
enter 100 as the percent passing, if all material is larger, enter 0 as the percent
passing.
Checked by
LabSuite includes a USDA chart report showing the textural triangle and the
classifications for a number of soil samples; below the border of the report you
can list the name of a the person who has reviewed the classification data by
entering that person’s name into the Checked by field.
; When printing a USDA chart report that includes multiple soil samples on
a single page, LabSuite will use the "Checked by" name entered for the first
sample placed on the report page.
Copyright 2005-2009 GEOSYSTEM Software, Inc.
http://geosystemsoftware.com/support.htm
66
Soil Classifications
6.5
AS 1726 Classification
Select Window > AS1726 to view the Australian Standard 1726 classification window.
Figure 6.5: AS 1726 Classification Data Entry Window
The AS 1726 data entry fields are identical to those described in the USCS Classification
section.
www.geosystemsoftware.com
LabSuite by GEOSYSTEM Software
7. Entering Moisture-Density Test Data
Data entry for a moisture-density test involves two steps:
• Sample background information, which covers basic information about the sample tested.
• Test data entry, which involves entering the actual compaction test data.
Begin by selecting Test > Enter Proctor Data. The following sections discuss each subsequent data entry step in further detail.
7.1
Moisture-Density Sample Information
The initial moisture-density data entry window covers basic information about the tested
sample. This window is displayed by clicking on the Sample Info. navigation tab, or by selecting
Window > Sample Info. The display is similar to the grain size test sample information window
covered in § 3.1.
7.2
Moisture-Density Test Entry
LabSuite’s moisture-density test data entry window may be viewed by selecting Window
> Test Data or by clicking on the Test Data navigation tab.
Figure 7.1: Moisture-Density Test Data Entry Window
The following subsections cover each section of the data entry window in detail.
67
68
Entering Moisture-Density Test Data
7.2.1
Test Specifics
Figure 7.2: Moisture-Density Test Specifics Box
Curve number
This is an optional item. If entered, the curve number be used as follows:
• It will appear on the test’s printed reports.
• LabSuite will use the number for identifying the soil during the one-point
curve matching process.
• If licensed, the GEOSYSTEM Quality Control - Density (QC-Density) program uses this number as a reference for determining the maximum dry density associated with a particular field density test.
Test specification
Use this box to select the specification used to perform the test (e.g., ASTM D
698 Method A). This selection is important: it determines the sieve used for
denoting oversize material, the oversize correction method, the default test mold
volume, etc.
; If your test’s specification isn’t in the drop-down list, use the program’s test
specification editor to add it before continuing.
Soil specific gravity
This is an optional item that will be reported on hardcopy printouts if entered.
The sample specific gravity is not utilized in any of the program’s calculations.
ZAV curve specific gravity
Several chart report formats offer the option to draw a single zero air voids (ZAV)
curve that represents the upper moisture-density boundary for a saturated soil
at a particular specific gravity. The ZAV curve specific gravity field allows you
to select the specific gravity used in the ZAV curve drawing equation.
; Other chart report formats, such as PRCOE, include three pre-defined ZAV
curves representing specific gravities of 2.6, 2.7 and 2.8. LabSuite ignores
the contents of the ZAV curve specific gravity when one of these formats
are used.
; LabSuite offers prompts for both the sample and ZAV curve specific gravity
so that in situations where a specific gravity test has not been performed on a
sample, the user may estimate the specific gravity for the purposes of drawing
the ZAV curve.
www.geosystemsoftware.com
LabSuite by GEOSYSTEM Software
LabSuite User’s Guide
69
; Entering 0 for the ZAV curve specific gravity or leaving the field blank will
cause the program to omit the ZAV curve from reports featuring a single, user
selected ZAV curve.
7.2.2
Sieve Percentages
Figure 7.3: Moisture-Density Sieve Percentages Box
Percent oversize
For test specifications requiring an oversize material correction, the correction
calculation requires the percent retained on a specific sieve representing the
boundary between the oversize material and the material used for the compaction test. The Percent oversize field should be used to enter the percentage
of material larger than whatever sieve is specified as being the oversize sieve by
the test specification (see § 2.6.3 for details on setting up a new test specification).
Percent smaller than the #200 sieve
This is an optional item that will be reported on hardcopy printouts if entered.
The value is not utilized in any of the program’s calculations.
; If grain size test data have been entered for the sample, the program will automatically obtain the oversize and #200 sieve percentages from the grain size
distribution curve.
7.2.3
Oversize Correction
Figure 7.4: Moisture-Density Oversize Correction Box
Bulk specific gravity
This is the specific gravity (typically the SSD bulk specific gravity) of the oversize
material. You do not need to enter this value if you are not correcting your test
results for the presence of oversize material.
Oversize moisture
This is the moisture content of the oversize material; again, you do not need to
enter this value if you are not correcting your test results for the presence of
oversize material.
Copyright 2005-2009 GEOSYSTEM Software, Inc.
http://geosystemsoftware.com/support.htm
70
Entering Moisture-Density Test Data
7.2.4
Proctor Test Data
Figure 7.5: Moisture-Density Test Data Grid
LabSuite accepts data for up to six moisture-density test points, with one or two moisturecontent evaluations per test point. (Checking the Average two moisture content tests per point
option in the toolbar at the top of the window allows you to enter two moisture contents per test
point: the program averages the results of the two moisture content tests to determine the test point’s
moisture content.) Except in the one-point test case, the program requires a minimum of three test
points, with each point requiring the following data:
Wt. mold+soil
Wt. mold
These fields are used by the program to determine the soil density. Note that the
weights may be entered in either grams or pounds: The Units for mold weights
selection in the toolbar determines which units will be used.
; Because the same mold is normally used for all of the test points, the Wt.
mold entered for the first test point is automatically repeated for the other
test points. If the mold weight does change, a new weight may be entered for
any point.
Mold volume
LabSuite requires the volume of the compaction mold, in either cubic feet or
liters, depending upon the dimension units assigned to the project file on which
you’re working: If you’ve configured the project to use SI units, enter the mold
volumes in liters; for a US unit project, enter your mold volumes in cubic feet.
(To change your project’s dimension units, start your GEOSYSTEM program,
open the project, then select Project > Dimension Units.)
; LabSuite automatically selects a default mold volume based upon the mold
diameter and mold height given for the test specification chosen in the Test
specifics box. The default volume may be changed for any point.
www.geosystemsoftware.com
LabSuite by GEOSYSTEM Software
LabSuite User’s Guide
71
Tare ID
If the option to enter container weights as tare IDs has been selected, data entry
for the moisture content portion of the test begins by selecting an ID from the
drop-down tare ID list. Once an ID is chosen, Tare field will be automatically
filled in with the weight corresponding to that container.
; If you haven’t yet entered the container and its weight into the program’s
container list, see § 2.8 for instructions on adding it. Alternatively, the tare
ID field may be left blank and a tare weight may be manually entered.
Wt. w+t
Wt. d+t
Tare
These are, respectively: the weights (in grams) of the wet soil and container, dry
soil and container and the container by itself.
; If the Average two moisture content tests per point toolbar check box is
selected and data are not available for a second moisture content test, leave
the second moisture content test fields blank; LabSuite will utilize only the
data entered for the first (and only) moisture content test.
; To delete a given test point’s data, click the mouse in one of the test point’s
data entry fields, then select Edit > Delete this Test Point.
Copyright 2005-2009 GEOSYSTEM Software, Inc.
http://geosystemsoftware.com/support.htm
72
Entering Moisture-Density Test Data
7.2.5
California Test Method 216 Test Data
Figure 7.6: CT216 Test Data Grid
For California Test 216 tests, the following data are required:
Tamper reading
Enter the tamper shaft graduation reading here.
Wet wt. of soil
Enter the weight of the soil sample minus the tare weight. Note that the units
used can be toggled between grams and pounds by changing the Units for soil
weights box in the top toolbar.
Water added
Enter the amount of water added or subtracted to the tested sample. (For samples
that have had moisture removed via aeration, enter the amount of water removed
as a negative number.)
; If you’ve selected a test specification that uses the CT-216 with added
moisture content tests test method, the test data grid will also include prompts for entering each sample’s moisture content. See the discussion on entering moisture contents for a standard Proctor test for more information.
www.geosystemsoftware.com
LabSuite by GEOSYSTEM Software
8. Viewing and Modifying the
Moisture-Density Curve
To preview a chart of the test’s moisture-density curve, select Window > Chart or click on
the Chart navigation tab. From this window you can:
• Reshape the moisture-density curve by moving or removing test points from the curve, or
by adding additional points to the curve.
• Choose between two different styles of curves.
• Choose to plot the compaction curve with or without test points, or to omit the curve and
just plot the test points.
• View moisture-density curves entered into the same project that are similar to the current
test’s curve.
• Synthesize a full compaction curve from a single moisture-density test point.
Figure 8.1: Moisture-Density Chart Review Window with One-Point Test Curve Selection Panes
73
74
Viewing and Modifying the Moisture-Density Curve
; The Chart Review window will display both an oversize-corrected and an uncorrected curve if:
– The test data includes oversize information (e.g., % oversize, bulk specific gravity, etc.).
– The specification used by the test includes an oversize correction applied to each
test point instead of applying the correction only to the maximum dry density
and optimum moisture values.
– The test’s specification uses the Report the uncorrected curve in addition to
the corrected curve option.
Otherwise, a single curve will be displayed.
8.1
Toolbar Controls
Figure 8.2: Moisture-Density Chart Review Window Toolbar
The toolbar at the top of the curve preview window contains the following controls:
Plot:
Determines whether the program plots the curve and test points, the curve only,
or the test points only. See § 8.3 for further details.
Data-averaging curve
Selecting this option produces a smoother curve, but one that doesn’t necessarily
pass directly through every test point. Refer to § 8.3 for further details.
Similar Curves
Clicking this button causes the program to display moisture-density curves from
the same project that have maximum dry density/optimum moisture contents
close to the current test’s maximum dry density and optimum moisture.
; The button is disabled for one-point tests because the program always shows
the similar curves for these tests.
"+" and "-" buttons
Clicking on the "-" button increases the moisture and density scale steps (i.e.,
the chart is zoomed out), while the "+" button decreases the scale steps (i.e.,
the chart is zoomed in).
www.geosystemsoftware.com
LabSuite by GEOSYSTEM Software
LabSuite User’s Guide
8.2
75
Reshaping the Curve
You can change the shape of the compaction curve by adding shaping points (additional curve
points added merely to force the curve to pass through a particular moisture/density location), moving
test points or by choosing to omit test points generated from bad data, as shown in the following
examples:
Figure 8.3: Original Moisture-Density Curve
Figure 8.4: Same Test Data; Added Shaping Point and Moved and Omitted Data Points
Copyright 2005-2009 GEOSYSTEM Software, Inc.
http://geosystemsoftware.com/support.htm
76
Viewing and Modifying the Moisture-Density Curve
To reshape the curve by adding a shaping point:
The shape of the curve may be adjusted by forcing it to pass through a new point.
To do this, select Curve then either Shape Curve (if the window shows a single
curve) or Shape Corrected Curve or Shape Uncorrected Curve. Next, move the
mouse cursor to the location desired for the curve to pass through, then click the
left mouse button. The new point will be marked with a "+", which will not be
shown on charts included on hardcopy reports.
To remove a shaping point:
Move the mouse cursor over the shaping point, then click the right mouse button
and select Delete this Point from the popup menu.
You can also remove all shaping points by selecting Curve > Delete All Shaping
Points.
To move a shaping point:
Once you’ve placed a shaping point you can move it: Place the mouse cursor
over the shaping point, click the right mouse button and select Move this Point.
Move the mouse cursor to the desired position for the shaping point then click
the left mouse button.
; Shaping points cannot be added to data-averaged curves.
You can also reshape the curve by moving or hiding test points:
To move a test point:
Move the cursor over the test point then click the right mouse button and select
Move this Point, then move the mouse cursor to the desired position for the test
point then click the left mouse button.
; Note that the test point itself will continue to be shown in its original position, although the compaction curve will no longer pass through it. If you do
not want to have the test point shown on the chart, use the procedure covered
below.
To omit a test point from the chart:
Sometimes it may be necessary to remove a test point from the compaction chart
because the testing data for the point is obviously not correct. To remove the
point from the chart, move the mouse cursor over the bad point, right-click and
select Include this Point on Curve to uncheck the option. (The point will still
show up on the chart review window and on data summary reports, but it will
not appear on chart reports.)
If the test point’s data appears to have been entered incorrectly, the data can be corrected by
moving the mouse cursor over the test point, then right-clicking and selecting Edit this Point’s Data.
www.geosystemsoftware.com
LabSuite by GEOSYSTEM Software
LabSuite User’s Guide
8.3
77
Changing How the Curve is Displayed
LabSuite includes several options for changing how the compaction curve is plotted:
You can omit the curve from chart reports:
If your compaction curve cannot be modified into an acceptable shape you can
choose to have LabSuite plot just the test points, omitting the curve. (You can
then draw the curve by hand on the hardcopy report.) To omit the curve, select Curve > Plot Test Points Only. Note that this option also causes the calculated maximum dry density and optimum moisture values to be omitted from
the report (you’ll need to work out your own values based upon the curve you’ve
hand-drawn).
You can omit the test points from chart reports:
Selecting Curve > Plot Curve Only omits the test points from the chart, leaving
only the curve.
The compaction curve can be plotted using a data-averaging curve model:
If your test data doesn’t form a smooth compaction curve, Curve > Data-Averaging
Curve can be used to draw a compaction curve formed using a least-squares linear regression mathematical model. In simplified terms, these curves average the
distance between the curve and each test point, making for a smoother curve, but
one that may not actually pass directly through each test point. As an example,
the following figure shows a compaction curve that’s somewhat oddly-shaped
because the points on the wet side of the curve do not make a smooth curve:
Figure 8.5: Moisture-Density Curve Drawn Using the Default Curve Plotting Method
Copyright 2005-2009 GEOSYSTEM Software, Inc.
http://geosystemsoftware.com/support.htm
78
Viewing and Modifying the Moisture-Density Curve
Selecting the Data-Averaging Curve option produces a smoother curve shape:
Figure 8.6: Moisture-Density Curve Drawn Using the Data Averaging Method
Note that the second curve does not exactly pass through each test point: For the
top two points on the wet side of optimum moisture, the curve essentially "splits
the difference" between the two points by passing on the right side of one and
on the left side of the second. The resulting curve appears smoother.
; The data-averaging curve model is not a panacea for cleaning up all misshapen curves. Some curves may benefit more by moving test points, removing bad data points from the curve, or by adding curve shaping points.
Additionally, curves with five or six test points do not tend to plot very well
using the data-averaging approach.
www.geosystemsoftware.com
LabSuite by GEOSYSTEM Software
LabSuite User’s Guide
8.4
79
Creating Curves for One-Point Tests
LabSuite supports a simplified version of the AASHTO Family of Curves test method (T
272). The program may be used to match up the single test point of a one-point compaction test
against the closest already-entered compaction curves above and below the point: a new curve passing
through the single test point is synthesized from a combination of the two existing curves.
Figure 8.7: One-Point Test with Extrapolated and Matching Curves
LabSuite’s one-point curve generation differs from the AASHTO standard in that the program only takes into account one curve above and one curve below the test point, while the standard
requires that the behavior of an entire family of curves be accounted for when extrapolating the new
curve.
To create a curve for a one-point test, begin by entering the data for the single test point, then
select Window > Chart. When the Chart Review window is displayed, a pane will be added to the
left-hand side listing compaction curves above and below the test point.
Copyright 2005-2009 GEOSYSTEM Software, Inc.
http://geosystemsoftware.com/support.htm
80
Viewing and Modifying the Moisture-Density Curve
Figure 8.8: One-Point Match Curves Pane
; Curves are ordered in the list by how close they are to the single test point.
The pane includes two lists of curves: one list contains curves that fall above the one-point
test and the other list contains curves that fall below the one-point test. Clicking on the checkbox for
one curve from each list causes the program to synthesize a curve passing through the test point and
roughly matching two match curves.
; The synthesized curve can be erased by unchecking the curve selections in the
Curves above the test point and Curves below the test point boxes.
; If oversize moisture or density corrections are applied, the test specifications used
by both the match curves and the one-point test curves should use identical settings for the Correct correction application test specification setting.
www.geosystemsoftware.com
LabSuite by GEOSYSTEM Software
9. Reporting Your Data
LabSuite features three methods for reporting your data:
XML Files
XML files contain a listing of both your raw testing data (such as the weights
retained on each sieve during a grain size sieve test), as well as various values
calculated by the software such as D10 , Cu , etc. XML files are saved on-disk
and may be viewed by a web browser or by versions of Microsoft Excel newer
than Excel2000. This is an ideal format for e-mailing testing data and results to
your clients in a format that incorporates both a means of presentation (through
a web browser) as well as a means of manipulating the raw data (through a
spreadsheet).
Data Summary Reports
Summary reports list the raw data taken from your test. They may be sent to a
printer or saved on disk.
Chart Reports
Chart reports are more formalized than summary reports: for example, a grain
size chart report typically includes, in addition to a chart of particle size vs.
percentage, a block listing your company name, along with tables listing various
calculated percentages and other values. Unlike summary reports, chart reports
do not list raw testing data such as the weight retained on each sieve.
; Another difference between chart and summary reports is that LabSuite
ships with several different chart reports from which you can select, while
there’s only one format for the summary report.
; Chart and summary reports can be saved to a file in .PDF, .EMF, .PNG or .DXF
format.
; Through the Windows clipboard, you can also export chart reports to programs
that can paste pictures into their documents (such as word processors or paint
programs). To do this, select Edit > Copy Entire Test: once on the Windows
clipboard, you can paste the chart into, for example, a word processing document
by starting the word processor and selecting Edit > Paste.
81
82
Reporting Your Data
9.1
Chart Reports
Chart reports may be reviewed and printed by selecting Window > Reports (Window > USDA
Reports to view the USDA chart report), or by clicking on the Reports navigation tab. From this window you can:
• Combine tests from several samples onto a single report page.
• Change a report page’s figure number.
• Select a different format for printing chart reports.
• Preview and print chart and summary reports.
Figure 9.1: The Report Preview Window
On the left side of the screenshot is a box listing the LabSuite chart report pages that have
been set up for the current project: each sample tested will be shown on one of these pages. Some
chart report formats can support printing more than one sample’s test on a single page (for example,
each page in the screenshot supports up to 5 tests – one page in the sample is currently set up to print
three tests (Boring B-3, samples S-1, S-2, and S-3) and the other holds two tests from Boring B-4).
; Tests shown in gray will not be printed on the report because the report form that
you’ve selected does not have room for them. (This happens when you create a
page with, e.g., 5 tests, and then change to a report format that has room for, say,
a single test per page.) You should drag these tests onto a different page or
move them to their own report page; otherwise they will never print. (If
you click on the Auto. Combine button, the program will fix the problem for
you.)
www.geosystemsoftware.com
LabSuite by GEOSYSTEM Software
LabSuite User’s Guide
83
Following is a list of actions that you can take from this window:
You can move tests from one page to another
The program adds a new report page to the list for every test that you enter. So,
after you’ve entered all of your project’s tests, you’ll have a list of report pages,
with one test on each page. Since most report LabSuite report formats can show
more than one test on a single page, you may want to combine several tests onto
one report page. To do this, drag the test (such as, e.g., the Boring B-4,S-1
test in the screenshot) from its own report page and drop it on another page.
You can have the program automatically combine tests onto report pages
Rearranging tests onto different report pages can be tedious...fortunately, computers excel at tedious tasks! If you click on the Auto. Combine button, LabSuite will try to combine as many tests onto a single report page as possible,
with one caveat: LabSuite will only combine tests onto a single page if they
were taken from the same material source.
You can assign a figure number to a report page
Each report page can list a figure number. To set a page’s figure number, click in
the underlined area next to the word Figure at the top of the report page in the
left-hand list, then type in your figure number.
You can move a test onto its own report page
To do this, drag the test off of its current report page onto the yellow area at the
left side of the screen (i.e., drop the test anywhere but on another report page).
You can move a test into a new position on the report page
Drag and drop the test to a higher or lower position on its current report page in
the page list.
You can change the format of the report pages
The software ships with many different chart report formats that you can use
for printing your test data. (You can view samples of all of the program’s report
formats by clicking on the Preview Forms button.) To select a new report
format, click on the button shown in the following figure:
Figure 9.2: Selecting a Chart Report Form
Copyright 2005-2009 GEOSYSTEM Software, Inc.
http://geosystemsoftware.com/support.htm
84
Reporting Your Data
9.1.1
Selecting a Scale for Moisture-Density Reports
You can alter the moisture and density scale used on a specific moisture-density chart report
by previewing the report then selecting Report > Chart Report Scale. Doing so brings up the moisturedensity chart scaling dialog shown below:
Figure 9.3: Moisture-Density Chart Scale Dialog
This dialog lets you change the start and increment for the scales used on the moisturedensity graph included on the report that you’re currently previewing. The choices you make on this
dialog do not affect the moisture-density curve preview window, nor do they affect the small chart
shown on the test’s data summary report. Any changes made using this dialog affect only the test
report page that you’re previewing when Report > Chart Report Scale is selected.
Scale step
The moisture and density Scale step box lets you select the distance (in percentage and units of density) between scale labels on the chart.
Scale start
The Scale start box selects a value for the left side of the moisture content scale
and the bottom of the density scale.
Reset
Clicking on this button resets both moisture and density scales to the program’s
default selection.
www.geosystemsoftware.com
LabSuite by GEOSYSTEM Software
LabSuite User’s Guide
85
; If the currently selected report format includes three zero air voids (ZAV) curves
at specific gravities of 2.6, 2.7 and 2.8, the program will reserve some space immediately to the right of the 2.8 ZAV curve in order to display information on
the project and test specification. (The preceding screen shot shows the reserved
area, labeled "This area reserved for project data".) This reserved area places
some constraints on the scale that you choose because some combinations of density and moisture scale starts and scale steps would not leave enough room for
the program to display the right-hand project and test specification information.
If you adjust the chart scale so that the 2.8 ZAV curve runs through the hashed
"This area reserved for project data" area, clicking the OK button causes the program to shift your scale so that the hashed area is no longer intersected by the
ZAV curve; you will then need to click OK a second time to exit the dialog.
9.1.2
Printing Your Reports
After you’ve arranged your tests onto report pages you can preview or print each page: Locate
and click on the page in the page list shown in the yellow box on the left side of the screen then select
Test > Output Chart Report. You’ll be presented with the printer settings dialog:
Figure 9.4: Printer Output Settings Dialog
Print Settings
Click this button to select a different printer or to change the printer’s page size,
resolution, etc.
Print
Click this button to print your report.
Copyright 2005-2009 GEOSYSTEM Software, Inc.
http://geosystemsoftware.com/support.htm
86
Reporting Your Data
9.1.3
Selecting a Chart Report Format
You can view samples of the report forms shipped with the program by clicking on the Preview Forms button. Browse through the forms by clicking on the left and right arrow buttons in the
toolbar; when you’ve settled on a new report format, click on the Select this Format button.
; If you’d like printed samples of all of the report formats shipped with the program,
click on the Print Samples button.
Figure 9.5: Selecting a Chart Report Form
www.geosystemsoftware.com
LabSuite by GEOSYSTEM Software
LabSuite User’s Guide
9.2
87
Data Summary Reports
Data summary reports list the raw data taken from a single lab. test (e.g., specimen weights,
test readings, etc.). You can print a summary report or export it to a file by selecting Test > Output
Data Summary Report.
; The Classifications screens (i.e., ASTM, AASHTO, USDA, etc.) do not generate
data summary reports.
Figure 9.6: First Page of a Sample Summary Report
Copyright 2005-2009 GEOSYSTEM Software, Inc.
http://geosystemsoftware.com/support.htm
88
Reporting Your Data
9.3
Exporting Reports To Files
You can save LabSuite’s testing data summary and chart reports for posting to a web server
or for e-mailing to clients. The program supports several different export formats:
• Adobe Acrobat .PDF: Universal format for Internet document distribution. Requires the
Adobe Reader program to display the files.
• AutoCAD .DXF: Format for interchange among CAD programs.
• Windows Metafile (.EMF): These files can be inserted as a picture into a word processing
document or manipulated with a vector-drawing program such as Adobe Illustrator.
• Portable Network Graphics (.PNG) and JPEG File (.JPG): These files are "bitmap" files
that can be inserted into word processing documents or edited with a raster-drawing program such as Windows Paint or Photoshop.
To save a chart or summary report as a file, select either Test > Output Data Summary
Report or Test > Output Chart Report, then, from the Output to box on the next dialog, select one
of the file formats outlined above.
If you’ve chosen the Adobe Acrobat .PDF File, Windows Metafile (.EMF), Portable Network Graphics (.PNG) or JPEG File (.JPG): options you’ll see the following dialog:
Figure 9.7: .PDF, .EMF, .PNG and .JPG Output Settings Dialog
.DXF files are somewhat more complicated: if you select the AutoCAD .DXF File you’ll see
this dialog:
www.geosystemsoftware.com
LabSuite by GEOSYSTEM Software
LabSuite User’s Guide
89
Figure 9.8: .DXF Output Settings Dialog
There are a number of options available for selecting where and how the reports are generated:
Base file name
When the program creates a file from one page your report (for .DXF, .EMF,
.PNG and .JPEG files), or from your entire report (for .PDF files), the file’s name
will start with whatever is entered into this field.
Select an appropriate ending for this filename
Without this option, the names of the files created will be whatever you have
selected as the Base file name. Checking the Select an appropriate ending
for this filename box alters how the program names the report files: the sample number and/or sampling location is added to the Base file name, followed
by the test type ("GS" or "LM" etc.) and either "ChartReport" or "TestData".
For example, with the Select an appropriate ending for this filename box
checked, the program may create .PDF files with names like:
P92321 Sample S-4 Boring B-3 GS TestData.PDF
P92321 Sample S-1 Test Pit TP-2 GS ChartReport.PDF
etc.
; With Base file name and Select an appropriate ending for this filename
you can come up with some useful file naming variations. For example, you
could leave Select an appropriate ending for this filename unchecked and
enter the sample number/location as part of the Base file name - of course,
this means that when you export the next report, you’d have to change the
Base file name to reflect the new sample number.
As another example, if you have created a hard disk subdirectory just to hold
Copyright 2005-2009 GEOSYSTEM Software, Inc.
http://geosystemsoftware.com/support.htm
90
Reporting Your Data
.PDF files from a certain project, you may not need to include the project
number as part of each .PDF file name: instead of being called, for example,
P92321 Sample S-4 Boring B-3.
(P92321 being the project number), by leaving the Base file name field
blank you can get export files with names like Sample S-4_Boring B-3.PDF
Place files in
Sets the directory where your exported files will be placed.
Report is on letter-sized paper (.PDF, .EMF and .PNG files only)
Report is on A4 paper (.PDF, .EMF and .PNG files only)
Selects the paper size to be used for the exported report image.
Report is scaled in inches (.DXF files only)
Report is scaled in centimeters (.DXF files only)
Reports exported as CAD files either measure either 10 units vertically (when
scaled in inches) or 25.4 units vertically (when scaled in centimeters). This
selection does not affect the report’s appearance; rather, it just affects the coordinates given to each line and piece of text on the report. (As such, the selection
is only important when the exported report is to be edited by an illustration or
CAD program.)
Binary (.DXF files only)
Binary .DXF files will be smaller (by 25 to 50 percent) and open faster in AutoCAD. The reports will appear the same when viewed in a CAD program no
matter if this option is selected or not. Note that very few illustration programs
will read binary .DXF report files.
TrueType (.DXF files only)
If this option is unselected, .DXF report files use a monospaced font (similar
to this) for everything on the form, meaning that .DXF reports are less attractive than their printed counterparts. The TrueType option allows you to generate .DXF files that look exactly like the printed versions – however, TrueType
.DXF files are only supported on AutoCAD versions 14 and newer; additionally,
many other drawing and CAD programs do not support TrueType files.
Layer name (.DXF files only)
Specifies the name of the CAD drawing layer on which your report will be drawn.
Layer names may be any combination of alphabetic and numeric characters –
however, many CAD programs cannot handle layer names that include spaces.
(MYLAYER is OK, MY LAYER is not.) Since your chosen layer name will be
repeated throughout the .DXF report files, the shorter you make the name the
smaller in size your .DXF files will become.
www.geosystemsoftware.com
LabSuite by GEOSYSTEM Software
LabSuite User’s Guide
9.4
91
Exporting XML Files
The XML file format provides a means of exporting your testing data and calculated test
results into a format readable by a web browser and by newer Excel spreadsheet programs (XP or
later). This makes XML files a natural method for posting testing results to a Web or FTP site or for
e-mailing directly to clients.
To export an XML file, select Test > Export XML File
Figure 9.9: Portion of an XML Report Viewed in Internet Explorer
9.5
Listing the Results From Multiple Tests
The Data Summary and Export tool discussed in Chapter 4 of the GDM manual and Appendix C of the LD4 User’s Guide may be used to summarize the results of multiple lab. tests. Several
stock configuration files can be used by selecting Tools > Data Summary and Export from the GDM
or LD4 menu, then selecting File > Recall Existing Configuration and selecting one of the listed
configuration files:
• To list grain size distribution test results, select GSFRACS.LFG or GSFRACS2.LFG
• To list Atterberg limits test results, select LIMSUM1.LFG
; If you’ve purchased LD4, you can use the configuration files to view an on-screen
list of the tests performed for a project: From the LD4 screen, select Project
> Browse and choose one of the listed configuration files.
Copyright 2005-2009 GEOSYSTEM Software, Inc.
http://geosystemsoftware.com/support.htm
92
Reporting Your Data
9.5.1
Grain Size Test Results Calculated by the Program
As an alternative to using the stock GSFRACS.LFG and GSFRACS2.LFG summary and
export files, you can also create your own summaries with data values calculated by the program.
These values (or "variables") can also be referenced in boring logs created with the GEOSYSTEM
LOGDRAFT program.
The following table lists the names of all of the calculated grain size variables provided by
LabSuite and gives a short description of each variable.
Table 9.1: Grain Size Test Results for Summaries and Boring Logs
Item Name
GS_CC
GS_CC
GS_CU
FINENESSMOD
D95, D90, D85, D80, D60,
D50, D30, D20, D15 and D10
DIDMECH
DIDHYD
PER6IN
PER5IN
PER4IN
PER3IN
PERTWO5
PER2IN
PERONE5
PERONEANDQUARTER
PER1IN
PERTHREEQ
PERFIVEEIGHT
PERHALFIN
PER375
PERFIVESIXTEEN
PERONEQ
www.geosystemsoftware.com
Description
Provides the coefficient of curvature
Provides the coefficient of curvature
Provides the coefficient of uniformity
Fineness modulus
Provides the material diameter at which 95, 90, 85, 80, 60,
50, 30, 20, 15 and 10 percent of the material is smaller.
"Y" if a mechanical test was performed on the sample. This
is useful for counting the number of mechanical tests performed.
"Y" if a hydrometer test was performed on the sample.
Percent of material smaller than 6 inches.
Percent of material smaller than 5 inches.
Percent of material smaller than 4 inches.
Percent of material smaller than 3 inches.
Percent of material smaller than 2.5 inches.
Percent of material smaller than 2 inches.
Percent of material smaller than 1.5 inches.
Percent of material smaller than 1.25 inches.
Percent of material smaller than 1 inch.
Percent of material smaller than 3/4 inches.
Percent of material smaller than 5/8 inches.
Percent of material smaller than 1/2 inch.
Percent of material smaller than 3/8 inches.
Percent of material smaller than 5/16 inches.
Percent of material smaller than 1/4 inch.
Continued on the next page
LabSuite by GEOSYSTEM Software
LabSuite User’s Guide
93
Item Name
PER4, PER5, PER6, PER7,
PER8, PER10, PER12,
PER14, PER16, PER18,
PER20, PER25, PER30,
PER35, PER40, PER45,
PER50, PER60, PER70,
PER80, PER100, PER120,
PER140, PER170, PER200,
PER230, PER270, PER300,
PER325, PER400
PER074MM
PER005MM
PER001MM
GS_SPECENV
Description
Provides the calculated percentage passing various standard
sieve sizes: for example PER4 provides the percent passing
the #4 sieve.
Percent of material smaller than .074 mm.
Percent of material smaller than .005 mm.
Percent of material smaller than .001 mm.
Gives the name of the specification envelope selected for the
test.
SI sieve tests export the following results:
PER200MM Percent of material smaller than 200 mm.
PER75MM Percent of material smaller than 75 mm.
PER53MM Percent of material smaller than 53 mm.
PER37.5MM Percent of material smaller than 37.5 mm.
PER26.5MM Percent of material smaller than 26.5 mm.
PER19MM Percent of material smaller than 19 mm.
PER13.2MM Percent of material smaller than 13.2 mm.
PER9.5MM Percent of material smaller than 9.5 mm.
PER6.7MM Percent of material smaller than 6.7 mm.
PER4.75MM Percent of material smaller than 4.75 mm.
PER2.36MM Percent of material smaller than 2.36 mm.
PER1.18MM Percent of material smaller than 1.18 mm.
PER.6MM Percent of material smaller than .600 mm.
PER.425MM Percent of material smaller than .425 mm.
PER.3MM Percent of material smaller than .3 mm.
PER.15MM Percent of material smaller than .15 mm.
PER.075MM Percent of material smaller than .075 mm.
Each classification system selection such ASTM D 2487, Burmister and Wentworth also makes additional values available, such as the percentage of sand, silt and clay. Which values are calculated
depends upon the classification system you’ve chosen: For example, the Wentworth classification defines a Very Coarse Sand particle size, while the USCS classification does not, so, if you select the
USCS classification system when entering a grain size test you will not be able to summarize the percentage of Very Coarse Sand. The table below lists definitions for all of the possible particle size
ranges, while the table after lists which size ranges are defined for each of the supported classification
systems.
Copyright 2005-2009 GEOSYSTEM Software, Inc.
http://geosystemsoftware.com/support.htm
94
Reporting Your Data
Table 9.2: Particle Size Ranges
Item Name
BOULDER
COBBLES
PEBBLE
GRANULE
COARSE_GRAVEL
MEDIUM_GRAVEL
FINE_GRAVEL
GRAVEL
VCOARSE_SAND
COARSE_SAND
MEDIUM_SAND
FINE_SAND
VFINE_SAND
SAND
COARSE_SILT
MEDIUM_SILT
FINE_SILT
SILT
CLAY
FINES
COLLOIDS
Description
Boulders
Cobbles
Percentage of pebbles (Wentworth classification only)
Percentage granules (Wentworth classification only)
Coarse gravel
Medium gravel
Fine gravel
Total gravel percentage.
For USDA, GRAVEL =
COARSE_GRAVEL
plus
MEDIUM_GRAVEL
plus
FINE_GRAVEL; for USCS, GRAVEL is COARSE_GRAVEL
plus FINE_GRAVEL (because USCS does not define a
"medium gravel" size range)
Very coarse sand
Coarse sand
Medium sand
Fine sand
Very fine sand
Total sand percentage
Coarse silt
Medium silt
Fine silt
Total silt percentage
Percentage of material smaller than silt
Percentage of material smaller than sand
Percentage of fine clay
Table 9.3: Size Ranges Supported by Classification System
Classification System
USCS
USCS with .002mm. instead
of .005 silt/clay division
USCS without
coarse/medium/fine divisions
USCS, lists fines instead of
silts/clay
AASHTO
www.geosystemsoftware.com
Supported Range Values
COBBLES, COARSE_GRAVEL, FINE_GRAVEL, GRAVEL,
COARSE_SAND, MEDIUM_SAND, FINE_SAND, SAND,
SILT, CLAY, FINES, COLLOIDS
same as USCS
COBBLES, GRAVEL, SAND, SILT, CLAY, FINES, COLLOIDS
COBBLES, COARSE_GRAVEL, FINE_GRAVEL, GRAVEL,
COARSE_SAND, MEDIUM_SAND, FINE_SAND, SAND,
FINES, COLLOIDS
COBBLES, GRAVEL, COARSE_SAND, FINE_SAND,
SAND, SILT, CLAY, FINES, COLLOIDS
Continued on the next page
LabSuite by GEOSYSTEM Software
LabSuite User’s Guide
95
Classification System
Wentworth
Burmister
USDA
USDA, #270 sand/silt
division instead of .05mm.
Australian Sandard AS 1726
Canadian Soil Information
System 1982
ISSS
British Sandard 5930
Supported Range Values
BOULDER,
COBBLES,
PEBBLE,
GRANULE,
VCOARSE_SAND, COARSE_SAND, MEDIUM_SAND,
FINE_SAND, VFINE_SAND, SAND, COARSE_SILT,
MEDIUM_SILT, FINE_SILT, VFINE_SILT, SILT, CLAY
COBBLES,
COARSE_GRAVEL,
MEDIUM_GRAVEL,
FINE_GRAVEL,
GRAVEL,
COARSE_SAND,
MEDIUM_SAND, FINE_SAND, SAND, FINES
BOULDER,
COBBLES,
COARSE_GRAVEL,
MEDIUM_GRAVEL,
FINE_GRAVEL,
GRAVEL,
VCOARSE_SAND, COARSE_SAND, MEDIUM_SAND,
FINE_SAND, VFINE_SAND, SAND, COARSE_SILT,
FINE_SILT, SILT, CLAY
same as USDA
BOULDER,
COBBLES,
COARSE_GRAVEL,
MEDIUM_GRAVEL,
FINE_GRAVEL,
GRAVEL,
COARSE_SAND, MEDIUM_SAND, FINE_SAND, SAND,
COARSE_SILT, MEDIUM_SILT, FINE_SILT, SILT, CLAY
BOULDER,
COBBLES,
COARSE_GRAVEL,
MEDIUM_GRAVEL,
FINE_GRAVEL,
GRAVEL,
VCOARSE_SAND, COARSE_SAND, MEDIUM_SAND,
FINE_SAND, VFINE_SAND, SAND, SILT, CLAY, COLLOIDS
COBBLES, GRAVEL, COARSE_SAND, FINE_SAND,
SAND, SILT, CLAY
BOULDER,
COBBLES,
COARSE_GRAVEL,
MEDIUM_GRAVEL,
FINE_GRAVEL,
GRAVEL,
COARSE_SAND, MEDIUM_SAND, FINE_SAND, SAND,
COARSE_SILT, MEDIUM_SILT, FINE_SILT, SILT, CLAY
Copyright 2005-2009 GEOSYSTEM Software, Inc.
http://geosystemsoftware.com/support.htm
96
Reporting Your Data
9.5.2
Atterberg Limits Test Results Calculated by the Program
The following table lists the names of all of the calculated Atterberg limits variables provided
by LabSuite.
Table 9.4: Atterberg Test Results for Summaries and Boring Logs
Item Name
LL
PL
PI
LL_OVEN
NM
LI
9.5.3
Description
Liquid limit
Plastic limit
Plasticity index
Oven-dried liquid limit
Natural moisture
Liquidity index
Soil Classification Results Calculated by the Program
The following table lists the names of all of the calculated soil classification variables provided
by LabSuite.
Table 9.5: Calculated Soil Classification Values
Item Name
USCS
STRATA_DESC
AASHTO
AS1726
USDA
USDA_SANDFRAC
USDA_SILTFRAC
USDA_CLAYFRAC
BURMISTER
BURMSYM
PCPriComp
PIBURM
THREADBURM
COLORBURM
SHAPEBURM
OTHERBURM
www.geosystemsoftware.com
Description
ASTM D 2487 (USCS) soil classification
D 2487 group name
AASHTO M 145 soil classification
Australian standard 1726 soil classification
USDA soil classification
USDA calculated sand fraction
USDA calculated silt fraction
USDA calculated clay fraction
Burmister soil identification
Burmister soil symbol
Burmister primary component
Burmister overall plasticity index
Burmister thread diameter
Burmister soil color
Burmister grain shape
Burmister misc. material characteristics
LabSuite by GEOSYSTEM Software
LabSuite User’s Guide
9.5.4
97
Moisture-Density Results Calculated by the Program
The following table lists the names of all of the calculated moisture-density variables provided
by LabSuite:
Table 9.6: Calculated Moisture-Density Values
Item Name
PRCURVENO
MAXDENS
OPTMOIST
CORRMAXDENS
CORROPTMOIST
PRTEST_SPEC
PROVSPER
OVSPG
OVSMOIST
SPECGR
9.6
Description
Curve number
Maximum dry density (uncorrected for oversize material)
Optimum moisture content (uncorrected for oversize material)
Maximum dry density (corrected for oversize material)
Optimum moisture content (corrected for oversize material)
Test specification name
Percentage of material larger than the oversize sieve
Bulk specific gravity
Oversize material moisture content
Sample specific gravity
Technical Documentation
In the past each GEOSYSTEM program manual concluded with a chapter covering (in great
detail) the methods used by the program to calculate each test result. This had the effect of making
the manual thicker and thus more threatening looking to the casual user. To combat this perception
(and to save paper), we’ve moved the documentation chapters to our web site.
• Grain size calculations are documented here:
http://geosystemsoftware.com/products/gs4/downloads/gs4calculations.pdf
• Atterberg limits calculations are documented here:
http://geosystemsoftware.com/products/clsuite4/downloads/limits4calculations.pdf
• Moisture-density calculations are documented here:
http://geosystemsoftware.com/products/pr4/downloads/pr4calculations.pdf
Copyright 2005-2009 GEOSYSTEM Software, Inc.
http://geosystemsoftware.com/support.htm
Reporting Your Data
www.geosystemsoftware.com
98
LabSuite by GEOSYSTEM Software
Index
(Default opening sizes), 18
+3", 16
+75mm, 16
.DXF, 81, 88–90
.EMF, 81, 88–90
.PDF, 2, 9, 12, 81, 88–90
.PNG, 81, 88–90
#200, 2, 16, 69, 92
#200 wash, 42
« omit », 54
"Standard" Liquid Limit Test, 56
10 percent (D10), 60
151H/152H, 52
30 percent (D30), 60
60 percent (D60), 60
A4, 12
AASHTO M 145, see ASTM D 3282
AASHTO material specifications, 20, 39
AASHTO T 11, 1
AASHTO T 180, 1–2
AASHTO T 224, 1–2
AASHTO T 27, 1, 15–16
AASHTO T 272, see one-point compaction test
AASHTO T 89, 1, 23
AASHTO T 99, 1–2
Add the group name to your soil description, 61
Add the ID or symbol to your soil description, 64
Adobe Acrobat, see .PDF
aggregate, 15
AS 1141.11 and 1141.12, 1
AS 1289.3.x.1, 1, 23
AS 1726, 1–3, 10, 22, 66, 96
ASTM C 117, 1
ASTM C 136, 1, 15–16
ASTM D 1140, 1
ASTM D 1557, 2, 29
ASTM D 2487, 1–3, 10, 22, 36, 38, 56, 59–61
ASTM D 3282, 1, 10, 22, 62, 96
ASTM D 422, 1–2, 21, 48, 50–52
ASTM D 4318, 1, 23, 56–58
ASTM D 4718, 1–2
ASTM D 698, 1–2, 5, 26, 29, 68
ASTM material specifications, 20, 39
Atterberg limits, 1, 56–62
entering test data, 55
Auto. Combine, 82
AutoCAD, 81, 88–90
automatic correction, 51
Automatically export USDA chart reports as .PDF files, 24
Average two moisture content tests per point, 70, 71
Base file name, 89
Binary, 90
Bindery, 12
blows, 57
Blows per layer, 31
Blows scale maximum value, 22
blows vs. moisture chart, 22
Borderline soil type, 60
boring log, 2, 5, 36, 92, 94
bottom margin, 8
bulk specific gravity, see specific gravity: bulk
Burmister, 1, 3, 10, 38, 63–64, 95–96
calculated diameter sizes, 2–3, 16, 92
calculated values, 16
Calculator, 54
California Test Method 216, see CT-216
Cc, 2, 53–54, 92
chart
particle size scale captions, 3, 13
particle size scales, 13
previewing the compaction chart, 73–80
previewing the particle size chart, 53–54
specification envelope on, 14
type of particle size chart, 3, 14
width of curves on, 14, 25
chart report
’checked by’ on, 10, 36
’tested by’ on, 4, 10, 36
copying to the clipboard, 81
defined, 81
disclaimer on, 4, 9
exporting to a word processor, 81
figure number on, 82, 83
fineness modulus on, 15
format of, 83, 86
how to print, 81, 85
in .PDF format, 9, 12, 88–90
in color, 3, 9
margins on, 8
print settings, 88–90
selecting a chart scale, 84–85
tests on, 83
title of, 15, 22, 24–25
type of chart particle size chart on, 14
Chart Report Scale, 84–85
Chart style, 14
Chart to include on the report, 22
checked by, see chart report: ’checked by’ on, 65
Classification system, 38
Clay, 64
clipboard, 4, 81
coarse, 38
cobbles, 16
coefficient of concavity, see Cc
coefficient of curvature, see Cc
99
100
Index
coefficient of uniformity, see Cu
Color, 64
color, 3, 8–9
compaction curve, see moisture-density curve
compaction test, see moisture-density
composite correction, 51
configuration, see settings
Connect test points with lines instead of curves, 14
container, see tare weight
Container ID, 3, 8, 34, 51
Container weights are entered as, 8, 34, 51
Control Panel, 8
Copy Entire Test, 81
Create .PDF pages in A4 page size, 12
CT-216, 1–2, 29, 72
Cu, 2, 53–54, 92
Cumulative Pan Tare Weight, 44
cumulative pan weight, 43
cumulative weight retained, 2, 36, 44, 46
curve
calculating values from, 54
for two point tests, 14
in color, 9
shaping, 2
shaping the moisture-density curve, 75–76
shaping the particle size curve, 53–54
with straight lines, 14
Curve number, 68, 97
Curve width, 14, 25
D10, D20, D30, etc., see calculated diameter sizes
data summary report, see summary report
Data-averaging curve, 77–78
Delete Data Row, 48
Delete the Selection List, 41
Delete this Test Point, 71
Denote point of max. dens./opt. moist. on charts, 26
density
entering test data for, 70
oversize correction, 30
units, 27
Density units, 27
description, see material description
diameter^0.45, 14, 54
disclaimer, see chart report: disclaimer on
Do not plot curves for tests with two points, 14
Draw extrapolated one-point curves on chart reports, 25
Draw one-point test match curves on chart reports, 25
Drop ’Checked by’ from reports, 10
Drop ’Tested by’ from reports, 10
Dry Sample and Tare, 43
DXF, see .DXF
Effective depth equation, 52
EMF, see .EMF
envelope, see specification envelope
Excel, see xml files
export, 4, 81, 91
www.geosystemsoftware.com
Export XML File, 91
exporting files, 12
f.m., see fineness modulus
field density, see Quality Control - Density
figure number, see chart report: figure number on
filter media, 4, 32
fineness modulus, 2, 15, 53–54, 92
Grain shape, 64
Granular, 64
Hammer drop, 31
Hammer wt., 31
help, see technical support
Highly organic soil, 62
hydrometer
entering test data, 35, 50–52
readings, 52
reported percentages, 16
type of, 52
Hydrometer reading at 20 C., 51
hygroscopic moisture, 34, 51
If you washed the sample over a #200 sieve..., 42
Include a disclaimer, 9
Insert at the Cursor, 64
Insert Data Row, 48
Insert Group Name at the Cursor, 61
Insert ID, 64
Insert symbol, 64
International Slurry Surfacing Association, 20, 39
ISSA, see International Slurry Surfacing Association
Label sample description, 15
Larger than 3in., 60, 62, 63
Layer name, 90
LD4, see boring log
left margin, 8
linear, 3, 14
liquid limit, 2, 22–23, 56–57, 60, 62, 96
liquidity index, 2, 4, 23, 58, 96
log(size) vs. probability, 3, 13–14
Make a selection list, 40–41
margins, 4, 8
material description, 5, 15, 36
Material larger than gravel is, 16
Max. dens. size, 54
maximum density, 97
denoted on chart, 5
rounding, 5, 27, 29
units, 27
maximum density line, 54
Maximum diameter, 13
maximum dry density, 2
medium, 38
meniscus correction, 52
metafile, 81, see .EMF
LabSuite by GEOSYSTEM Software
LabSuite User’s Guide
Minimum diameter, 13
Minimum number of specification points to plot, 14, 20
Minimum reported diameter size, 16
moisture content
and CT-216 tests, 29, 72
averaging two per Proctor point, 70
container weights for, 8, 34
oversize, 69
oversize correction, 30
moisture-density
deleting test data, 71
entering test data, 67–72
moisture-density curve
one-point test curves, 25
previewing and modifying, 73–80
test points on, 77
width of, 25
Mold diameter, 31
Mold height, 31, 70
Mold volume, 31, 70
More... button, 38
Multi-point temperature correction, 51
natural moisture, 4, 58, 96
Navigation tab placement, 8
NP, 58
Number layers, 31
NV, 57
one-point compaction test, 25, 68
creating a moisture-density curve from, 79–80
opening size
(Default opening sizes), 37
automatically entering, 21, 49
entering, 45
measurement of, 4, 18, 37
optimum moisture content, 2, 97
rounding, 27, 29
Other, 64
Output Chart Report, 88–90
Output Data Summary Report, 88–90
Oven dry liquid limit, 60
oven-dried, 2, 60
Oven-Dried Organics Check, 56
Overall plasticity index, 64
oversize correction, 1–2, 28–31, 74, 97
Oversize moisture, see moisture content: oversize
oversize percentage, 30, 69, 97
Path to exported files, 12
PDF, see .PDF
per-sieve weight retained, 2, 36, 46
Percent of original sample finer..., 50
Percent oversize, see oversize percentage
Percent retained scale, 3, 13
Percent smaller than the #200 sieve, 69
percentages
decimal places, 16
Copyright 2005-2009 GEOSYSTEM Software, Inc.
101
Percentages: Report to, 16
Phi, see Wentworth
Place files in, 90
plastic limit, 2, 23, 58, 60, 62, 96
plasticity chart, 22
plasticity index, 2, 22–23, 96
Plot Curve Only, 77
Plot Test Points Only, 77
PNG, see .PNG
precalculated, 36
Preferred classification system, 10
Preview Forms, 83
Principal component, 64
Print fineness modulus with testing remarks, 15
Printed reports use color curves, 9
printing, 85
probability, see log(size) vs. probability
Proctor, see moisture-density
Prompt text color, 8
Quality Control - Density, 68
Report #200 and smaller to 1 decimal if less than 10%, 16
Report is on..., 90
Report is scaled in..., 90
Report the uncorrected curve in addition to the corrected curve,
30, 74
Report the uncorrected results in addition to the corrected results, 30
report title, 15, 22, 24–25
Reset, 84
Reset Path to Default, 12
right margin, 8
riprap, 32
rock correction, see oversize correction
Round Atterberg limits to, 23
Round max. density to, see maximum density: rounding
Round opt. moisture to, see optimum moisture content: rounding
sample description, see material description
Sample Info., 35–36, 45, 55, 67
Sample weight, 51
sample weight
how to enter, 43
Save Current Sieve Nest, 49
scale captions, see chart: particle size scale captions
Scale maximum, 22
Scale minimum, 22
Scale start, 84
Scale step, 84
Second symbol, 60
Select an appropriate ending..., 89
Select the moisture scale minimum and maximum values, 22
selection list, 40–41
semi-log, 14
Separation sieve, 50
settings
http://geosystemsoftware.com/support.htm
102
Index
saving, 32
shaping point, 53–54, 75–76
sieve, see opening size
sieve nest, 21, 48–49
Sieve Nest Lists, 48
Sieve Opening Sizes, 18
sieve test
entering data for, 42–47
entering test data, 35
how weighed, 36
Sieve test style, 36
Single-point temperature correction, 51
Smaller than 0.02mm., 63
Smaller than 1in., 63
Smaller than 2 microns, 65
Smaller than 3/8in., 63
Smaller than #10, 62, 63, 65
Smaller than #200, 60, 62, 63
Smaller than #270, 65
Smaller than #30, 63
Smaller than #4, 60
Smaller than #40, 62
Smaller than #60, 63
Smallest thread diameter, 64
Soil specific gravity, 68
Spec., see specification envelope
specific gravity, 51
bulk, 30, 69, 97
compaction test sample, 68, 97
ZAV curve, 68
specification envelope, 3, 14, 20, 39
Specification name, 29
split sample, 2, 43, 47, 50
spreadsheet, see xml files
Standard/modified/other, 29
summary report
defined, 81
how to print, 81, 87
in .PDF format, 12
margins on, 8
print settings, 88–90
Superpave, 20, 39
support, see technical support
top margin, 8
TrueType, 90
tutorial, 6
Unified Soil Classification System, see ASTM D 2487
units
density, 27
for compaction test mold volumes, 70
for compaction test mold weights, 70
for CT-216 soil weights, 72
for sieve opening sizes, 20, 45
Units for mold weights, see units: for compaction test mold
weights
Units for soil weights, see units: for CT-216 soil weights
USCS, see ASTM D 2487
USDA, 1, 24, 65, 96
Use ASTM D 4318 1-point calculation method, 57
wash, see #200 wash
Water added, 72
webserver, 4, 12
Wentworth, 3, 14, 38, 95
Wet wt. of soil, 72
Windows metafile, see .EMF
word processor, 4, 81
Wt. d+t, 57, 71
Wt. mold, 70
Wt. mold+soil, 70
Wt. w+t, 57, 71
xml files
automatically creating, 12
creating, 4, 91
defined, 81
ZAV, see zero air voids
zero air voids, 68, 85
Tamper reading, 72
Tare, 43, 57, 71
Tare ID, 8, 34, 57, 71
technical support, 6
temperature correction, 2, 51
Test method, 29
test specification, 2
editing, 27–31
exported variable name, 97
selecting for a compaction test, 68
tested by, see chart report: ’tested by’ on
This specification requires a unique rounding selection, 29
title, 15, 22, 24–25
tolerance, 3
www.geosystemsoftware.com
LabSuite by GEOSYSTEM Software