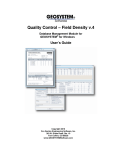
1
GEOSYSTEM® Proctor
Software for Moisture-Density Tests
User’s Guide
Copyright 2005-2009 Von Gunten Engineering Software, Inc.
363 West Drake #10
Fort Collins, CO 80526
http://www.geosystemsoftware.com
Information in this document is subject to change without notice and does not represent a commitment on the part of Von Gunten Engineering Software, Inc. The software described in this document
is furnished under a license agreement, and the software may be used or copied only in accordance
with the terms of that agreement. The licensee may make copies of the software for backup purposes
only. No part of this manual may be reproduced in any form for purposes other than the licensee’s
personal use without the written consent of Von Gunten Engineering Software, Inc.
Copyright Von Gunten Engineering Software, Inc. 2005-2009. All rights reserved.
Published in the United States of America.
GEOSYSTEM® is a registered trademark of VES, Inc.
Windows® is a registered trademark of Microsoft Corporation
Last revised October 9, 2009.
Contents
1 Introduction
1.1 Proctor Features . . . . . . . . . .
1.1.1 New Features in Version 4
1.2 Tutorial . . . . . . . . . . . . . . .
1.3 Contacting Technical Support . . .
.
.
.
.
1
1
1
4
4
.
.
.
.
.
.
.
.
.
5
5
6
6
7
8
10
12
16
17
.
.
.
.
.
.
.
.
19
19
21
23
23
25
25
26
28
.
.
.
.
29
30
31
33
35
5 Reporting Your Data
5.1 Chart Reports . . . . . . . . . . . . . . . . . . . . . . . . . . . . . . . .
5.1.1 Selecting a Scale for Moisture-Density Reports . . . . . . . . .
5.1.2 Printing Your Reports . . . . . . . . . . . . . . . . . . . . . . .
37
38
40
41
.
.
.
.
.
.
.
.
.
.
.
.
.
.
.
.
2 Configuration
2.1 Data Entry Options . . . . . . . . . . . .
2.2 Reporting Options . . . . . . . . . . . . .
2.2.1 Printout Margins . . . . . . . . .
2.2.2 Chart Report Options . . . . . . .
2.2.3 Moisture-Density Report Settings
2.3 Moisture-Density Calculation Options . .
2.4 Moisture-Density Test Specifications . . .
2.5 Automatically Exporting Reports . . . . .
2.6 The Container List . . . . . . . . . . . . .
.
.
.
.
.
.
.
.
.
.
.
.
.
.
.
.
.
.
.
.
.
.
.
.
.
.
3 Entering Moisture-Density Test Data
3.1 Moisture-Density Sample Information . . . .
3.1.1 Sample Info. Selection Lists . . . . .
3.2 Moisture-Density Test Entry . . . . . . . . .
3.2.1 Test Specifics . . . . . . . . . . . . . .
3.2.2 Sieve Percentages . . . . . . . . . . .
3.2.3 Oversize Correction . . . . . . . . . .
3.2.4 Proctor Test Data . . . . . . . . . . .
3.2.5 California Test Method 216 Test Data
.
.
.
.
.
.
.
.
.
.
.
.
.
.
.
.
.
.
.
.
.
.
.
.
.
.
.
.
.
.
.
.
.
.
.
.
.
.
.
.
.
.
.
.
.
.
.
.
.
.
.
.
.
.
.
.
.
.
.
.
.
.
.
.
.
.
.
.
.
.
.
.
.
.
.
.
.
.
.
.
.
.
.
.
4 Viewing and Modifying the Moisture-Density Curve
4.1 Toolbar Controls . . . . . . . . . . . . . . . . . . . .
4.2 Reshaping the Curve . . . . . . . . . . . . . . . . . .
4.3 Changing How the Curve is Displayed . . . . . . . .
4.4 Creating Curves for One-Point Tests . . . . . . . . .
iii
.
.
.
.
.
.
.
.
.
.
.
.
.
.
.
.
.
.
.
.
.
.
.
.
.
.
.
.
.
.
.
.
.
.
.
.
.
.
.
.
.
.
.
.
.
.
.
.
.
.
.
.
.
.
.
.
.
.
.
.
.
.
.
.
.
.
.
.
.
.
.
.
.
.
.
.
.
.
.
.
.
.
.
.
.
.
.
.
.
.
.
.
.
.
.
.
.
.
.
.
.
.
.
.
.
.
.
.
.
.
.
.
.
.
.
.
.
.
.
.
.
.
.
.
.
.
.
.
.
.
.
.
.
.
.
.
.
.
.
.
.
.
.
.
.
.
.
.
.
.
.
.
.
.
.
.
.
.
.
.
.
.
.
.
.
.
.
.
.
.
.
.
.
.
.
.
.
.
.
.
.
.
.
.
.
.
.
.
.
.
.
.
.
.
.
.
.
.
.
.
.
.
.
.
.
.
.
.
.
.
.
.
.
.
.
.
.
.
.
.
.
.
.
.
.
iv
CONTENTS
5.2
5.3
5.4
5.5
5.6
Index
5.1.3 Selecting a Chart Report Format . . . . . . . . . . . .
Data Summary Reports . . . . . . . . . . . . . . . . . . . . .
Exporting Reports To Files . . . . . . . . . . . . . . . . . . .
Exporting XML Files . . . . . . . . . . . . . . . . . . . . . .
Listing the Results From Multiple Tests . . . . . . . . . . . .
5.5.1 Moisture-Density Results Calculated by the Program .
Technical Documentation . . . . . . . . . . . . . . . . . . . .
.
.
.
.
.
.
.
.
.
.
.
.
.
.
.
.
.
.
.
.
.
.
.
.
.
.
.
.
.
.
.
.
.
.
.
42
43
44
47
47
48
48
49
1. Introduction
Proctor reduces and reports data from moisture-density (i.e., "Proctor" or "compaction")
tests. The software’s moisture-density test calculations are compliant with ASTM D 698 and D 1557,
AASHTO T 99 and T 180 and California Test method 216 (CT-216). Oversize (rock) correction of
test results can be performed according to ASTM D 4718, AASHTO T 224 and CT-216.
1.1
Proctor Features
This section provides a list of some of Proctor’s features that might go unnoticed without
closely reading the program’s manual.
• Test data can be printed in a variety of different formats, including one that includes all of
your raw test readings, which is handy for archiving your test data in paper form.
• Optional automatic averaging of two moisture content tests per compaction point.
• Compaction test specification editor supports adding new, modified or updated compaction
test specifications to the program’s list of supported test types.
• Automatic adjustment of compaction test results to account for oversize material (i.e.,
"rock correction") via ASTM D 4718, AASHTO T 224 or CT-216.
• Limited support for creating a compaction curve from a single moisture-density test point.
• If the GEOSYSTEM Boring Log Drafting program is licensed, calculated results such as the
maximum dry density and optimum moisture content are available for inclusion on boring
log reports.
1.1.1
New Features in Version 4
We’ve been collecting requests for new features since releasing our first DOS programs in
1984. The new program finally puts check marks next to many of the items on our most-wanted list:
Direct creation of .PDF files
.PDF files are great for e-mailing reports to your clients because your client receives an exact picture of the printed report. However, Adobe’s Acrobat program
(which is typically used to create these files) is expensive, difficult to use and
must be licensed for every computer that needs to create .PDF files. Proctor’s
ability to directly create .PDF files of chart and summary reports means that you
won’t need to pay Adobe for a separate .PDF package.
1
2
Introduction
Container weight database
Proctor may be set up to keep a list of sample container IDs and weights. You
can use this feature avoid weighing moisture content test sample containers.
Curves may be plotted in color
When printed on a color printer, Proctor can draw each test’s curve in a different
color.
Reports can include a disclaimer
Your reports can include a disclaimer such as This report contains test results
of a randomly selected sample and may not be indicative of the properties of
similar materials used or sampled from the same site. This report shall not
be altered or reproduced without the expressed written consent of the testing
laboratory.
Reports can include an area for reporting (or signing) by the test technician and
report reviewer
(I.e., "Tested by" and "Checked by".)
Fully automatic export of test reports
Whenever you enter a test or modify its data, Proctor can automatically generate
a .PDF version of the test report in a directory of your choosing. You can use this
feature to maintain an archival copy of a project’s reports (it’s always better to
store your data in as many formats as is possible if you want to be able to review
your results many years down the road), or (if your webserver’s directories are
available on your local network) make your reports web-accessible.
Testing data may be exported to XML files
Microsoft Excel XP can directly read these files, so your clients who want to
do their own data processing with a spreadsheet can import your testing data
directly into Excel.
Selectable margins for all printouts
This feature can be used to make space at the top of the page for printing your
reports on letterhead.
Reports can be copied to the Windows clipboard
From the clipboard, you can paste your test reports directly into Word documents.
Maximum Density/Optimum Moisture Point Shown Directly on Proctor Charts
Moisture-density curves can now optionally denote the point of maximum density and optimum moisture directly on the chart as required by, e.g., ASTM D
698 §12.1.11.
Current Compaction Test Support
Proctor adds support for ASTM D 698-07, D 1557-02 and AASHTO T 224-01.
www.geosystemsoftware.com
Proctor by GEOSYSTEM Software
Proctor User’s Guide
3
Data-averaging Compaction Curve Plotting Option
As an option, compaction curves can be drawn using a "data-averaging" mathematical model: These curves average the distance between the curve and each
test point, which can be used to smooth out compaction test errors.
Selective Omitting of Test Points from the Compaction Curve
Bad compaction test points can be dropped from the compaction curve while still
including the test data on summary reports for documentation purposes.
Per-Test Specification Results Rounding
Different moisture-density test specifications feature different calculated results
rounding requirements (e.g., ASTM D 698 requires reporting the maximum dry
density to 0.1 pcf, while ASTM D 1557 requires rounding to 0.5 pcf); Proctor
now allows you to select the rounding criteria for maximum density and optimum moisture results on a per-test specification basis.
Copyright 2005-2009 GEOSYSTEM Software, Inc.
http://geosystemsoftware.com/support.htm
4
Introduction
1.2
Tutorial
If you’re just starting out with the software, consider taking the program’s thirty minute
tutorial:
1. Start the GEOSYSTEM for Windows package: If you have a "GEOSYSTEM" shortcut on
your desktop, double-click on it; if you don’t have the shortcut, click on your "Start" button and select Programs > GEOSYSTEM > GEOSYSTEM for Windows.
2. On the left side of the program’s screen is a directory box: navigate to the directory where
your GEOSYSTEM programs are installed. (If you’ve installed the software onto your own
hard disk, this will probably be C:\PROGRAM FILES\GEOSYS.)
3. In the program folder you will find a file called DEMO: double-click on it.
4. The software should display the contents of the DEMO project. On the left side of the
screen is a yellow box listing the material sources from which the DEMO project’s testing
samples were taken: click on either Boring B-4 or B-4.
5. On the right side of the screen you should see a list of samples taken from Boring B-4: find
the data entry card for sample S-4 and click on the underlined Proctor at the bottom of
that card.
6. Select Help > Tutorial, and the program will begin displaying a series of yellow tutorial
cards at the bottom of the data entry window.
1.3
Contacting Technical Support
If you have any questions on installing or operating our software, please feel free to contact
GEOSYSTEM technical support. We do not charge for support, though we can only help with software that we are currently selling (we cannot answer questions about older versions our programs).
You can contact us through our support page at http://www.geosystemsoftware.com/support.htm.
; If you think that the program’s calculated results "don’t look quite right", please
give us something more to work with: do the calculations by hand and fax your
calculations to +1 970/223-8788 prior to submitting a support question.
www.geosystemsoftware.com
Proctor by GEOSYSTEM Software
2. Configuration
Proctor features a number of configurable options for data entry, test results calculation
and report generation. Before typing in your first test set you should make sure that the package
is correctly configured for your specific testing and reporting standards. To do this, select Options
> Proctor Setup.
; Note that these settings affect every test entered into the current project file.
2.1
Data Entry Options
Figure 2.1: Data Entry Settings
Selecting Options > Proctor Setup then clicking on Data Entry in the navigation list at the
dialog’s left side provides you with the following options:
Prompt text color
Sets the color of all data entry prompts. Click Set to select a color or Reset to
restore the program’s default color.
Navigation tab placement
Navigation tabs allow you to change from one window to another (for example,
between the test data entry windows and the report preview window). The tabs
look like this:
Navigation tabs may be placed at either the top or the bottom of the screen by selecting one of the
Navigation tab placement options.
5
6
Configuration
Container weights are entered as
Proctor can be set up to keep a list of container IDs and associated weights –
when entering moisture content data, instead of entering the container weight
you can enter the container ID and the program will look up the associated
weight. To do this, select Tare ID in this box then enter your list of container
IDs and weights into the program’s container database (Options > Container
List).
2.2
Reporting Options
The following subsections cover settings that affect the program’s printed reports.
2.2.1
Printout Margins
Figure 2.2: Setting the Report Margins
The Margins selection on the Setup dialog (Options > Proctor Setup then click on Margins
in the navigation list at the dialog’s left side) allows you to select the whitespace used at the top,
bottom, left and right sides of chart and summary reports.
; The measurement units (inches or cms.) used for specifying margins are determined by the Regional settings in the Windows Control Panel.
www.geosystemsoftware.com
Proctor by GEOSYSTEM Software
Proctor User’s Guide
2.2.2
7
Chart Report Options
Figure 2.3: General Chart Report Settings
The basic appearance of chart reports generated by Proctor may be customized by selecting
Options > Proctor Setup and then clicking on General Settings underneath Chart Reports in the
navigation list at the dialog’s left side.
Printed reports use color curves
If selected, curves plotted on chart reports are shown in a program-selected color.
; Note: the first curve printed on a chart is always black, so the checkbox has
no effect unless the chart includes more than one curve.
PDF reports use color curves
Determines whether chart reports exported as .PDF files show curves in programselected colors.
Include a disclaimer
If selected, a disclaimer is printed down the left margin of chart reports. The
disclaimer is listed in the Disclaimer field directly below the checkbox, and may
be modified after checking the Include a disclaimer box.
; The figure shown on page 19 includes a sample of how the disclaimer is
printed on a chart report.
Drop "Tested by" from reports if a name is not entered
The Sample Info. window includes a data entry field titled Tested by. This
field, along with the Drop "Tested by" from reports if a name is not entered
checkbox on the program’s setup dialog affects the appearance of chart reports:
• If you do not fill in the Tested by data entry field and Drop "Tested by" from
reports if a name is not entered is not checked, "Tested by" will appear
below chart report’s bottom margin, along with an area for a signature.
Copyright 2005-2009 GEOSYSTEM Software, Inc.
http://geosystemsoftware.com/support.htm
8
Configuration
• If you do not fill in the Tested by data entry field and Drop "Tested by" from
reports if a name is not entered is checked, "Tested by" will NOT appear
below chart report’s bottom margin.
• If the Tested by data entry field is filled in: "Tested by" will appear below
chart report’s bottom margin, followed by the name entered into the Tested
by data entry field.
Drop "Checked by" from reports if a name is not entered
Is similar to Drop tested by... discussed above. Leaving this box unchecked
and leaving the Checked by data entry field blank provides an area below chart
reports’ bottom border for the report’s reviewer to sign the page.
Preferred classification system
Several moisture-density report formats include room for only a single soil classification; for these forms, the Preferred classification system box selects
which classification will be included on the report.
2.2.3
Moisture-Density Report Settings
Figure 2.4: Moisture-Density Report Settings
Selecting Options > Proctor Setup and clicking on Chart Reports underneath MoistureDensity in the navigation list at the dialog’s left side allows you to modify the appearance of reports
produced for moisture-density tests:
Report title
The chart report title is a single line of text shown at the top of the moisturedensity chart report. Typically the title reads, e.g., Compaction Test Report
or Moisture-Density Test Results.
Curve width
Determines the width of the moisture-density curve when drawn on a moisturedensity chart report.
www.geosystemsoftware.com
Proctor by GEOSYSTEM Software
Proctor User’s Guide
9
Draw extrapolated one-point curves on chart reports
Draw one-point test match curves on chart reports
Proctor supports a simplified version of the AASHTO T 272 one-point test
matching procedure that extrapolates a one-point test’s compaction curve from
a pair of existing tests’ compaction curves. For one-point tests that have an
extrapolated compaction curve, Proctor can be configured to plot the extrapolated compaction curve (by checking the Draw extrapolated one-point curves
on chart reports box) and/or the pair of existing tests’ compaction curves (by
checking the Draw one-point test match curves on chart reports box).
Figure 2.5: Synthesized One-Point Test Curve and Match Curves
Copyright 2005-2009 GEOSYSTEM Software, Inc.
http://geosystemsoftware.com/support.htm
10
Configuration
Denote point of max. dens./opt. moist. on charts
Selecting this option adds a small call-out box to the moisture-density chart
pointing to the point of maximum density/optimum moisture. The selection
is required by many test standards (e.g., ASTM D 698).
Figure 2.6: Moisture-Density Chart with Call-Out Box
2.3
Moisture-Density Calculation Options
Figure 2.7: Moisture-Density Calculated Values Settings
The Calculated Values selection on the Settings dialog (Options > Proctor Setup then click
on Calculated Values underneath Moisture-Density in the navigation list at the dialog’s left side)
includes several options that affect how moisture-density test results are reported:
www.geosystemsoftware.com
Proctor by GEOSYSTEM Software
Proctor User’s Guide
11
Density units
This selection changes the units to be used to report calculated densities, regardless of the units used to enter the compaction test data.
Round max. density to
This selection box controls the program’s rounding of calculated maximum density values. Note that the list of available rounding options changes depending
upon which density units have been selected.
Round opt. moisture to
This selection box controls the program’s rounding of calculated optimum moisture content percentages.
; Using the Test Specification editor (see § 2.4) you can override the rounding selection on a per-test specification basis: This can be useful for setting
the test results rounding selection for particular moisture-density test specifications that mandate a specific rounding procedure for test results. If your
Round max. density to and Round opt. moisture to selections are not reflected in your reported test results, use the Test Specification editor to check
to see if your test specification overrides the default rounding settings.
Test specifications
Clicking on the Edit button brings up the Moisture-Density test specification
editor, covered in § 2.4
Copyright 2005-2009 GEOSYSTEM Software, Inc.
http://geosystemsoftware.com/support.htm
12
Configuration
2.4
Moisture-Density Test Specifications
Figure 2.8: Test Specification Editor
Proctor incorporates a list of different moisture-density test specifications, which consists of:
• The physical requirements of the test, such as the dimensions of the mold, the number of
soil layers and blows per layer and the hammer weight and drop.
• Oversize correction requirements such as the size of sieve used to separate out oversize
material and the oversize moisture and density correction method.
• Unique reporting requirements, such as whether to report the non-oversize corrected test
results as well as the corrected test results.
Each moisture-density test entered into the system must be associated with a test specification
from this list.
To edit the program’s test specification database, select Options > Proctor Setup then click
on Calculated Values underneath Moisture-Density in the navigation list at the dialog’s left side,
then click on the Edit button.
To edit a test specification:
Test specifications currently stored in the database are listed on the left-hand
side of the panel: To view or edit a specification in the list, simply click on the
specification’s name.
To create a new test specification:
You can add a new test specification by clicking on the New button, or you can
start with an existing test specification and save it under a new name by clicking
on the test specification in the left-hand list, then click on the Copy button.
To remove a test specification from the database:
Click on the test specification’s name in the specification list then click on the
Delete button.
www.geosystemsoftware.com
Proctor by GEOSYSTEM Software
Proctor User’s Guide
13
A moisture-density test specification includes the following information:
Specification name
Each specification must be associated with a unique name that describes the test
method. A typical specification name would be ASTM D 698-91, Method A.
Standard/modified/other
Two test specifications may share the same name if different values are entered
into the Standard/modified/other field for the two specifications: for example, there may be two ASTM D 698-91, Method A test specifications - one
Standard, the other Modified.
Oversize material is larger than
For test procedures that require an oversize material correction, this selection
specifies the sieve opening size that denotes the oversize material boundary.
Test method
Select Proctor test for a normal moisture-density test not involving the California Test Method 216 (CT-216) procedure.
For CT-216 tests, Proctor supports two test methods: a modified CT-216 test
procedure where moisture contents are taken at each test point (this method
is labeled as CT-216 with added moisture content tests in the test
method selection box), and a by-the-book CT 216 procedure without moisture
contents (labeled California Test 216 in the selection box).
This specification requires a unique rounding selection
The software has maximum dry density and optimum moisture content rounding settings (Round max. density to and Round opt. moisture to, covered in
§ 2.3) that affect almost every test specification; however, you can choose to override these settings for individual test specifications. This can be useful for setting
the test results rounding selection for particular moisture-density test specifications that mandate a specific rounding procedure for test results (e.g., ASTM D
698 requires reporting the maximum dry density to 0.1 pcf, while ASTM D 1557
requires rounding to 0.5 pcf).
If you would like to require a particular rounding procedure for a given test
specification, check the This specification requires a unique rounding selection box, then select the proper rounding option in the Max. density and
Opt. moist. boxes.
Copyright 2005-2009 GEOSYSTEM Software, Inc.
http://geosystemsoftware.com/support.htm
Configuration
14
Max. density
These options control the rounding of the maximum density and optimum moisture content results calculated by the program for a test using the current test
specification. The selection boxes are only available if the This specification requires a unique rounding selection box is checked; otherwise, the program
rounds the results for tests using the test specification according to the rounding
settings chosen in § 2.3.
Density correction
Selects the method by which density results from tests using the specification
are to be corrected for the presence of oversize material (i.e., rock). Select No
oversize density correction if you do not want to correct the calculated densities.
Moisture correction
Selects the method by which moisture content results from tests using the specification are to be corrected for the presence of oversize material. Select No
oversize moisture correction if you do not want to correct the calculated moisture contents.
; You can stop the program from correcting the moisture and density results for
any given test, even if the test’s specification requires corrections: Simply do not
enter a percentage for the oversize material, or a bulk specific gravity.
Correct
Proctor can apply the density and moisture oversize corrections to each test
point or just to the calculated maximum dry density and optimum moisture content.
; The only real difference between the two options is that if the option to apply
the corrections to each test point is chosen, you can opt to have the program plot
both the corrected and uncorrected curves as part of the hardcopy reports; if the
option to apply the corrections only to the final results is chosen, the corrected
maximum density/optimum moisture content will be reported, but charts will
only include the uncorrected curve.
Report the uncorrected results in addition to the corrected results
When an oversize correction is applied, the program can be configured to report
uncorrected maximum dry density/optimum moisture values in addition to the
corrected test results. This selection affects both the data summary report and
the chart report. For example, the following figures demonstrate the effect of
selecting and unselecting this option on the PRGEOSYS chart report:
www.geosystemsoftware.com
Proctor by GEOSYSTEM Software
Proctor User’s Guide
15
Figure 2.9: Chart Report Test Results Box Showing Corrected Results
Figure 2.10: Chart Report Test Results Box Showing Corrected and Uncorrected Results
Report the uncorrected curve in addition to the corrected curve
When this option is selected, Proctor will plot two curves on moisture-density
charts: One curve will be plotted using the original, uncorrected, test results,
while the second curve will be plotted using the test’s density and moisture results after correcting for the presence of oversize material.
; This option will not be available if you select Only the max. density and
opt. moisture in the Correct box because there is no corrected curve: The
uncorrected is plotted to calculate an uncorrected maximum density and optimum moisture content, then the oversize correction is applied to the results.
Mold diameter
Mold height
For non-CT-216 tests, Proctor utilizes the mold diameter and height required by
the selected test specification to calculate a mold volume that is used during data
entry as a default for each compaction point’s Mold volume test data entry field.
Hammer wt.
Hammer drop
Blows per layer
Number layers
These fields are optional. If data are entered for all four prompts, it will be
included as part of the test specification listed on chart reports.
; Because Proctor does not automatically include measurement units as part of
the specification listing, make sure to add lb. or kg. to the hammer weight
and in. or cms. to the hammer drop.
Copyright 2005-2009 GEOSYSTEM Software, Inc.
http://geosystemsoftware.com/support.htm
16
Configuration
2.5
Automatically Exporting Reports
Proctor can automatically export versions of its test reports into a selected hard disk subdirectory. This feature can be used to maintain an archival copy of a project’s reports (which is useful
because it’s always better to store your data in as many formats as is possible if you want to be able
to review your results many years down the road), or, if your webserver’s directories are available
from your local network, you can make your test reports web-accessible by configuring Proctor to
automatically store copies of each test report in a webserver directory.
; If your webserver is not accessible from your local network, you can use the
GEOSYSTEM Bindery program to export your grain size test reports to the web
and notify your clients via e-mail that new reports are available for review. The
program can also fax and e-mail your reports directly to clients.
For more information, please see www.geosystemsoftware.com/bindery.
If you select Options > Proctor Setup then click on Automatic Report Export in the lefthand navigation panel, you’ll be presented with the following dialog and options:
Figure 2.11: Automatic Report Export Dialog
Chart report (Adobe .PDF format)
If this option is checked, Proctor will automatically export the test’s chart report
in a format readable by Adobe Acrobat Reader.
Summary report (Adobe .PDF format)
If this option is selected, Proctor automatically exports the test’s summary report
into an Adobe Acrobat .PDF file.
Raw data (XML format)
If this option is selected, Proctor exports an XML file listing the test’s data and
calculated results.
www.geosystemsoftware.com
Proctor by GEOSYSTEM Software
Proctor User’s Guide
17
Path to exported files
This is the file path to where you want to store your exported files. If the path
does not exist, the program will offer to create it for you when you click on the
dialog’s OK button.
Reset Path to Default
This sets the Path to exported files to be a directory called "Bindery" stored
inside your project’s data file folder, which is useful if you want to export your
reports as an archival copy of your data.
Create .PDF pages in A4 page size
If this box is not checked, Proctor will export your reports as letter-sized (8.5" x
11.0") pages; if the box is checked, the .PDF reports will be created as A4-sized
(210mm. x 297mm.) pages.
; Proctor starts the test report exporting process when you select Save and Exit or
when you click on the program’s close button. This may delay the program for a
few seconds while exiting.
2.6
The Container List
Proctor may be set up to keep a list of sample container IDs and weights. You can use this
feature to avoid weighing the container used for moisture content tests.
Instead of weighing your containers every time they’re used, you can enter their weight and
ID (any label that can uniquely identify the container) into the program’s container weight database.
When you use an ID’d container for a test, record the container’s ID as part of your testing information and enter the ID into Proctor instead of the container weight.
To set up the container list, select Options > Container List.
Figure 2.12: The Container List Dialog
Copyright 2005-2009 GEOSYSTEM Software, Inc.
http://geosystemsoftware.com/support.htm
18
Configuration
To add a new container to the list:
Click on the first blank row in the list and enter the container ID and container
weight.
; Container IDs may be any combination of alphabetic and numeric characters;
e.g., ACD or 123. IDs that differ only by case (e.g., 3A and 3a) are considered
identical.
; Container IDs may be added to the list in any order.
To remove a container from the list:
Click in either the Container ID or Weight columns of the row you want to delete
then click on the Delete button.
; The container list is always optional: if you run a test with a container that is not
on your container list, you can skip entering a container ID and instead enter the
container’s weight.
After you’re through entering your container weights, close the dialog then select Options
> Proctor Setup, click on Data Entry in the Setup dialog’s left-hand navigation panel, then select
Tare ID in the Container weights are entered as box.
www.geosystemsoftware.com
Proctor by GEOSYSTEM Software
3. Entering Moisture-Density Test Data
Data entry for a moisture-density test involves two steps:
• Sample background information, which covers basic information about the sample tested.
• Test data entry, which involves entering the actual compaction test data.
The following sections discuss each data entry step in further detail.
3.1
Moisture-Density Sample Information
The initial moisture-density data entry window covers basic information about the tested
sample. This window is displayed by clicking on the Sample Info. navigation tab, or by selecting
Window > Sample Info.
Figure 3.1: Moisture-Density Sample Information Window
; Because Proctor supports a number of different report formats, the information
requested on this screen varies according to which report format is selected; e.g.,
some formats may include a place for listing the sample’s USCS classification,
while others may omit this information.
You can select from the program’s different report forms with the Report form
toolbar at the top of the report preview window (Window > Report Preview).
While most of the information requested on the Sample Info. window is self-explanatory, a
few require further definition:
Tested by
19
20
Entering Moisture-Density Test Data
Checked by
If you fill in either of these fields, the information that you enter will be shown
below the border of the test’s chart report, as the following figure demonstrates:
Figure 3.2: Report With Tested By and Checked By
; When printing more than one test per page, Proctor will use the "Checked
by" name entered for the first test placed on the page.
Material description
Proctor normally uses the material description that you entered into the Material Description field on the Data Manager window (that’s the window with
the numbered sample cards where you entered the sample’s number, depth, etc.).
However, if you’re entering boring log data, the material description at the depth
where you took your lab. test sample may only be something like:
grades to slightly silty
with the full stratigraphy description entered at some depth above the lab. test
sample. If this is the case, you can either override the default description or click
on the link that reads Click here to select from a list of material descriptions: this drops down a box listing all of the material descriptions entered into
the current source folder. Double-click on one of the descriptions to select it.
www.geosystemsoftware.com
Proctor by GEOSYSTEM Software
Proctor User’s Guide
3.1.1
21
Sample Info. Selection Lists
If you find that you’re typing the same information into one of the data entry fields on the
Sample Info. window for test after test, you can use the program’s Selection List feature to turn the
field into a popup list of selections that can be inserted into the field with a simple mouse click. There
are a couple of cases where this feature can be especially useful:
; You can set up a list of standard entries for fields such as "Tested By", "Checked
By", etc. so that you can select – with a single mouse click – from a list of personnel instead of typing in the same names over and over for every test you enter.
; Selection Lists can also be used to easily insert boilerplate text into, for example,
the testing remarks field. This can be very handy if the same basic text is always
typed into a particular data entry field.
To create a selection list for a field:
Right-click on the field and select Make a Selection List. This shows an empty
selection list box that you’ll need to fill with selection entries (such as personnel
names, or your test remarks boilerplate text):
Figure 3.3: Empty Selection List for "Tested by"
Copyright 2005-2009 GEOSYSTEM Software, Inc.
http://geosystemsoftware.com/support.htm
22
Entering Moisture-Density Test Data
Next, right-click within the empty selection list and select Edit, Delete and Add
Entries. When you’ve done this Proctor will show the Selection List Editor
dialog:
Figure 3.4: Selection List Editor
(The editor box above has already been filled in with a number of testing personnel names.)
Each selection that you want to appear is typed on a separate line: Type a selection, then follow by pressing the Enter key (this will show up as a ¶ sign at
the end of the entry). (You can delete entries by simply deleting the line of text
that defines the entry, including the ¶ sign at the end of the line.) When you’re
finished, click OK to save the list.
To use a selection list
Once you’ve created a selection list for a given data entry field, that list will
automatically appear when you click in the data entry field, at which point you
can either click on one of the items in the list (which will automatically fill in
your data entry field with that item), or manually type data into your field.
The figure below shows a sample "Tested by" selection list:
Figure 3.5: Sample Selection List
To delete a data entry field’s selection list:
Right-click on the data entry field then select Delete the Selection List. This
action can be undone: You can make your selection list reappear by right-clicking
within the data entry field and selecting Make a selection list again (the program
will have preserved your original selection list entries).
www.geosystemsoftware.com
Proctor by GEOSYSTEM Software
Proctor User’s Guide
3.2
23
Moisture-Density Test Entry
Proctor’s moisture-density test data entry window may be viewed by selecting Window
> Test Data or by clicking on the Test Data navigation tab.
Figure 3.6: Moisture-Density Test Data Entry Window
The following subsections cover each section of the data entry window in detail.
3.2.1
Test Specifics
Figure 3.7: Moisture-Density Test Specifics Box
Curve number
This is an optional item. If entered, the curve number be used as follows:
• It will appear on the test’s printed reports.
• Proctor will use the number for identifying the soil during the one-point curve
matching process.
• If licensed, the GEOSYSTEM Quality Control - Density (QC-Density) program uses this number as a reference for determining the maximum dry density associated with a particular field density test.
Copyright 2005-2009 GEOSYSTEM Software, Inc.
http://geosystemsoftware.com/support.htm
Entering Moisture-Density Test Data
24
Test specification
Use this box to select the specification used to perform the test (e.g., ASTM D
698 Method A). This selection is important: it determines the sieve used for
denoting oversize material, the oversize correction method, the default test mold
volume, etc.
; If your test’s specification isn’t in the drop-down list, use the program’s test
specification editor to add it before continuing.
Soil specific gravity
This is an optional item that will be reported on hardcopy printouts if entered.
The sample specific gravity is not utilized in any of the program’s calculations.
ZAV curve specific gravity
Several chart report formats offer the option to draw a single zero air voids (ZAV)
curve that represents the upper moisture-density boundary for a saturated soil
at a particular specific gravity. The ZAV curve specific gravity field allows you
to select the specific gravity used in the ZAV curve drawing equation.
; Other chart report formats, such as PRCOE, include three pre-defined ZAV
curves representing specific gravities of 2.6, 2.7 and 2.8. Proctor ignores the
contents of the ZAV curve specific gravity when one of these formats are
used.
; Proctor offers prompts for both the sample and ZAV curve specific gravity so
that in situations where a specific gravity test has not been performed on a
sample, the user may estimate the specific gravity for the purposes of drawing
the ZAV curve.
; Entering 0 for the ZAV curve specific gravity or leaving the field blank will
cause the program to omit the ZAV curve from reports featuring a single, user
selected ZAV curve.
www.geosystemsoftware.com
Proctor by GEOSYSTEM Software
Proctor User’s Guide
3.2.2
25
Sieve Percentages
Figure 3.8: Moisture-Density Sieve Percentages Box
Percent oversize
For test specifications requiring an oversize material correction, the correction
calculation requires the percent retained on a specific sieve representing the
boundary between the oversize material and the material used for the compaction test. The Percent oversize field should be used to enter the percentage
of material larger than whatever sieve is specified as being the oversize sieve by
the test specification (see § 2.4 for details on setting up a new test specification).
Percent smaller than the #200 sieve
This is an optional item that will be reported on hardcopy printouts if entered.
The value is not utilized in any of the program’s calculations.
3.2.3
Oversize Correction
Figure 3.9: Moisture-Density Oversize Correction Box
Bulk specific gravity
This is the specific gravity (typically the SSD bulk specific gravity) of the oversize
material. You do not need to enter this value if you are not correcting your test
results for the presence of oversize material.
Oversize moisture
This is the moisture content of the oversize material; again, you do not need to
enter this value if you are not correcting your test results for the presence of
oversize material.
Copyright 2005-2009 GEOSYSTEM Software, Inc.
http://geosystemsoftware.com/support.htm
26
Entering Moisture-Density Test Data
3.2.4
Proctor Test Data
Figure 3.10: Moisture-Density Test Data Grid
Proctor accepts data for up to six moisture-density test points, with one or two moisturecontent evaluations per test point. (Checking the Average two moisture content tests per point
option in the toolbar at the top of the window allows you to enter two moisture contents per test
point: the program averages the results of the two moisture content tests to determine the test point’s
moisture content.) Except in the one-point test case, the program requires a minimum of three test
points, with each point requiring the following data:
Wt. mold+soil
Wt. mold
These fields are used by the program to determine the soil density. Note that the
weights may be entered in either grams or pounds: The Units for mold weights
selection in the toolbar determines which units will be used.
; Because the same mold is normally used for all of the test points, the Wt.
mold entered for the first test point is automatically repeated for the other
test points. If the mold weight does change, a new weight may be entered for
any point.
Mold volume
Proctor requires the volume of the compaction mold, in either cubic feet or liters,
depending upon the dimension units assigned to the project file on which you’re
working: If you’ve configured the project to use SI units, enter the mold volumes in liters; for a US unit project, enter your mold volumes in cubic feet. (To
change your project’s dimension units, start your GEOSYSTEM program, open
the project, then select Project > Dimension Units.)
; Proctor automatically selects a default mold volume based upon the mold
diameter and mold height given for the test specification chosen in the Test
specifics box. The default volume may be changed for any point.
www.geosystemsoftware.com
Proctor by GEOSYSTEM Software
Proctor User’s Guide
27
Tare ID
If the option to enter container weights as tare IDs has been selected, data entry
for the moisture content portion of the test begins by selecting an ID from the
drop-down tare ID list. Once an ID is chosen, Tare field will be automatically
filled in with the weight corresponding to that container.
; If you haven’t yet entered the container and its weight into the program’s
container list, see § 2.6 for instructions on adding it. Alternatively, the tare
ID field may be left blank and a tare weight may be manually entered.
Wt. w+t
Wt. d+t
Tare
These are, respectively: the weights (in grams) of the wet soil and container, dry
soil and container and the container by itself.
; If the Average two moisture content tests per point toolbar check box is
selected and data are not available for a second moisture content test, leave
the second moisture content test fields blank; Proctor will utilize only the
data entered for the first (and only) moisture content test.
; To delete a given test point’s data, click the mouse in one of the test point’s
data entry fields, then select Edit > Delete this Test Point.
Copyright 2005-2009 GEOSYSTEM Software, Inc.
http://geosystemsoftware.com/support.htm
28
Entering Moisture-Density Test Data
3.2.5
California Test Method 216 Test Data
Figure 3.11: CT216 Test Data Grid
For California Test 216 tests, the following data are required:
Tamper reading
Enter the tamper shaft graduation reading here.
Wet wt. of soil
Enter the weight of the soil sample minus the tare weight. Note that the units
used can be toggled between grams and pounds by changing the Units for soil
weights box in the top toolbar.
Water added
Enter the amount of water added or subtracted to the tested sample. (For samples
that have had moisture removed via aeration, enter the amount of water removed
as a negative number.)
; If you’ve selected a test specification that uses the CT-216 with added
moisture content tests test method, the test data grid will also include prompts for entering each sample’s moisture content. See the discussion on entering moisture contents for a standard Proctor test for more information.
www.geosystemsoftware.com
Proctor by GEOSYSTEM Software
4. Viewing and Modifying the
Moisture-Density Curve
To preview a chart of the test’s moisture-density curve, select Window > Chart or click on
the Chart navigation tab. From this window you can:
• Reshape the moisture-density curve by moving or removing test points from the curve, or
by adding additional points to the curve.
• Choose between two different styles of curves.
• Choose to plot the compaction curve with or without test points, or to omit the curve and
just plot the test points.
• View moisture-density curves entered into the same project that are similar to the current
test’s curve.
• Synthesize a full compaction curve from a single moisture-density test point.
Figure 4.1: Moisture-Density Chart Review Window with One-Point Test Curve Selection Panes
29
30
Viewing and Modifying the Moisture-Density Curve
; The Chart Review window will display both an oversize-corrected and an uncorrected curve if:
– The test data includes oversize information (e.g., % oversize, bulk specific gravity, etc.).
– The specification used by the test includes an oversize correction applied to each
test point instead of applying the correction only to the maximum dry density
and optimum moisture values.
– The test’s specification uses the Report the uncorrected curve in addition to
the corrected curve option.
Otherwise, a single curve will be displayed.
4.1
Toolbar Controls
Figure 4.2: Moisture-Density Chart Review Window Toolbar
The toolbar at the top of the curve preview window contains the following controls:
Plot:
Determines whether the program plots the curve and test points, the curve only,
or the test points only. See § 4.3 for further details.
Data-averaging curve
Selecting this option produces a smoother curve, but one that doesn’t necessarily
pass directly through every test point. Refer to § 4.3 for further details.
Similar Curves
Clicking this button causes the program to display moisture-density curves from
the same project that have maximum dry density/optimum moisture contents
close to the current test’s maximum dry density and optimum moisture.
; The button is disabled for one-point tests because the program always shows
the similar curves for these tests.
"+" and "-" buttons
Clicking on the "-" button increases the moisture and density scale steps (i.e.,
the chart is zoomed out), while the "+" button decreases the scale steps (i.e.,
the chart is zoomed in).
www.geosystemsoftware.com
Proctor by GEOSYSTEM Software
Proctor User’s Guide
4.2
31
Reshaping the Curve
You can change the shape of the compaction curve by adding shaping points (additional curve
points added merely to force the curve to pass through a particular moisture/density location), moving
test points or by choosing to omit test points generated from bad data, as shown in the following
examples:
Figure 4.3: Original Moisture-Density Curve
Figure 4.4: Same Test Data; Added Shaping Point and Moved and Omitted Data Points
Copyright 2005-2009 GEOSYSTEM Software, Inc.
http://geosystemsoftware.com/support.htm
32
Viewing and Modifying the Moisture-Density Curve
To reshape the curve by adding a shaping point:
The shape of the curve may be adjusted by forcing it to pass through a new point.
To do this, select Curve then either Shape Curve (if the window shows a single
curve) or Shape Corrected Curve or Shape Uncorrected Curve. Next, move the
mouse cursor to the location desired for the curve to pass through, then click the
left mouse button. The new point will be marked with a "+", which will not be
shown on charts included on hardcopy reports.
To remove a shaping point:
Move the mouse cursor over the shaping point, then click the right mouse button
and select Delete this Point from the popup menu.
You can also remove all shaping points by selecting Curve > Delete All Shaping
Points.
To move a shaping point:
Once you’ve placed a shaping point you can move it: Place the mouse cursor
over the shaping point, click the right mouse button and select Move this Point.
Move the mouse cursor to the desired position for the shaping point then click
the left mouse button.
; Shaping points cannot be added to data-averaged curves.
You can also reshape the curve by moving or hiding test points:
To move a test point:
Move the cursor over the test point then click the right mouse button and select
Move this Point, then move the mouse cursor to the desired position for the test
point then click the left mouse button.
; Note that the test point itself will continue to be shown in its original position, although the compaction curve will no longer pass through it. If you do
not want to have the test point shown on the chart, use the procedure covered
below.
To omit a test point from the chart:
Sometimes it may be necessary to remove a test point from the compaction chart
because the testing data for the point is obviously not correct. To remove the
point from the chart, move the mouse cursor over the bad point, right-click and
select Include this Point on Curve to uncheck the option. (The point will still
show up on the chart review window and on data summary reports, but it will
not appear on chart reports.)
If the test point’s data appears to have been entered incorrectly, the data can be corrected by
moving the mouse cursor over the test point, then right-clicking and selecting Edit this Point’s Data.
www.geosystemsoftware.com
Proctor by GEOSYSTEM Software
Proctor User’s Guide
4.3
33
Changing How the Curve is Displayed
Proctor includes several options for changing how the compaction curve is plotted:
You can omit the curve from chart reports:
If your compaction curve cannot be modified into an acceptable shape you can
choose to have Proctor plot just the test points, omitting the curve. (You can
then draw the curve by hand on the hardcopy report.) To omit the curve, select Curve > Plot Test Points Only. Note that this option also causes the calculated maximum dry density and optimum moisture values to be omitted from
the report (you’ll need to work out your own values based upon the curve you’ve
hand-drawn).
You can omit the test points from chart reports:
Selecting Curve > Plot Curve Only omits the test points from the chart, leaving
only the curve.
The compaction curve can be plotted using a data-averaging curve model:
If your test data doesn’t form a smooth compaction curve, Curve > Data-Averaging
Curve can be used to draw a compaction curve formed using a least-squares linear regression mathematical model. In simplified terms, these curves average the
distance between the curve and each test point, making for a smoother curve, but
one that may not actually pass directly through each test point. As an example,
the following figure shows a compaction curve that’s somewhat oddly-shaped
because the points on the wet side of the curve do not make a smooth curve:
Figure 4.5: Moisture-Density Curve Drawn Using the Default Curve Plotting Method
Copyright 2005-2009 GEOSYSTEM Software, Inc.
http://geosystemsoftware.com/support.htm
34
Viewing and Modifying the Moisture-Density Curve
Selecting the Data-Averaging Curve option produces a smoother curve shape:
Figure 4.6: Moisture-Density Curve Drawn Using the Data Averaging Method
Note that the second curve does not exactly pass through each test point: For the
top two points on the wet side of optimum moisture, the curve essentially "splits
the difference" between the two points by passing on the right side of one and
on the left side of the second. The resulting curve appears smoother.
; The data-averaging curve model is not a panacea for cleaning up all misshapen curves. Some curves may benefit more by moving test points, removing bad data points from the curve, or by adding curve shaping points.
Additionally, curves with five or six test points do not tend to plot very well
using the data-averaging approach.
www.geosystemsoftware.com
Proctor by GEOSYSTEM Software
Proctor User’s Guide
4.4
35
Creating Curves for One-Point Tests
Proctor supports a simplified version of the AASHTO Family of Curves test method (T 272).
The program may be used to match up the single test point of a one-point compaction test against the
closest already-entered compaction curves above and below the point: a new curve passing through
the single test point is synthesized from a combination of the two existing curves.
Figure 4.7: One-Point Test with Extrapolated and Matching Curves
Proctor’s one-point curve generation differs from the AASHTO standard in that the program
only takes into account one curve above and one curve below the test point, while the standard
requires that the behavior of an entire family of curves be accounted for when extrapolating the new
curve.
To create a curve for a one-point test, begin by entering the data for the single test point, then
select Window > Chart. When the Chart Review window is displayed, a pane will be added to the
left-hand side listing compaction curves above and below the test point.
Copyright 2005-2009 GEOSYSTEM Software, Inc.
http://geosystemsoftware.com/support.htm
36
Viewing and Modifying the Moisture-Density Curve
Figure 4.8: One-Point Match Curves Pane
; Curves are ordered in the list by how close they are to the single test point.
The pane includes two lists of curves: one list contains curves that fall above the one-point
test and the other list contains curves that fall below the one-point test. Clicking on the checkbox for
one curve from each list causes the program to synthesize a curve passing through the test point and
roughly matching two match curves.
; The synthesized curve can be erased by unchecking the curve selections in the
Curves above the test point and Curves below the test point boxes.
; If oversize moisture or density corrections are applied, the test specifications used
by both the match curves and the one-point test curves should use identical settings for the Correct correction application test specification setting.
www.geosystemsoftware.com
Proctor by GEOSYSTEM Software
5. Reporting Your Data
Proctor features three methods for reporting your data:
XML Files
XML files contain a listing of both your raw testing data, as well as various values
calculated by the software such as the maximum density and optimum moisture
content. XML files are saved on-disk and may be viewed by a web browser or by
versions of Microsoft Excel newer than Excel2000. This is an ideal format for
e-mailing testing data and results to your clients in a format that incorporates
both a means of presentation (through a web browser) as well as a means of
manipulating the raw data (through a spreadsheet).
Data Summary Reports
Summary reports list the raw data taken from your test. They may be sent to a
printer or saved on disk.
Chart Reports
Chart reports are more formalized than summary reports: for example, a compaction chart report typically includes, in addition to a chart of moisture vs.
density, a block listing your company name, along with other values. Unlike
summary reports, chart reports normally do not list raw testing data.
; Another difference between chart and summary reports is that Proctor ships
with several different chart reports from which you can select, while there’s
only one format for the summary report.
; Chart and summary reports can be saved to a file in .PDF, .EMF, .PNG or .DXF
format.
; Through the Windows clipboard, you can also export chart reports to programs
that can paste pictures into their documents (such as word processors or paint
programs). To do this, select Edit > Copy Entire Test: once on the Windows
clipboard, you can paste the chart into, for example, a word processing document
by starting the word processor and selecting Edit > Paste.
37
38
Reporting Your Data
5.1
Chart Reports
Chart reports may be reviewed and printed by selecting Window > Reports, or by clicking
on the Reports navigation tab. From this window you can:
• Combine tests from several samples onto a single report page.
• Change a report page’s figure number.
• Select a different format for printing chart reports.
• Preview and print chart and summary reports.
Figure 5.1: The Report Preview Window
On the left side of the screenshot is a box listing the Proctor chart report pages that have
been set up for the current project: each sample tested will be shown on one of these pages. Some
chart report formats can support printing more than one sample’s test on a single page (for example,
each page in the screenshot supports up to 5 tests – one page in the sample is currently set up to print
three tests (Boring B-3, samples S-1, S-2, and S-3) and the other holds two tests from Boring B-4).
; Tests shown in gray will not be printed on the report because the report form that
you’ve selected does not have room for them. (This happens when you create a
page with, e.g., 5 tests, and then change to a report format that has room for, say,
a single test per page.) You should drag these tests onto a different page or
move them to their own report page; otherwise they will never print. (If
you click on the Auto. Combine button, the program will fix the problem for
you.)
www.geosystemsoftware.com
Proctor by GEOSYSTEM Software
Proctor User’s Guide
39
Following is a list of actions that you can take from this window:
You can move tests from one page to another
The program adds a new report page to the list for every test that you enter. So,
after you’ve entered all of your project’s tests, you’ll have a list of report pages,
with one test on each page. Since most report Proctor report formats can show
more than one test on a single page, you may want to combine several tests onto
one report page. To do this, drag the test (such as, e.g., the Boring B-4,S-1
test in the screenshot) from its own report page and drop it on another page.
You can have the program automatically combine tests onto report pages
Rearranging tests onto different report pages can be tedious...fortunately, computers excel at tedious tasks! If you click on the Auto. Combine button, Proctor
will try to combine as many tests onto a single report page as possible, with one
caveat: Proctor will only combine tests onto a single page if they were taken
from the same material source.
You can assign a figure number to a report page
Each report page can list a figure number. To set a page’s figure number, click in
the underlined area next to the word Figure at the top of the report page in the
left-hand list, then type in your figure number.
You can move a test onto its own report page
To do this, drag the test off of its current report page onto the yellow area at the
left side of the screen (i.e., drop the test anywhere but on another report page).
You can move a test into a new position on the report page
Drag and drop the test to a higher or lower position on its current report page in
the page list.
You can change the format of the report pages
The software ships with many different chart report formats that you can use
for printing your test data. (You can view samples of all of the program’s report
formats by clicking on the Preview Forms button.) To select a new report
format, click on the button shown in the following figure:
Figure 5.2: Selecting a Chart Report Form
Copyright 2005-2009 GEOSYSTEM Software, Inc.
http://geosystemsoftware.com/support.htm
40
Reporting Your Data
5.1.1
Selecting a Scale for Moisture-Density Reports
You can alter the moisture and density scale used on a specific moisture-density chart report
by previewing the report then selecting Report > Chart Report Scale. Doing so brings up the moisturedensity chart scaling dialog shown below:
Figure 5.3: Moisture-Density Chart Scale Dialog
This dialog lets you change the start and increment for the scales used on the moisturedensity graph included on the report that you’re currently previewing. The choices you make on this
dialog do not affect the moisture-density curve preview window, nor do they affect the small chart
shown on the test’s data summary report. Any changes made using this dialog affect only the test
report page that you’re previewing when Report > Chart Report Scale is selected.
Scale step
The moisture and density Scale step box lets you select the distance (in percentage and units of density) between scale labels on the chart.
Scale start
The Scale start box selects a value for the left side of the moisture content scale
and the bottom of the density scale.
Reset
Clicking on this button resets both moisture and density scales to the program’s
default selection.
www.geosystemsoftware.com
Proctor by GEOSYSTEM Software
Proctor User’s Guide
41
; If the currently selected report format includes three zero air voids (ZAV) curves
at specific gravities of 2.6, 2.7 and 2.8, the program will reserve some space immediately to the right of the 2.8 ZAV curve in order to display information on
the project and test specification. (The preceding screen shot shows the reserved
area, labeled "This area reserved for project data".) This reserved area places
some constraints on the scale that you choose because some combinations of density and moisture scale starts and scale steps would not leave enough room for
the program to display the right-hand project and test specification information.
If you adjust the chart scale so that the 2.8 ZAV curve runs through the hashed
"This area reserved for project data" area, clicking the OK button causes the program to shift your scale so that the hashed area is no longer intersected by the
ZAV curve; you will then need to click OK a second time to exit the dialog.
5.1.2
Printing Your Reports
After you’ve arranged your tests onto report pages you can preview or print each page: Locate
and click on the page in the page list shown in the yellow box on the left side of the screen then select
Test > Output Chart Report. You’ll be presented with the printer settings dialog:
Figure 5.4: Printer Output Settings Dialog
Print Settings
Click this button to select a different printer or to change the printer’s page size,
resolution, etc.
Print
Click this button to print your report.
Copyright 2005-2009 GEOSYSTEM Software, Inc.
http://geosystemsoftware.com/support.htm
42
Reporting Your Data
5.1.3
Selecting a Chart Report Format
You can view samples of the report forms shipped with the program by clicking on the Preview Forms button. Browse through the forms by clicking on the left and right arrow buttons in the
toolbar; when you’ve settled on a new report format, click on the Select this Format button.
; If you’d like printed samples of all of the report formats shipped with the program,
click on the Print Samples button.
Figure 5.5: Selecting a Chart Report Form
www.geosystemsoftware.com
Proctor by GEOSYSTEM Software
Proctor User’s Guide
5.2
43
Data Summary Reports
Data summary reports list the raw data taken from a single lab. test (e.g., specimen weights,
test readings, etc.). You can print a summary report or export it to a file by selecting Test > Output
Data Summary Report.
Figure 5.6: First Page of a Sample Summary Report
Copyright 2005-2009 GEOSYSTEM Software, Inc.
http://geosystemsoftware.com/support.htm
44
Reporting Your Data
5.3
Exporting Reports To Files
You can save Proctor’s testing data summary and chart reports for posting to a web server or
for e-mailing to clients. The program supports several different export formats:
• Adobe Acrobat .PDF: Universal format for Internet document distribution. Requires the
Adobe Reader program to display the files.
• AutoCAD .DXF: Format for interchange among CAD programs.
• Windows Metafile (.EMF): These files can be inserted as a picture into a word processing
document or manipulated with a vector-drawing program such as Adobe Illustrator.
• Portable Network Graphics (.PNG) and JPEG File (.JPG): These files are "bitmap" files
that can be inserted into word processing documents or edited with a raster-drawing program such as Windows Paint or Photoshop.
To save a chart or summary report as a file, select either Test > Output Data Summary
Report or Test > Output Chart Report, then, from the Output to box on the next dialog, select one
of the file formats outlined above.
If you’ve chosen the Adobe Acrobat .PDF File, Windows Metafile (.EMF), Portable Network Graphics (.PNG) or JPEG File (.JPG): options you’ll see the following dialog:
Figure 5.7: .PDF, .EMF, .PNG and .JPG Output Settings Dialog
.DXF files are somewhat more complicated: if you select the AutoCAD .DXF File you’ll see
this dialog:
www.geosystemsoftware.com
Proctor by GEOSYSTEM Software
Proctor User’s Guide
45
Figure 5.8: .DXF Output Settings Dialog
There are a number of options available for selecting where and how the reports are generated:
Base file name
When the program creates a file from one page your report (for .DXF, .EMF,
.PNG and .JPEG files), or from your entire report (for .PDF files), the file’s name
will start with whatever is entered into this field.
Select an appropriate ending for this filename
Without this option, the names of the files created will be whatever you have
selected as the Base file name. Checking the Select an appropriate ending
for this filename box alters how the program names the report files: the sample
number and/or sampling location is added to the Base file name, followed by
the test type (i.e., "PR") and either "ChartReport" or "TestData". For example,
with the Select an appropriate ending for this filename box checked, the
program may create .PDF files with names like:
P92321 Sample S-4 Boring B-3 GS TestData.PDF
P92321 Sample S-1 Test Pit TP-2 GS ChartReport.PDF
etc.
; With Base file name and Select an appropriate ending for this filename
you can come up with some useful file naming variations. For example, you
could leave Select an appropriate ending for this filename unchecked and
enter the sample number/location as part of the Base file name - of course,
this means that when you export the next report, you’d have to change the
Base file name to reflect the new sample number.
As another example, if you have created a hard disk subdirectory just to hold
Copyright 2005-2009 GEOSYSTEM Software, Inc.
http://geosystemsoftware.com/support.htm
46
Reporting Your Data
.PDF files from a certain project, you may not need to include the project
number as part of each .PDF file name: instead of being called, for example,
P92321 Sample S-4 Boring B-3.
(P92321 being the project number), by leaving the Base file name field
blank you can get export files with names like Sample S-4_Boring B-3.PDF
Place files in
Sets the directory where your exported files will be placed.
Report is on letter-sized paper (.PDF, .EMF and .PNG files only)
Report is on A4 paper (.PDF, .EMF and .PNG files only)
Selects the paper size to be used for the exported report image.
Report is scaled in inches (.DXF files only)
Report is scaled in centimeters (.DXF files only)
Reports exported as CAD files either measure either 10 units vertically (when
scaled in inches) or 25.4 units vertically (when scaled in centimeters). This
selection does not affect the report’s appearance; rather, it just affects the coordinates given to each line and piece of text on the report. (As such, the selection
is only important when the exported report is to be edited by an illustration or
CAD program.)
Binary (.DXF files only)
Binary .DXF files will be smaller (by 25 to 50 percent) and open faster in AutoCAD. The reports will appear the same when viewed in a CAD program no
matter if this option is selected or not. Note that very few illustration programs
will read binary .DXF report files.
TrueType (.DXF files only)
If this option is unselected, .DXF report files use a monospaced font (similar
to this) for everything on the form, meaning that .DXF reports are less attractive than their printed counterparts. The TrueType option allows you to generate .DXF files that look exactly like the printed versions – however, TrueType
.DXF files are only supported on AutoCAD versions 14 and newer; additionally,
many other drawing and CAD programs do not support TrueType files.
Layer name (.DXF files only)
Specifies the name of the CAD drawing layer on which your report will be drawn.
Layer names may be any combination of alphabetic and numeric characters –
however, many CAD programs cannot handle layer names that include spaces.
(MYLAYER is OK, MY LAYER is not.) Since your chosen layer name will be
repeated throughout the .DXF report files, the shorter you make the name the
smaller in size your .DXF files will become.
www.geosystemsoftware.com
Proctor by GEOSYSTEM Software
Proctor User’s Guide
5.4
47
Exporting XML Files
The XML file format provides a means of exporting your testing data and calculated test
results into a format readable by a web browser and by newer Excel spreadsheet programs (XP or
later). This makes XML files a natural method for posting testing results to a Web or FTP site or for
e-mailing directly to clients.
To export an XML file, select Test > Export XML File
Figure 5.9: Portion of an XML Report Viewed in Internet Explorer
5.5
Listing the Results From Multiple Tests
The Data Summary and Export tool discussed in Chapter 4 of the GDM manual and Appendix C of the LD4 User’s Guide may be used to summarize the results of multiple lab. tests. Several
stock configuration files can be used by selecting Tools > Data Summary and Export from the GDM
or LD4 menu, then selecting File > Recall Existing Configuration and selecting one of the listed
configuration files:
; If you’ve purchased LD4, you can use the configuration files to view an on-screen
list of the tests performed for a project: From the LD4 screen, select Project
> Browse and choose one of the listed configuration files.
Copyright 2005-2009 GEOSYSTEM Software, Inc.
http://geosystemsoftware.com/support.htm
48
Reporting Your Data
5.5.1
Moisture-Density Results Calculated by the Program
The following table lists the names of all of the calculated moisture-density variables provided
by Proctor:
Table 5.1: Calculated Moisture-Density Values
Item Name
PRCURVENO
MAXDENS
OPTMOIST
CORRMAXDENS
CORROPTMOIST
PRTEST_SPEC
PROVSPER
OVSPG
OVSMOIST
SPECGR
5.6
Description
Curve number
Maximum dry density (uncorrected for oversize material)
Optimum moisture content (uncorrected for oversize material)
Maximum dry density (corrected for oversize material)
Optimum moisture content (corrected for oversize material)
Test specification name
Percentage of material larger than the oversize sieve
Bulk specific gravity
Oversize material moisture content
Sample specific gravity
Technical Documentation
In the past each GEOSYSTEM program manual concluded with a chapter covering (in great
detail) the methods used by the program to calculate each test result. This had the effect of making
the manual thicker and thus more threatening looking to the casual user. To combat this perception
(and to save paper), we’ve moved the documentation chapters to our web site.
• Moisture-density calculations are documented here:
http://geosystemsoftware.com/products/pr4/downloads/pr4calculations.pdf
www.geosystemsoftware.com
Proctor by GEOSYSTEM Software
Index
.DXF, 37, 44–46
.EMF, 37, 44–46
.PDF, 1, 7, 17, 37, 44–46
.PNG, 37, 44–46
#200, 25
A4, 17
AASHTO T 180, 1
AASHTO T 224, 1
AASHTO T 272, see one-point compaction test
AASHTO T 99, 1
Adobe Acrobat, see .PDF
AS 1726, 8
ASTM D 1557, 1, 13–14
ASTM D 2487, 8
ASTM D 3282, 8
ASTM D 4718, 1
ASTM D 698, 1–3, 10, 13–14, 24
Auto. Combine, 38
AutoCAD, 37, 44–46
Average two moisture content tests per point, 26, 27
Base file name, 45
Binary, 46
Bindery, 17
Blows per layer, 15
boring log, 1, 20
bottom margin, 6
bulk specific gravity, see specific gravity: bulk
Burmister, 8
California Test Method 216, see CT-216
chart
previewing the compaction chart, 29–36
width of curves on, 8
chart report
’checked by’ on, 8, 19
’tested by’ on, 2, 7, 19
copying to the clipboard, 37
defined, 37
disclaimer on, 2, 7
exporting to a word processor, 37
figure number on, 38, 39
format of, 39, 42
how to print, 37, 41
in .PDF format, 7, 17, 44–46
in color, 2, 7
margins on, 6
print settings, 44–46
selecting a chart scale, 40–41
tests on, 39
title of, 8
Chart Report Scale, 40–41
checked by, see chart report: ’checked by’ on
clipboard, 2, 37
color, 2, 6–7
compaction curve, see moisture-density curve
compaction test, see moisture-density
container, see tare weight
Container ID, 2, 6, 18
Container weights are entered as, 6, 18
Control Panel, 6
Copy Entire Test, 37
Create .PDF pages in A4 page size, 17
CT-216, 1, 13, 28
curve
in color, 7
shaping the moisture-density curve, 31–32
Curve number, 23, 48
Curve width, 8
data summary report, see summary report
Data-averaging curve, 33–34
Delete the Selection List, 22
Delete this Test Point, 27
Denote point of max. dens./opt. moist. on charts, 10
density
entering test data for, 26
oversize correction, 14
units, 11
Density units, 11
disclaimer, see chart report: disclaimer on
Draw extrapolated one-point curves on chart reports, 9
Draw one-point test match curves on chart reports, 9
Drop ’Checked by’ from reports, 8
Drop ’Tested by’ from reports, 7
DXF, see .DXF
EMF, see .EMF
Excel, see xml files
export, 2, 37, 47
Export XML File, 47
exporting files, 17
field density, see Quality Control - Density
figure number, see chart report: figure number on
Hammer drop, 15
Hammer wt., 15
help, see technical support
hygroscopic moisture, 18
Include a disclaimer, 7
Layer name, 46
LD4, see boring log
left margin, 6
Make a selection list, 21–22
49
50
Index
margins, 2, 6
material description, 20
maximum density, 48
denoted on chart, 2
rounding, 3, 11, 13–14
units, 11
maximum dry density, 1
metafile, 37, see .EMF
moisture content
and CT-216 tests, 13, 28
averaging two per Proctor point, 26
container weights for, 6, 18
oversize, 25
oversize correction, 14
moisture-density
deleting test data, 27
entering test data, 23–28
moisture-density curve
one-point test curves, 8
previewing and modifying, 29–36
test points on, 33
width of, 8
Mold diameter, 15
Mold height, 15, 26
Mold volume, 15, 26
Navigation tab placement, 6
Number layers, 15
one-point compaction test, 9, 23
creating a moisture-density curve from, 35–36
optimum moisture content, 1, 48
rounding, 11, 13–14
Output Chart Report, 44–46
Output Data Summary Report, 44–46
oversize correction, 1, 12, 14–15, 30, 48
Oversize moisture, see moisture content: oversize
oversize percentage, 14, 25, 48
Path to exported files, 17
PDF, see .PDF
Percent oversize, see oversize percentage
Percent smaller than the #200 sieve, 25
Place files in, 46
Plot Curve Only, 33
Plot Test Points Only, 33
PNG, see .PNG
Preferred classification system, 8
Preview Forms, 39
Printed reports use color curves, 7
printing, 41
Proctor, see moisture-density
Prompt text color, 6
Quality Control - Density, 23
Report is on..., 46
Report is scaled in..., 46
www.geosystemsoftware.com
Report the uncorrected curve in addition to the corrected curve,
15, 30
Report the uncorrected results in addition to the corrected results, 14
report title, 8
Reset, 40
Reset Path to Default, 17
right margin, 6
rock correction, see oversize correction
Round max. density to, see maximum density: rounding
Round opt. moisture to, see optimum moisture content: rounding
Sample Info., 19–20
Scale start, 40
Scale step, 40
Select an appropriate ending..., 45
selection list, 21–22
shaping point, 31–32
Soil specific gravity, 24
specific gravity
bulk, 14, 25, 48
compaction test sample, 24, 48
ZAV curve, 24
Specification name, 13
spreadsheet, see xml files
Standard/modified/other, 13
summary report
defined, 37
how to print, 37, 43
in .PDF format, 17
margins on, 6
print settings, 44–46
support, see technical support
Tamper reading, 28
Tare, 27
Tare ID, 6, 18, 27
technical support, 4
Test method, 13
test specification, 1
editing, 11–15
exported variable name, 48
selecting for a compaction test, 24
tested by, see chart report: ’tested by’ on
This specification requires a unique rounding selection, 13–14
title, 8
top margin, 6
TrueType, 46
tutorial, 4
units
density, 11
for compaction test mold volumes, 26
for compaction test mold weights, 26
for CT-216 soil weights, 28
Units for mold weights, see units: for compaction test mold
weights
Proctor by GEOSYSTEM Software
Proctor User’s Guide
51
Units for soil weights, see units: for CT-216 soil weights
Water added, 28
webserver, 2, 17
Wet wt. of soil, 28
Windows metafile, see .EMF
word processor, 2, 37
Wt. d+t, 27
Wt. mold, 26
Wt. mold+soil, 26
Wt. w+t, 27
xml files
automatically creating, 17
creating, 2, 47
defined, 37
ZAV, see zero air voids
zero air voids, 24, 41
Copyright 2005-2009 GEOSYSTEM Software, Inc.
http://geosystemsoftware.com/support.htm