1
Talkwalker
Talkwalker | 14, rue Aldringen | L-1118 Luxembourg
Updated July 2015
Table of Contents
Technical Requirements . . . . . . . . . . . . . . . . . . . . . . . . . . . . . . . . . . . . . . . . . . . . . . . . . . . . . . . . . . . . . . . . . . . . . . . . . . . . . . . . . . . . . . . . 1
Overview . . . . . . . . . . . . . . . . . . . . . . . . . . . . . . . . . . . . . . . . . . . . . . . . . . . . . . . . . . . . . . . . . . . . . . . . . . . . . . . . . . . . . . . . . . . . . . . . . . 1
Vocabulary . . . . . . . . . . . . . . . . . . . . . . . . . . . . . . . . . . . . . . . . . . . . . . . . . . . . . . . . . . . . . . . . . . . . . . . . . . . . . . . . . . . . . . . . . . . . . . . . . . . . 2
Project . . . . . . . . . . . . . . . . . . . . . . . . . . . . . . . . . . . . . . . . . . . . . . . . . . . . . . . . . . . . . . . . . . . . . . . . . . . . . . . . . . . . . . . . . . . . . . . . . . . . . 2
Topic . . . . . . . . . . . . . . . . . . . . . . . . . . . . . . . . . . . . . . . . . . . . . . . . . . . . . . . . . . . . . . . . . . . . . . . . . . . . . . . . . . . . . . . . . . . . . . . . . . . . . . 2
Channels . . . . . . . . . . . . . . . . . . . . . . . . . . . . . . . . . . . . . . . . . . . . . . . . . . . . . . . . . . . . . . . . . . . . . . . . . . . . . . . . . . . . . . . . . . . . . . . . . . . 2
Filter . . . . . . . . . . . . . . . . . . . . . . . . . . . . . . . . . . . . . . . . . . . . . . . . . . . . . . . . . . . . . . . . . . . . . . . . . . . . . . . . . . . . . . . . . . . . . . . . . . . . . . 2
Dashboard . . . . . . . . . . . . . . . . . . . . . . . . . . . . . . . . . . . . . . . . . . . . . . . . . . . . . . . . . . . . . . . . . . . . . . . . . . . . . . . . . . . . . . . . . . . . . . . . . 2
Compare . . . . . . . . . . . . . . . . . . . . . . . . . . . . . . . . . . . . . . . . . . . . . . . . . . . . . . . . . . . . . . . . . . . . . . . . . . . . . . . . . . . . . . . . . . . . . . . . . . . 3
Engagement . . . . . . . . . . . . . . . . . . . . . . . . . . . . . . . . . . . . . . . . . . . . . . . . . . . . . . . . . . . . . . . . . . . . . . . . . . . . . . . . . . . . . . . . . . . . . . . . 3
Reach . . . . . . . . . . . . . . . . . . . . . . . . . . . . . . . . . . . . . . . . . . . . . . . . . . . . . . . . . . . . . . . . . . . . . . . . . . . . . . . . . . . . . . . . . . . . . . . . . . . . . . 3
An Overview of Talkwalker . . . . . . . . . . . . . . . . . . . . . . . . . . . . . . . . . . . . . . . . . . . . . . . . . . . . . . . . . . . . . . . . . . . . . . . . . . . . . . . . . . . . . 4
Background & functionalities . . . . . . . . . . . . . . . . . . . . . . . . . . . . . . . . . . . . . . . . . . . . . . . . . . . . . . . . . . . . . . . . . . . . . . . . . . . . . . . . 4
What the Twitter Certified Program means to our users and clients . . . . . . . . . . . . . . . . . . . . . . . . . . . . . . . . . . . . . . . . . . . . . 4
What makes Talkwalker stand out: . . . . . . . . . . . . . . . . . . . . . . . . . . . . . . . . . . . . . . . . . . . . . . . . . . . . . . . . . . . . . . . . . . . . . . . . . . . 5
Home Screen . . . . . . . . . . . . . . . . . . . . . . . . . . . . . . . . . . . . . . . . . . . . . . . . . . . . . . . . . . . . . . . . . . . . . . . . . . . . . . . . . . . . . . . . . . . . . . . 5
Analytics . . . . . . . . . . . . . . . . . . . . . . . . . . . . . . . . . . . . . . . . . . . . . . . . . . . . . . . . . . . . . . . . . . . . . . . . . . . . . . . . . . . . . . . . . . . . . . . . . . . 6
Reports . . . . . . . . . . . . . . . . . . . . . . . . . . . . . . . . . . . . . . . . . . . . . . . . . . . . . . . . . . . . . . . . . . . . . . . . . . . . . . . . . . . . . . . . . . . . . . . . . . . 10
Dashboards . . . . . . . . . . . . . . . . . . . . . . . . . . . . . . . . . . . . . . . . . . . . . . . . . . . . . . . . . . . . . . . . . . . . . . . . . . . . . . . . . . . . . . . . . . . . . . . 11
Talkwalker IQ Apps . . . . . . . . . . . . . . . . . . . . . . . . . . . . . . . . . . . . . . . . . . . . . . . . . . . . . . . . . . . . . . . . . . . . . . . . . . . . . . . . . . . . . . . . 11
Setup . . . . . . . . . . . . . . . . . . . . . . . . . . . . . . . . . . . . . . . . . . . . . . . . . . . . . . . . . . . . . . . . . . . . . . . . . . . . . . . . . . . . . . . . . . . . . . . . . . . . . 12
Home Screen . . . . . . . . . . . . . . . . . . . . . . . . . . . . . . . . . . . . . . . . . . . . . . . . . . . . . . . . . . . . . . . . . . . . . . . . . . . . . . . . . . . . . . . . . . . . . . . . . 13
Overview . . . . . . . . . . . . . . . . . . . . . . . . . . . . . . . . . . . . . . . . . . . . . . . . . . . . . . . . . . . . . . . . . . . . . . . . . . . . . . . . . . . . . . . . . . . . . . . . . 13
Notification centre . . . . . . . . . . . . . . . . . . . . . . . . . . . . . . . . . . . . . . . . . . . . . . . . . . . . . . . . . . . . . . . . . . . . . . . . . . . . . . . . . . . . . . . . . 14
User settings . . . . . . . . . . . . . . . . . . . . . . . . . . . . . . . . . . . . . . . . . . . . . . . . . . . . . . . . . . . . . . . . . . . . . . . . . . . . . . . . . . . . . . . . . . . . . . 14
My User Settings . . . . . . . . . . . . . . . . . . . . . . . . . . . . . . . . . . . . . . . . . . . . . . . . . . . . . . . . . . . . . . . . . . . . . . . . . . . . . . . . . . . . . . . . . . . 14
Help: . . . . . . . . . . . . . . . . . . . . . . . . . . . . . . . . . . . . . . . . . . . . . . . . . . . . . . . . . . . . . . . . . . . . . . . . . . . . . . . . . . . . . . . . . . . . . . . . . . . . . 16
Logout: . . . . . . . . . . . . . . . . . . . . . . . . . . . . . . . . . . . . . . . . . . . . . . . . . . . . . . . . . . . . . . . . . . . . . . . . . . . . . . . . . . . . . . . . . . . . . . . . . . . 16
Analytics Overview . . . . . . . . . . . . . . . . . . . . . . . . . . . . . . . . . . . . . . . . . . . . . . . . . . . . . . . . . . . . . . . . . . . . . . . . . . . . . . . . . . . . . . . . . . . 17
Overview . . . . . . . . . . . . . . . . . . . . . . . . . . . . . . . . . . . . . . . . . . . . . . . . . . . . . . . . . . . . . . . . . . . . . . . . . . . . . . . . . . . . . . . . . . . . . . . . . 17
Predefined Filters . . . . . . . . . . . . . . . . . . . . . . . . . . . . . . . . . . . . . . . . . . . . . . . . . . . . . . . . . . . . . . . . . . . . . . . . . . . . . . . . . . . . . . . . . . . . . 19
Overview . . . . . . . . . . . . . . . . . . . . . . . . . . . . . . . . . . . . . . . . . . . . . . . . . . . . . . . . . . . . . . . . . . . . . . . . . . . . . . . . . . . . . . . . . . . . . . . . . 19
Navigation Bar . . . . . . . . . . . . . . . . . . . . . . . . . . . . . . . . . . . . . . . . . . . . . . . . . . . . . . . . . . . . . . . . . . . . . . . . . . . . . . . . . . . . . . . . . . . . . . . 22
Overview:. . . . . . . . . . . . . . . . . . . . . . . . . . . . . . . . . . . . . . . . . . . . . . . . . . . . . . . . . . . . . . . . . . . . . . . . . . . . . . . . . . . . . . . . . . . . . . . . . 22
Results. . . . . . . . . . . . . . . . . . . . . . . . . . . . . . . . . . . . . . . . . . . . . . . . . . . . . . . . . . . . . . . . . . . . . . . . . . . . . . . . . . . . . . . . . . . . . . . . . . . . 22
Performance: . . . . . . . . . . . . . . . . . . . . . . . . . . . . . . . . . . . . . . . . . . . . . . . . . . . . . . . . . . . . . . . . . . . . . . . . . . . . . . . . . . . . . . . . . . . . . 28
Influencers: . . . . . . . . . . . . . . . . . . . . . . . . . . . . . . . . . . . . . . . . . . . . . . . . . . . . . . . . . . . . . . . . . . . . . . . . . . . . . . . . . . . . . . . . . . . . . . . 30
Sentiment . . . . . . . . . . . . . . . . . . . . . . . . . . . . . . . . . . . . . . . . . . . . . . . . . . . . . . . . . . . . . . . . . . . . . . . . . . . . . . . . . . . . . . . . . . . . . . . . . 31
Themes . . . . . . . . . . . . . . . . . . . . . . . . . . . . . . . . . . . . . . . . . . . . . . . . . . . . . . . . . . . . . . . . . . . . . . . . . . . . . . . . . . . . . . . . . . . . . . . . . . . 32
Demographics . . . . . . . . . . . . . . . . . . . . . . . . . . . . . . . . . . . . . . . . . . . . . . . . . . . . . . . . . . . . . . . . . . . . . . . . . . . . . . . . . . . . . . . . . . . . . 33
World Map . . . . . . . . . . . . . . . . . . . . . . . . . . . . . . . . . . . . . . . . . . . . . . . . . . . . . . . . . . . . . . . . . . . . . . . . . . . . . . . . . . . . . . . . . . . . . . . . 35
Navigation Bar - Channels: . . . . . . . . . . . . . . . . . . . . . . . . . . . . . . . . . . . . . . . . . . . . . . . . . . . . . . . . . . . . . . . . . . . . . . . . . . . . . . . . . 37
Compare Bar . . . . . . . . . . . . . . . . . . . . . . . . . . . . . . . . . . . . . . . . . . . . . . . . . . . . . . . . . . . . . . . . . . . . . . . . . . . . . . . . . . . . . . . . . . . . . . . . . 40
Overview . . . . . . . . . . . . . . . . . . . . . . . . . . . . . . . . . . . . . . . . . . . . . . . . . . . . . . . . . . . . . . . . . . . . . . . . . . . . . . . . . . . . . . . . . . . . . . . . . 40
Widgets Overview . . . . . . . . . . . . . . . . . . . . . . . . . . . . . . . . . . . . . . . . . . . . . . . . . . . . . . . . . . . . . . . . . . . . . . . . . . . . . . . . . . . . . . . . . . . . 42
Widget Options . . . . . . . . . . . . . . . . . . . . . . . . . . . . . . . . . . . . . . . . . . . . . . . . . . . . . . . . . . . . . . . . . . . . . . . . . . . . . . . . . . . . . . . . . . . . 42
Page Actions . . . . . . . . . . . . . . . . . . . . . . . . . . . . . . . . . . . . . . . . . . . . . . . . . . . . . . . . . . . . . . . . . . . . . . . . . . . . . . . . . . . . . . . . . . . . . . . . . . 47
Overview . . . . . . . . . . . . . . . . . . . . . . . . . . . . . . . . . . . . . . . . . . . . . . . . . . . . . . . . . . . . . . . . . . . . . . . . . . . . . . . . . . . . . . . . . . . . . . . . . 47
Refresh . . . . . . . . . . . . . . . . . . . . . . . . . . . . . . . . . . . . . . . . . . . . . . . . . . . . . . . . . . . . . . . . . . . . . . . . . . . . . . . . . . . . . . . . . . . . . . . . . . . 47
Add to Dashboard . . . . . . . . . . . . . . . . . . . . . . . . . . . . . . . . . . . . . . . . . . . . . . . . . . . . . . . . . . . . . . . . . . . . . . . . . . . . . . . . . . . . . . . . . 47
Add to Report . . . . . . . . . . . . . . . . . . . . . . . . . . . . . . . . . . . . . . . . . . . . . . . . . . . . . . . . . . . . . . . . . . . . . . . . . . . . . . . . . . . . . . . . . . . . . 47
Create Alert . . . . . . . . . . . . . . . . . . . . . . . . . . . . . . . . . . . . . . . . . . . . . . . . . . . . . . . . . . . . . . . . . . . . . . . . . . . . . . . . . . . . . . . . . . . . . . . 47
Bookmarks . . . . . . . . . . . . . . . . . . . . . . . . . . . . . . . . . . . . . . . . . . . . . . . . . . . . . . . . . . . . . . . . . . . . . . . . . . . . . . . . . . . . . . . . . . . . . . . . . . . 48
Overview . . . . . . . . . . . . . . . . . . . . . . . . . . . . . . . . . . . . . . . . . . . . . . . . . . . . . . . . . . . . . . . . . . . . . . . . . . . . . . . . . . . . . . . . . . . . . . . . . 48
Reporting Overview . . . . . . . . . . . . . . . . . . . . . . . . . . . . . . . . . . . . . . . . . . . . . . . . . . . . . . . . . . . . . . . . . . . . . . . . . . . . . . . . . . . . . . . . . . . 49
Overview . . . . . . . . . . . . . . . . . . . . . . . . . . . . . . . . . . . . . . . . . . . . . . . . . . . . . . . . . . . . . . . . . . . . . . . . . . . . . . . . . . . . . . . . . . . . . . . . . 49
How to create a new Report . . . . . . . . . . . . . . . . . . . . . . . . . . . . . . . . . . . . . . . . . . . . . . . . . . . . . . . . . . . . . . . . . . . . . . . . . . . . . . . . 49
Reports . . . . . . . . . . . . . . . . . . . . . . . . . . . . . . . . . . . . . . . . . . . . . . . . . . . . . . . . . . . . . . . . . . . . . . . . . . . . . . . . . . . . . . . . . . . . . . . . . . . . . . 50
Overview . . . . . . . . . . . . . . . . . . . . . . . . . . . . . . . . . . . . . . . . . . . . . . . . . . . . . . . . . . . . . . . . . . . . . . . . . . . . . . . . . . . . . . . . . . . . . . . . . 50
Main Table . . . . . . . . . . . . . . . . . . . . . . . . . . . . . . . . . . . . . . . . . . . . . . . . . . . . . . . . . . . . . . . . . . . . . . . . . . . . . . . . . . . . . . . . . . . . . . . . 50
Reports History. . . . . . . . . . . . . . . . . . . . . . . . . . . . . . . . . . . . . . . . . . . . . . . . . . . . . . . . . . . . . . . . . . . . . . . . . . . . . . . . . . . . . . . . . . . . 57
Topics . . . . . . . . . . . . . . . . . . . . . . . . . . . . . . . . . . . . . . . . . . . . . . . . . . . . . . . . . . . . . . . . . . . . . . . . . . . . . . . . . . . . . . . . . . . . . . . . . . . . . . . 58
Overview . . . . . . . . . . . . . . . . . . . . . . . . . . . . . . . . . . . . . . . . . . . . . . . . . . . . . . . . . . . . . . . . . . . . . . . . . . . . . . . . . . . . . . . . . . . . . . . . . 58
Channels . . . . . . . . . . . . . . . . . . . . . . . . . . . . . . . . . . . . . . . . . . . . . . . . . . . . . . . . . . . . . . . . . . . . . . . . . . . . . . . . . . . . . . . . . . . . . . . . . . . . . 60
Overview . . . . . . . . . . . . . . . . . . . . . . . . . . . . . . . . . . . . . . . . . . . . . . . . . . . . . . . . . . . . . . . . . . . . . . . . . . . . . . . . . . . . . . . . . . . . . . . . . 60
Available Channels . . . . . . . . . . . . . . . . . . . . . . . . . . . . . . . . . . . . . . . . . . . . . . . . . . . . . . . . . . . . . . . . . . . . . . . . . . . . . . . . . . . . . . . . . . . 64
General . . . . . . . . . . . . . . . . . . . . . . . . . . . . . . . . . . . . . . . . . . . . . . . . . . . . . . . . . . . . . . . . . . . . . . . . . . . . . . . . . . . . . . . . . . . . . . . . . . . 64
Facebook . . . . . . . . . . . . . . . . . . . . . . . . . . . . . . . . . . . . . . . . . . . . . . . . . . . . . . . . . . . . . . . . . . . . . . . . . . . . . . . . . . . . . . . . . . . . . . . . . 64
Twitter . . . . . . . . . . . . . . . . . . . . . . . . . . . . . . . . . . . . . . . . . . . . . . . . . . . . . . . . . . . . . . . . . . . . . . . . . . . . . . . . . . . . . . . . . . . . . . . . . . . 64
Google+ . . . . . . . . . . . . . . . . . . . . . . . . . . . . . . . . . . . . . . . . . . . . . . . . . . . . . . . . . . . . . . . . . . . . . . . . . . . . . . . . . . . . . . . . . . . . . . . . . . . 64
YouTube . . . . . . . . . . . . . . . . . . . . . . . . . . . . . . . . . . . . . . . . . . . . . . . . . . . . . . . . . . . . . . . . . . . . . . . . . . . . . . . . . . . . . . . . . . . . . . . . . . 64
Flickr . . . . . . . . . . . . . . . . . . . . . . . . . . . . . . . . . . . . . . . . . . . . . . . . . . . . . . . . . . . . . . . . . . . . . . . . . . . . . . . . . . . . . . . . . . . . . . . . . . . . . 65
Foursquare . . . . . . . . . . . . . . . . . . . . . . . . . . . . . . . . . . . . . . . . . . . . . . . . . . . . . . . . . . . . . . . . . . . . . . . . . . . . . . . . . . . . . . . . . . . . . . . 65
Instagram . . . . . . . . . . . . . . . . . . . . . . . . . . . . . . . . . . . . . . . . . . . . . . . . . . . . . . . . . . . . . . . . . . . . . . . . . . . . . . . . . . . . . . . . . . . . . . . . . 65
Mixcloud . . . . . . . . . . . . . . . . . . . . . . . . . . . . . . . . . . . . . . . . . . . . . . . . . . . . . . . . . . . . . . . . . . . . . . . . . . . . . . . . . . . . . . . . . . . . . . . . . 66
SoundCloud . . . . . . . . . . . . . . . . . . . . . . . . . . . . . . . . . . . . . . . . . . . . . . . . . . . . . . . . . . . . . . . . . . . . . . . . . . . . . . . . . . . . . . . . . . . . . . . 66
Vimeo . . . . . . . . . . . . . . . . . . . . . . . . . . . . . . . . . . . . . . . . . . . . . . . . . . . . . . . . . . . . . . . . . . . . . . . . . . . . . . . . . . . . . . . . . . . . . . . . . . . . 66
Dailymotion . . . . . . . . . . . . . . . . . . . . . . . . . . . . . . . . . . . . . . . . . . . . . . . . . . . . . . . . . . . . . . . . . . . . . . . . . . . . . . . . . . . . . . . . . . . . . . . 67
Weibo . . . . . . . . . . . . . . . . . . . . . . . . . . . . . . . . . . . . . . . . . . . . . . . . . . . . . . . . . . . . . . . . . . . . . . . . . . . . . . . . . . . . . . . . . . . . . . . . . . . . 67
Newsletter . . . . . . . . . . . . . . . . . . . . . . . . . . . . . . . . . . . . . . . . . . . . . . . . . . . . . . . . . . . . . . . . . . . . . . . . . . . . . . . . . . . . . . . . . . . . . . . . 68
External URL . . . . . . . . . . . . . . . . . . . . . . . . . . . . . . . . . . . . . . . . . . . . . . . . . . . . . . . . . . . . . . . . . . . . . . . . . . . . . . . . . . . . . . . . . . . . . . 68
Filters. . . . . . . . . . . . . . . . . . . . . . . . . . . . . . . . . . . . . . . . . . . . . . . . . . . . . . . . . . . . . . . . . . . . . . . . . . . . . . . . . . . . . . . . . . . . . . . . . . . . . . . . 70
Overview . . . . . . . . . . . . . . . . . . . . . . . . . . . . . . . . . . . . . . . . . . . . . . . . . . . . . . . . . . . . . . . . . . . . . . . . . . . . . . . . . . . . . . . . . . . . . . . . . 70
Events . . . . . . . . . . . . . . . . . . . . . . . . . . . . . . . . . . . . . . . . . . . . . . . . . . . . . . . . . . . . . . . . . . . . . . . . . . . . . . . . . . . . . . . . . . . . . . . . . . . . . . . 71
Overview . . . . . . . . . . . . . . . . . . . . . . . . . . . . . . . . . . . . . . . . . . . . . . . . . . . . . . . . . . . . . . . . . . . . . . . . . . . . . . . . . . . . . . . . . . . . . . . . . 71
Project Settings Overview . . . . . . . . . . . . . . . . . . . . . . . . . . . . . . . . . . . . . . . . . . . . . . . . . . . . . . . . . . . . . . . . . . . . . . . . . . . . . . . . . . . . . 73
Overview . . . . . . . . . . . . . . . . . . . . . . . . . . . . . . . . . . . . . . . . . . . . . . . . . . . . . . . . . . . . . . . . . . . . . . . . . . . . . . . . . . . . . . . . . . . . . . . . . 73
General Settings . . . . . . . . . . . . . . . . . . . . . . . . . . . . . . . . . . . . . . . . . . . . . . . . . . . . . . . . . . . . . . . . . . . . . . . . . . . . . . . . . . . . . . . . . . . 73
Social Media Accounts . . . . . . . . . . . . . . . . . . . . . . . . . . . . . . . . . . . . . . . . . . . . . . . . . . . . . . . . . . . . . . . . . . . . . . . . . . . . . . . . . . . . . . . . . 76
Overview . . . . . . . . . . . . . . . . . . . . . . . . . . . . . . . . . . . . . . . . . . . . . . . . . . . . . . . . . . . . . . . . . . . . . . . . . . . . . . . . . . . . . . . . . . . . . . . . . 76
Bookmarks . . . . . . . . . . . . . . . . . . . . . . . . . . . . . . . . . . . . . . . . . . . . . . . . . . . . . . . . . . . . . . . . . . . . . . . . . . . . . . . . . . . . . . . . . . . . . . . . . . . 78
Overview . . . . . . . . . . . . . . . . . . . . . . . . . . . . . . . . . . . . . . . . . . . . . . . . . . . . . . . . . . . . . . . . . . . . . . . . . . . . . . . . . . . . . . . . . . . . . . . . . 78
Embedded Widgets . . . . . . . . . . . . . . . . . . . . . . . . . . . . . . . . . . . . . . . . . . . . . . . . . . . . . . . . . . . . . . . . . . . . . . . . . . . . . . . . . . . . . . . . . . . 79
Overview . . . . . . . . . . . . . . . . . . . . . . . . . . . . . . . . . . . . . . . . . . . . . . . . . . . . . . . . . . . . . . . . . . . . . . . . . . . . . . . . . . . . . . . . . . . . . . . . . 79
Edit Embedded Widget Settings: . . . . . . . . . . . . . . . . . . . . . . . . . . . . . . . . . . . . . . . . . . . . . . . . . . . . . . . . . . . . . . . . . . . . . . . . . . . . 79
Delete Embedded Widget: . . . . . . . . . . . . . . . . . . . . . . . . . . . . . . . . . . . . . . . . . . . . . . . . . . . . . . . . . . . . . . . . . . . . . . . . . . . . . . . . . . 80
Refresh Widget: . . . . . . . . . . . . . . . . . . . . . . . . . . . . . . . . . . . . . . . . . . . . . . . . . . . . . . . . . . . . . . . . . . . . . . . . . . . . . . . . . . . . . . . . . . . 80
Events . . . . . . . . . . . . . . . . . . . . . . . . . . . . . . . . . . . . . . . . . . . . . . . . . . . . . . . . . . . . . . . . . . . . . . . . . . . . . . . . . . . . . . . . . . . . . . . . . . . . . . . 81
What is an event? . . . . . . . . . . . . . . . . . . . . . . . . . . . . . . . . . . . . . . . . . . . . . . . . . . . . . . . . . . . . . . . . . . . . . . . . . . . . . . . . . . . . . . . . . 81
Where do I find events in Talkwalker? . . . . . . . . . . . . . . . . . . . . . . . . . . . . . . . . . . . . . . . . . . . . . . . . . . . . . . . . . . . . . . . . . . . . . . 81
How to set-up a new event? . . . . . . . . . . . . . . . . . . . . . . . . . . . . . . . . . . . . . . . . . . . . . . . . . . . . . . . . . . . . . . . . . . . . . . . . . . . . . . . . 82
Sources . . . . . . . . . . . . . . . . . . . . . . . . . . . . . . . . . . . . . . . . . . . . . . . . . . . . . . . . . . . . . . . . . . . . . . . . . . . . . . . . . . . . . . . . . . . . . . . . . . . . . . 84
Overview . . . . . . . . . . . . . . . . . . . . . . . . . . . . . . . . . . . . . . . . . . . . . . . . . . . . . . . . . . . . . . . . . . . . . . . . . . . . . . . . . . . . . . . . . . . . . . . . . 84
Custom panels. . . . . . . . . . . . . . . . . . . . . . . . . . . . . . . . . . . . . . . . . . . . . . . . . . . . . . . . . . . . . . . . . . . . . . . . . . . . . . . . . . . . . . . . . . . . . 84
Pre-defined panels . . . . . . . . . . . . . . . . . . . . . . . . . . . . . . . . . . . . . . . . . . . . . . . . . . . . . . . . . . . . . . . . . . . . . . . . . . . . . . . . . . . . . . . . . 85
Export . . . . . . . . . . . . . . . . . . . . . . . . . . . . . . . . . . . . . . . . . . . . . . . . . . . . . . . . . . . . . . . . . . . . . . . . . . . . . . . . . . . . . . . . . . . . . . . . . . . . 86
Import . . . . . . . . . . . . . . . . . . . . . . . . . . . . . . . . . . . . . . . . . . . . . . . . . . . . . . . . . . . . . . . . . . . . . . . . . . . . . . . . . . . . . . . . . . . . . . . . . . . . 87
Tags . . . . . . . . . . . . . . . . . . . . . . . . . . . . . . . . . . . . . . . . . . . . . . . . . . . . . . . . . . . . . . . . . . . . . . . . . . . . . . . . . . . . . . . . . . . . . . . . . . . . . . . . . 88
Overview . . . . . . . . . . . . . . . . . . . . . . . . . . . . . . . . . . . . . . . . . . . . . . . . . . . . . . . . . . . . . . . . . . . . . . . . . . . . . . . . . . . . . . . . . . . . . . . . . 88
How to create a new tag? . . . . . . . . . . . . . . . . . . . . . . . . . . . . . . . . . . . . . . . . . . . . . . . . . . . . . . . . . . . . . . . . . . . . . . . . . . . . . . . . . . . 88
How do I create a new tag with 2 dimensions? . . . . . . . . . . . . . . . . . . . . . . . . . . . . . . . . . . . . . . . . . . . . . . . . . . . . . . . . . . . . . . . 88
How to add to an article a tag that already exists? . . . . . . . . . . . . . . . . . . . . . . . . . . . . . . . . . . . . . . . . . . . . . . . . . . . . . . . . . . . . 89
Manage tags. . . . . . . . . . . . . . . . . . . . . . . . . . . . . . . . . . . . . . . . . . . . . . . . . . . . . . . . . . . . . . . . . . . . . . . . . . . . . . . . . . . . . . . . . . . . . . . 89
Themes . . . . . . . . . . . . . . . . . . . . . . . . . . . . . . . . . . . . . . . . . . . . . . . . . . . . . . . . . . . . . . . . . . . . . . . . . . . . . . . . . . . . . . . . . . . . . . . . . . . . . . 90
Overview . . . . . . . . . . . . . . . . . . . . . . . . . . . . . . . . . . . . . . . . . . . . . . . . . . . . . . . . . . . . . . . . . . . . . . . . . . . . . . . . . . . . . . . . . . . . . . . . . 90
Custom theme panels . . . . . . . . . . . . . . . . . . . . . . . . . . . . . . . . . . . . . . . . . . . . . . . . . . . . . . . . . . . . . . . . . . . . . . . . . . . . . . . . . . . . . . 90
How do I create a custom theme panel? . . . . . . . . . . . . . . . . . . . . . . . . . . . . . . . . . . . . . . . . . . . . . . . . . . . . . . . . . . . . . . . . . . . . . 90
Where do I find my custom theme cloud? . . . . . . . . . . . . . . . . . . . . . . . . . . . . . . . . . . . . . . . . . . . . . . . . . . . . . . . . . . . . . . . . . . . . 90
Pre-defined theme panels . . . . . . . . . . . . . . . . . . . . . . . . . . . . . . . . . . . . . . . . . . . . . . . . . . . . . . . . . . . . . . . . . . . . . . . . . . . . . . . . . . 90
Export . . . . . . . . . . . . . . . . . . . . . . . . . . . . . . . . . . . . . . . . . . . . . . . . . . . . . . . . . . . . . . . . . . . . . . . . . . . . . . . . . . . . . . . . . . . . . . . . . . . . 90
Import . . . . . . . . . . . . . . . . . . . . . . . . . . . . . . . . . . . . . . . . . . . . . . . . . . . . . . . . . . . . . . . . . . . . . . . . . . . . . . . . . . . . . . . . . . . . . . . . . . . . 91
Import Documents . . . . . . . . . . . . . . . . . . . . . . . . . . . . . . . . . . . . . . . . . . . . . . . . . . . . . . . . . . . . . . . . . . . . . . . . . . . . . . . . . . . . . . . . . . . . 92
Overview . . . . . . . . . . . . . . . . . . . . . . . . . . . . . . . . . . . . . . . . . . . . . . . . . . . . . . . . . . . . . . . . . . . . . . . . . . . . . . . . . . . . . . . . . . . . . . . . . 92
Project . . . . . . . . . . . . . . . . . . . . . . . . . . . . . . . . . . . . . . . . . . . . . . . . . . . . . . . . . . . . . . . . . . . . . . . . . . . . . . . . . . . . . . . . . . . . . . . . . . . . . . . 93
Overview . . . . . . . . . . . . . . . . . . . . . . . . . . . . . . . . . . . . . . . . . . . . . . . . . . . . . . . . . . . . . . . . . . . . . . . . . . . . . . . . . . . . . . . . . . . . . . . . . 93
Users . . . . . . . . . . . . . . . . . . . . . . . . . . . . . . . . . . . . . . . . . . . . . . . . . . . . . . . . . . . . . . . . . . . . . . . . . . . . . . . . . . . . . . . . . . . . . . . . . . . . . . . . 95
Overview . . . . . . . . . . . . . . . . . . . . . . . . . . . . . . . . . . . . . . . . . . . . . . . . . . . . . . . . . . . . . . . . . . . . . . . . . . . . . . . . . . . . . . . . . . . . . . . . . 95
Api Settings . . . . . . . . . . . . . . . . . . . . . . . . . . . . . . . . . . . . . . . . . . . . . . . . . . . . . . . . . . . . . . . . . . . . . . . . . . . . . . . . . . . . . . . . . . . . . . . . . . 97
Overview . . . . . . . . . . . . . . . . . . . . . . . . . . . . . . . . . . . . . . . . . . . . . . . . . . . . . . . . . . . . . . . . . . . . . . . . . . . . . . . . . . . . . . . . . . . . . . . . . 97
Access Tokens . . . . . . . . . . . . . . . . . . . . . . . . . . . . . . . . . . . . . . . . . . . . . . . . . . . . . . . . . . . . . . . . . . . . . . . . . . . . . . . . . . . . . . . . . . . . . 97
Credits . . . . . . . . . . . . . . . . . . . . . . . . . . . . . . . . . . . . . . . . . . . . . . . . . . . . . . . . . . . . . . . . . . . . . . . . . . . . . . . . . . . . . . . . . . . . . . . . . . . . 97
Mailing Lists. . . . . . . . . . . . . . . . . . . . . . . . . . . . . . . . . . . . . . . . . . . . . . . . . . . . . . . . . . . . . . . . . . . . . . . . . . . . . . . . . . . . . . . . . . . . . . . . . . 98
Overview . . . . . . . . . . . . . . . . . . . . . . . . . . . . . . . . . . . . . . . . . . . . . . . . . . . . . . . . . . . . . . . . . . . . . . . . . . . . . . . . . . . . . . . . . . . . . . . . . 98
Talkwalker IQ Apps . . . . . . . . . . . . . . . . . . . . . . . . . . . . . . . . . . . . . . . . . . . . . . . . . . . . . . . . . . . . . . . . . . . . . . . . . . . . . . . . . . . . . . . . . . . 99
Overview . . . . . . . . . . . . . . . . . . . . . . . . . . . . . . . . . . . . . . . . . . . . . . . . . . . . . . . . . . . . . . . . . . . . . . . . . . . . . . . . . . . . . . . . . . . . . . . . . 99
What are Talkwalker IQ Apps? . . . . . . . . . . . . . . . . . . . . . . . . . . . . . . . . . . . . . . . . . . . . . . . . . . . . . . . . . . . . . . . . . . . . . . . . . . . . . . 99
Talkwalker IQ App Options . . . . . . . . . . . . . . . . . . . . . . . . . . . . . . . . . . . . . . . . . . . . . . . . . . . . . . . . . . . . . . . . . . . . . . . . . . . . . . . . 100
Dashboards . . . . . . . . . . . . . . . . . . . . . . . . . . . . . . . . . . . . . . . . . . . . . . . . . . . . . . . . . . . . . . . . . . . . . . . . . . . . . . . . . . . . . . . . . . . . . . . . . 101
Dashboards overview . . . . . . . . . . . . . . . . . . . . . . . . . . . . . . . . . . . . . . . . . . . . . . . . . . . . . . . . . . . . . . . . . . . . . . . . . . . . . . . . . . . . . 101
How to create a Dashboard . . . . . . . . . . . . . . . . . . . . . . . . . . . . . . . . . . . . . . . . . . . . . . . . . . . . . . . . . . . . . . . . . . . . . . . . . . . . . . . . 101
How to add widgets to Dashboards . . . . . . . . . . . . . . . . . . . . . . . . . . . . . . . . . . . . . . . . . . . . . . . . . . . . . . . . . . . . . . . . . . . . . . . . . 103
How to edit dashboards . . . . . . . . . . . . . . . . . . . . . . . . . . . . . . . . . . . . . . . . . . . . . . . . . . . . . . . . . . . . . . . . . . . . . . . . . . . . . . . . . . . 105
Dashboard Options . . . . . . . . . . . . . . . . . . . . . . . . . . . . . . . . . . . . . . . . . . . . . . . . . . . . . . . . . . . . . . . . . . . . . . . . . . . . . . . . . . . . . . . 110
Fast Tagging . . . . . . . . . . . . . . . . . . . . . . . . . . . . . . . . . . . . . . . . . . . . . . . . . . . . . . . . . . . . . . . . . . . . . . . . . . . . . . . . . . . . . . . . . . . . . . . . . 112
Overview . . . . . . . . . . . . . . . . . . . . . . . . . . . . . . . . . . . . . . . . . . . . . . . . . . . . . . . . . . . . . . . . . . . . . . . . . . . . . . . . . . . . . . . . . . . . . . . . 112
Navigation Shortcuts: . . . . . . . . . . . . . . . . . . . . . . . . . . . . . . . . . . . . . . . . . . . . . . . . . . . . . . . . . . . . . . . . . . . . . . . . . . . . . . . . . . . . . 112
Fast Tagging . . . . . . . . . . . . . . . . . . . . . . . . . . . . . . . . . . . . . . . . . . . . . . . . . . . . . . . . . . . . . . . . . . . . . . . . . . . . . . . . . . . . . . . . . . . . . 112
Glossary . . . . . . . . . . . . . . . . . . . . . . . . . . . . . . . . . . . . . . . . . . . . . . . . . . . . . . . . . . . . . . . . . . . . . . . . . . . . . . . . . . . . . . . . . . . . . . . . . . . . 113
Overview . . . . . . . . . . . . . . . . . . . . . . . . . . . . . . . . . . . . . . . . . . . . . . . . . . . . . . . . . . . . . . . . . . . . . . . . . . . . . . . . . . . . . . . . . . . . . . . . 113
Appendix - Source Types . . . . . . . . . . . . . . . . . . . . . . . . . . . . . . . . . . . . . . . . . . . . . . . . . . . . . . . . . . . . . . . . . . . . . . . . . . . . . . . . . . . . . 116
Media Source Types . . . . . . . . . . . . . . . . . . . . . . . . . . . . . . . . . . . . . . . . . . . . . . . . . . . . . . . . . . . . . . . . . . . . . . . . . . . . . . . . . . . . . . 116
Language Codes . . . . . . . . . . . . . . . . . . . . . . . . . . . . . . . . . . . . . . . . . . . . . . . . . . . . . . . . . . . . . . . . . . . . . . . . . . . . . . . . . . . . . . . . . . . . . 117
Overview . . . . . . . . . . . . . . . . . . . . . . . . . . . . . . . . . . . . . . . . . . . . . . . . . . . . . . . . . . . . . . . . . . . . . . . . . . . . . . . . . . . . . . . . . . . . . . . . 117
Country Codes . . . . . . . . . . . . . . . . . . . . . . . . . . . . . . . . . . . . . . . . . . . . . . . . . . . . . . . . . . . . . . . . . . . . . . . . . . . . . . . . . . . . . . . . . . . . . . . 123
Overview . . . . . . . . . . . . . . . . . . . . . . . . . . . . . . . . . . . . . . . . . . . . . . . . . . . . . . . . . . . . . . . . . . . . . . . . . . . . . . . . . . . . . . . . . . . . . . . . 123
Talkwalker Query Syntax . . . . . . . . . . . . . . . . . . . . . . . . . . . . . . . . . . . . . . . . . . . . . . . . . . . . . . . . . . . . . . . . . . . . . . . . . . . . . . . . . . . . . 131
Special Transformations . . . . . . . . . . . . . . . . . . . . . . . . . . . . . . . . . . . . . . . . . . . . . . . . . . . . . . . . . . . . . . . . . . . . . . . . . . . . . . . . . . 131
Boolean Operators . . . . . . . . . . . . . . . . . . . . . . . . . . . . . . . . . . . . . . . . . . . . . . . . . . . . . . . . . . . . . . . . . . . . . . . . . . . . . . . . . . . . . . . . 131
Advanced Search Options: . . . . . . . . . . . . . . . . . . . . . . . . . . . . . . . . . . . . . . . . . . . . . . . . . . . . . . . . . . . . . . . . . . . . . . . . . . . . . . . . . 132
Url based Search . . . . . . . . . . . . . . . . . . . . . . . . . . . . . . . . . . . . . . . . . . . . . . . . . . . . . . . . . . . . . . . . . . . . . . . . . . . . . . . . . . . . . . . . . 133
Metric (Minimum / Maximum) Restrictions . . . . . . . . . . . . . . . . . . . . . . . . . . . . . . . . . . . . . . . . . . . . . . . . . . . . . . . . . . . . . . . . . 134
Geographic Restrictions . . . . . . . . . . . . . . . . . . . . . . . . . . . . . . . . . . . . . . . . . . . . . . . . . . . . . . . . . . . . . . . . . . . . . . . . . . . . . . . . . . . 135
Special Query Modifiers . . . . . . . . . . . . . . . . . . . . . . . . . . . . . . . . . . . . . . . . . . . . . . . . . . . . . . . . . . . . . . . . . . . . . . . . . . . . . . . . . . . 135
Technical Requirements
Overview
• Your browser must have Cookies and JavaScript enabled.
• We recommend that you use Chrome with the tool. Supported browsers are: Chrome; Firefox; and Internet Explorer
9.0 and higher.
• Your screen resolution must at least be 1024×768 dpi.
• You need to open your firewall for:
◦ www.talkwalker.com
◦ www.google.com (for graphs to display)
◦ www.facebook.com
◦ www.twitter.com
◦ www.youtube.com
◦ And also for all other supported social networks on the tool.
Vocabulary
Project
A project includes one or more topics, monitored pages and specific filters that are relevant to the monitoring of a brand
or a company. The project also contains specific project settings, such as sources to include in the results, and user
definitions.
Topic
A topic contains the keywords and phrases you wish to search for within posts and articles, in the form of search
queries.
The first topic is usually your brand and subsequent topics are typically competitor brands, in order to easily be able to
compare them. For some brands, setting up search queries can be very easy (Vodafone), whereas for other brands (Apple), it
can be slightly more complex.
Vodafone
Apple AND computer AND NOT fruit
Channels
Channels enables you to monitor specific pages without taking into consideration any keywords, meaning all data
published on the page will flow into the system.
Channels can be social media pages (Facebook pages, Twitter profiles, YouTube channels, etc.) or any other sites where
you want to monitor all the data being published.
Example: www.facebook.com/talkwalker
Filter
Filters enable you to add further restrictions to your topics. This can greatly help focus on one or more elements of the
results.
Example: “smells
good” OR “tastes good” OR “awesome taste” OR “best taste”
Dashboard
Dashboards enable you to display in one place the representations of the results that are key to your project. If you only
want to see the result articles, the sentiment produced by these results and the demographic spread of these, they can
all be added to one dashboard.
Compare
1-click comparison of all representations based on topics, filters, sentiment and many other criteria.
Engagement
The engagement of an article/post is the sum of actions made by others on that article/post. The engagement of a topic is
the sum of the engagement of all articles/posts of the topic.
Check out our Glossary for a detailed explanation of its computation.
Reach
The reach of an article/post represents the number of people who were reached by this article/post.
Check out our Glossary for a detailed explanation of its computation.
An Overview of Talkwalker
Background & functionalities
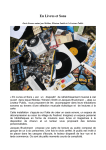
Talkwalker is an easy to use media monitoring tool allowing you to:
• Identify and monitor news as well as online conversations and mentions in real time
• Analyse social media to measure, assess and refine your social strategy and action plan
• Monitor and compare the performance and engagement of your social media profiles to those of your competition
• Export your results and display them in customized dashboards
• Determine the reach and engagement of your online presence and its evolution within a given time frame
• Use an automated notification system to quickly detect sensitive subjects
Talkwalker is a user-friendly and efficient platform used for collecting, analysing and benchmarking entire
conversations from more than 150 million sources. Theses sources are crawled daily and consist of online news, blogs,
forums, Facebook, Google+, Foursquare, Instagram, and Twitter.
Talkwalker is a SaaS (Software As A Service) accessible platform; it is accessible online via browser and does not require
the installation of a software program. The tool is supported by the common browsers if they are regularly updated
(Google Chrome, Mozilla Firefox, Internet Explorer, etc.) To access the platform, one can simply login using their
registered e-mail address and password.
Since June 2014, Talkwalker is one of the three European social monitoring tools to be accepted into the Twitter
Certified Program.. The Twitter Certified Products Program recognises social media analytics tools that are proven to
deliver exceptional value to their clients in leveraging Twitter to build sustainable value in and through social media.
What the Twitter Certified Program means to our users and
clients
You have privileged access to enhanced Twitter data, Twitter analytics and a powerful Twitter search tool, for various
purposes such as:
• Campaign measurement
• Risk management
• Influencer management
• Business intelligence capabilities
• and much more.
Developing our own technology allows us not only to control the data and the developments but also to continuously
adapt to the clients' needs and to release innovative new features every couple of months.
What makes Talkwalker stand out:
• Instantly get 30 days of historic data with the option of adding up to one year of historical data
• More than 50 KPIs to analyse the performance - for example the engagement, the sentiment or the buzz
• Customized filters allowing you to quickly sort the data
• Channels - monitor the publications on particular websites (corporate websites, blogs, Twitter or Facebook pages).
Channels which monitor Facebook and Twitter pages will also generate statistics about the audience’s activity, its
growth, page owner activity and many more
• Export and mail out of custom dashboards generated as PowerPoint, Word, or PDF documents
Home Screen
Upon login to the platform, one has access to their project(s) via the project Home Screen. The Home Screen is the heart
of the project and allows you to access and to mange:
• Project and Account Settings
• Topic Setup
• Reports and Alerts
• Pre-defined tools in Talkwalker IQ Apps
• Analytics
• Dashboards
Analytics
Queries selection:
Once in the Analytics screen, one can view one ore more topics simultaneously.
To select all existing topics grouped under one category, click on the group name
To select several topics from various groups, one can select them by clicking on each topic.
To reset a selection, click on a highlighted topic to remove it from the results
Filter selection:
Click on the "open filters" tab at the top of the Analytics screen.
In the drop-down menu multiple filters can be applied: media types, countries, languages, tags, custom filters, and date
filters
The results will automatically update with each filter applied
To close the filter menu, click on "close filters"
Filter examples:
Media types; limit the results to certain types of media only by selecting one or more source types (Facebook, blogs,
forums, Online news, Twitter, etc.)
Countries and languages; view the results of certain countries and/or languages only
Time filters; rolling dates or custom time frames: select rolling dates such as 1 day, 7 days, 30 days, 3 months, 6 months
or 1 year. Alternatively, customize the time frame by selecting dates or even hours and minutes
Tag filters: previously tagged results can be recalled by applying the tag filter
Comparison filters: the results can be compared by topics, media types, sentiment, countries, or language
Widgets
Talkwalker offers more than 50 different KPis to better analyse the performance
Each widget is customizable and can be viewed in different modes such as horizontal or vertical bar chart, table, line
chart, etc.
Channels
Channels enables you to monitor specific pages without taking into consideration any keywords, meaning all data
published on the page will flow into the system.
Channels can be social media pages (Facebook pages, Twitter profiles, YouTube channels, etc.) or any other sites where
you want to monitor all the data being published.
When monitoring particular social media profiles, Talkwalker also provides profile related statistics, such as "follower
growth", audience activity, owner activity, etc.+
Reports
Overview of possibilities
The Reports & Alerts menu allows you to manage all your reports in one place: create, send or schedule customised
reports such as Alerts or newsletters
All active reports appear on the main page of the menu, from where one can edit, duplicate, send, download or delete
the reports. The feature "report history" includes reports logs as as well deleted reports from where previously deleted
reports can be reactivated.
Customising reports
Decide when reports should be triggered: scheduled, new results, irregular activity or create your personal trigger
filters
Select an output format for each report: HTML, Word, or PowerPoint layouts are available
Subscribe and unsubscribe recipients from the active reports and easily manage your mailing lists
Customize the Alerts e-mails: e-mail subject, header and footer can be edited
Duplicate existing reports
Dashboards
The dashboard menu regroups all dashboards previously created
Each dashboard can be edited, copied, added to a report, and added to an Alert
Customizing dashboards
Dashboards and widget names and descriptions can be edited
Widgets can be removed, resized, moved around and edited
Talkwalker IQ Apps
Talkwalker IQ Apps answer specific user needs through pre-defined tools. The Talkwalker IQ Apps will save the user a
lot of time by automatically generating dashboards according to his or her needs.
Although Talkwalker IQ Apps dashboards are automatically created, they still are fully customizable: filters can be
applied, widget views can be changed and multiple topics can be applied to the pre-defined widgets
Setup
Topic setup
Create and/or edit search queries, channels, filters, and events
Project setup
Manage the general settings of a project as well as the sources, tags, themes, and more
Account settings
Manage account-level settings, projects, users, mailing lists, and more
Home Screen
Overview
When you first enter a project you will arrive at the Home Screen. This is the central location of any project which you
are able easily to navigate to all of the other sections of the project.
Within the top bar you are able to quickly navigate to the different areas of the project:
• Home
• Talkwalker IQ Apps
• Dashboards
• Reports
• Analytics and Settings
The double-down arrow gives quick access to your account settings and if you have more than one project it allows you
to enter any other project.
Notification centre
Notifications will appear here in relation to things which may be of interest to the user, such as newly implemented
features on the tool.
User settings
Clicking on your username in the top right-hand corner gives you access to the further options described below.
My User Settings
Within this section you are able to set up your Profile information and set your Authentication methods.
Profile
Profile of the user, including display and export preferences.
User Settings
Name: Enter in the first and last name for the user. This is the user name which will be displayed throughout the project
for the user.
Email: Enter in a valid email address, which is to be associated with the user. All email notifications for the user will be
sent to this email address.
Display settings:
Language: This is not only the language which the project will be displayed in, but is also the language in which your
exported data and results will be shown in. By default, this will be inherited across the project from the user setting.
Time zone: This is the time zone which your project calendar is set to and it is highly recommended that this is set to be
the same as your local time zone. This is the time that will be displayed in all of your exported results and graphs, and
also any other time specific parameters within your project. By default, this will be inherited across the project from the
user setting.
Date format: Select your preferred displayed date format style. All displayed results and exported data will use this date
format. The available options are: Choose the format you prefer the date to be displayed with. This is the same format
that will be used across the entirety of your project as well as your exported data and reports. By default, this will be
inherited across the project from the user setting. Available options are:
• dd/MM/yy
• dd.MM.yy
• MM/dd/yy
Keyboard layout: Chose the format of keyboard which you are using to access the tool. Any fast-tagging or keyboard
navigational shortcuts will be based upon the setup you select here. The available options are:
• QWERTZ (de)
• QWERTY (en)
• AZERTY (fr)
Show tooltips: When this is set to 'OFF' there will no longer be any tooltips, which lead to the User Manual in the
Talkwalker Academy, present within the project for you.
Export settings:
CSV format: Select the format in which you wish your CSV export files to be presented in. The available options are:
• Comma-separated (Standard)
• Semicolon-separated (German/French)
• Tab-separated
Character Encoding: Here you have the ability to select the encoding type which is correct for the characters contained
in the data which you’re exporting in CSV format.
Authentication:
Account Password:
Here you are able to change your password which you use to log onto your Talkwalker account. To change your
password simply enter in your current password, followed by your new password, with this password confirmed.
Additional Authentication Methods:
On top of the conventional username and password, Talkwalker offers the possibility to connect with external
authentication methods using Social Media logins. You are able to use your Facebook, Twitter, Google+ or LinkedIn
accounts to log in to the platform. Once you have associated one of these account with your Talkwalker account, you are
able to use them to log into your account with ease, instead of having to sign in by entering in the email address and
password associated with your Talkwalker account.
Talkwalker only uses the tokens provided here for authentication. Talkwalker will not use these
These tokens used for authentication are different to the tokens used for connection to social
tokens to post on your behalf.
networks to collect data. See Social Media Accounts section for more details.
Help:
This links to the User Manual for the tool within the Talkwalker Academy.
Logout:
Clicking on this will log out your account from Talkwalker.
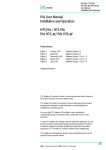
Analytics Overview
Overview
On the Analytics page you are able to see the results from the articles which match your search queries and also results
from any Channels that are set up. In addition to this, the different widgets presented to you on the Analytics screen will
show various analytical metrics which have been performed upon the results. All of the displayed widgets here can be
added to Dashboards and Reports that can be set up within your project.
1. Topics: Listed here are the topics that you have added to your project, with the numbers of results for the current
time period selected displayed next to them. You can have selected either one, or many topics to display at a time.
2. Channels: Displayed here are any Channels for monitoring which you’ve set up, with the numbers of results for the
current selected time period displayed next to them. You can have selected either one, or many channels to display
at a time.
3. Query Filters: You are able to set up keyword or query filters to be run against the articles found in your results, so
that you can further refine them and drill down to only display the exact needed results.
4. Predefined Filters: Open your filters here to select and choose which you wish to be actioned upon the displayed
results, such as languages, countries and time periods. Each of these filters can be pinned so that they always display
without the need of having to Open the Filters each time.
5. Navigation bar: You’re able to choose between 7 group types of visualisations for your results, each with widgets
displaying different representations of results data. When you have Channels selected there are up to an additional 4
tabs available for further deeper analysis of the data.
6. Comparison Bar: Here you can 1-click compare the displayed results with the different predefined comparison
criteria. This allows you to easily change how the displayed results are compared to each other.
7. Widgets: All of the data on the Analytics page is displayed in the form of different widgets, such as Results and the
World Map. Each of these widgets can be added to Dashboards and Reports within your project.
Predefined Filters
Overview
At the top of the Analytics page you are able to set Predefined Filters to be applied to your results, allowing you to refine
the displayed results to show you only the relevant data to your current need.
To display the available Predefined Filters, simply click on the 'Open Filters' button and you will be presented with the
following filter choices:
Search Bar
Enter a search term or query into here, and then will only be the results which match this exact term from the overall
results.
Sentiment
Filter the results to display either Important tagged articles, or by Positive, Neutral or Negatively sentimented articles.
You are able to tag results as Important or override the given sentiment on articles from within the Results widget.
Date Range
Displays the results that have been published during the selected period (1 day, 7 days, 30 days, 3 months, 6 months or 1
year) or on a custom time period, which includes both the date and the time. The time here is relative to the Time Zone
setting that has been set within the Profile section of your User Settings. If any events are set up within the project you
also have the ability to filter your results by these.
Media Types
Displays the available media types you can filter your results with. The media types displayed here are the types which
have been set up in the 'Media types' section of 'Project data criteria' in your Project Settings. All media types is the
default setting, however you are able to select to just see results from one or multiple different types.
Countries:
Shows results that have been published on a source originating from the selected countries. The countries displayed
here are the countries which have been set up in the section of 'Project data criteria' in your Project Settings. By default,
'All countries' is selected, however you are able to select a single county, or a selection of various counties.
The country detection cannot be accurate 100% of the time, since it is impossible to automatically
assign a country to each and every source (e.g. a Brazilian blogger publishing in Portuguese on a
French blog). Some sites also lack country-related information, so even a human can have a hard
time identifying the source’s true location, however the country detection provides a good
approximation.
You are also able to further filter in on the results by selecting one or multiple different regions or states from the
selected countries. Hovering the mouse over the country will bring up the available states or regions which can then be
clicked on to further refine the results.
Languages
Filters articles in the selected language or languages.
Language recognition is done based on a statistical model and provides very high accuracy. If a
post does not contain many words (e.g. tweets), the accuracy of the language recognition on
articles can decrease. For example, a tweet of the following: “Ich liebe mein Social Media
Monitoring Tool” could be recognised as either English or German language, because the sentence
includes both English words as well as German words. The languages displayed here are the
languages which have been set up in the section of 'Project data criteria' in your Project Settings.
By default, All languages is selected, you are however able to select a single country, or a selection
of various countries.
Tags
Show only results that have been tagged, under the names you have chosen. You are able to add tags to the articles from
within the Results widget on the Analytics page. We recommend you to tag the posts that catch your attention while
browsing! To help you with this, you will find some Workflow tags in order to remind you all read/unread and
checked/unchecked.
Workflow Tags
Filters the results in the project depending on if they’ve already been Checked/Unchecked or Read/Unread within the
project results.
Sources
All sources can be given Star ratings of either 1 star; 2 star; 3 star or marked as a Favourite source. These can be set
from the Sources section of the Project Settings and once they are set you’re able to filter the results to only return you
articles from these rated sources. Also within the Sources section of the Predefined Filters you’re able to show only
results from your the Custom Sources which you have set up within any Source Panels in the project. These Custom
Sources allow you to restrict all of results which are displayed solely to the listed sources contained within these panels.
Custom Source panels can be set up from within the Sources section of the Project Settings.
Filters
Listed here are any Query Filters which have been set up within the project, which can be easily selected from this
menu. Filters allow you to refine and further specify your returned results, by entering more precise keywords and
Boolean operators you are able to precisely filter your results. These filters can be edited within the Filters section of the
Topic Setup section of the project.
Refreshing and Pinning Filters
By default the filters do not have any figures next to them, however it is possible to display the number of results per
filter next to these filters. In the top right hand corner of each of the Predefined Filters is a refresh icon, pressing this
will display the number of results which fit into each of the categories of that group of filters. For example by pressing
the refresh icon in the Media Types filter group, you will be presented with a breakdown of how many results originate
from each of the different media types in the project.
Each of the mentioned Predefined Filter categories can be pinned, meaning that they will still display at the top of the
page even when the filters menu is minimised. Filters can be pinned by clicking on the action button in the top right
corner of each of the filter categories, and pressing the 'Attach' icon. Multiple filters are able to be pinned and displayed
when the filters menu is minimised.
Navigation Bar
Overview:
The Navigation Bar allows you to move quickly between the different visualisation categories available to display your
results with. The results displayed will the articles which have been found in the Topics or Channels which are currently
selected.
The different options available are:
• Results:
Displayed here are the actual results found from the given search queries, sorted in a selected order. In addition to
this there is a visualisation of the results over time and the share of the distribution of results in Share of Topics
(only visible if more than one topic is selected).
• Performance:
Within this tab you’re able to see how the selected topics are performing in the currently selected time period
compared to the same previous time period. The performance widgets shown measure Reach vs Engagement; Buzz;
Engagement and Potential Reach.
• Influencers:
Shown here are the most influential sources or social media authors which have had results matching the keywords
in the currently selected Topics or Channels choices.
• Sentiment:
Displayed here is the proportion of the sentiment from the results, as well as how this sentiment has evolved over
time.
• Themes:
Themes show the popular and most mentioned keywords which have been found within the results, as well as the
evolution of the use of these top words over time. As with any word cloud, the words which have been found the
most are displayed in larger fonts.
• Demographics:
Within this section you’re able to see the breakdown of where the results have originated from in a demographic
sense. Presented are the Top Countries; Top Languages and Gender breakdown.
• World Map:
Here displayed are the distribution of the results on a World Map, visibly broken down with larger circles
representing greater numbers of results than smaller circles.
Results
The results displayed will be based upon the currently selected Topics and Filters (both keyword filters and pre-defined
filters). The number of matching results which have been found will be displayed in the left hand column next to their
corresponding Topics title.
Within the Results tab the following widgets maybe visible:
• Results Over Time:
Displayed within this widget are the results found in the selected Topics plotted over the given selected time period. In
the top right hand corner of the graph is displayed the total number of results that have been plotted on the graph
within this period. You are also able to restrict the graph to only display the 5 or 10 highest result numbered topics by
using the 'Show Top 5 10' option at the top of the widget
• Share of Topics:
Shown here are the how the amounts of results are shared and distributed between the topics in the given time
period. Please note that this widget will only display when you have 2 or more Topics selected at the same time.
• Results:
Within this widget all of the found results that match the keywords from within the Topics or are from Channels will
be displayed. By default the results are sorted by Engagement, however this can be changed to one of the many other
different sorting methods.
Each result will display the following information:
(1) Title of the article
(2) Author of the article (if there is one)
(3) The Snippet from the article which contains the matching keyword(s)
(4) When the article was Published
(5) The Source-Type which the article has come from
(6) The Country which the article originates from
(7) The Source which the article was published on
(8) A Sentiment flag indicating the sentiment contained in the article
(9) Any Tags which have been given to the result
(10) Which topic the results Matches
(11) The Metrics attached to the result
(12) The Virality icon button giving access to the message diffusion information
(13) An Action button allowing to access further activities on the article
Action Button
The Action button in each result gives you access to the following options:
• Sentiment:
Manually override the sentiment which has been given by the tool to the article. You’re also able to add an
Important flag to the article, which can be used to filter posts against.
• Tags:
Any Tags which have been given to the post will displayed here. You’re able to manually add tags to a post, other tags
are automatically added e.g. 'read' when the link to an article is clicked; 'checked' when an action was made on the
article.
• Reports & Alerts:
You’re able to add individual results to either existing reports to to a new report.
• Article:
Here you have the ability to share individual articles on different Social Media platforms. In addition to this you’re
able to remove any results which you do not wish to see in the project by using the Delete function.
• Source Panels:
You’re able to add either Sources or Authors to either Custom or Predefined panels. These allow you to filter your
results solely by these panels. Sources and Authors can both be added to either 1 Star, 2 Star, 3 Star, Favourite or
Blocked predefined panels; an already set up Custom Panel or a new Custom Panel. The actions applied to sources
will affect the entire source, whereas the actions applied to authors will only affect those named authors on the
source which the result comes from. I.E. Blocking the author of Roberto Villarreal from a result from
www.elmundo.es will only block results appearing from that author when published on that website and not all
results from other sources by Roberto Villarreal.
• Tags:
Any tags given to a results, either by a user or automatic workflow tags. The manually given tags will appear with
the background colour of the project (blue by default); whereas the workflow tags will appear with a grey
background colour.
Virality Map
The virality map is able to visualise how successful a Tweet, Facebook post, news article or blog piece has spread across
different media types, countries or languages revealing the hidden levers that helped make a post popular. Clicking on
the virality icon found on results within the Results section will open up the virality map for that selected post:
The above Talkwalker virality map shows how a tweet spread across multiple different media types. At the top we can
see that the tweet was reused in several blogs, which were then themselves later mentioned on Twitter. Each of the
bubbles represents a time that tweet was linked to, showing how extensively the tweet was shared and used far beyond
Twitter. Hovering the mouse over any of the bubbles on the map will show how many results are present in that bubble,
as well as highlighting the links between the bubbles to show how the story spread to and from that point. Clicking on
any of the bubbles in the virality map will display the result or results found in that bubble below the virality map,
which can then be sorted using the same methods as results found on the Results widget.
Filter Options: The Compare option allows you to change how the message diffusion is display by altering the
comparisons for which the relationship between the results are shown. The available options are:
• Media Types: Displays the diffusion and result relationships over the different media types which the linked.
• Sentiment: Bubbles display with relationships between them for the found results comparing by the sentiment
found in the posts.
• Countries/Regions: Shows the spread of the results across the different countries which linked results have come
from.
• Languages: The different languages which the post has spread across are displayed.
The View Mode option on the virality map changes the way in which the data is displayed, either showing the order of
the results over time, or by displaying the link depth of the results. The available options are:+
• Time: Share between results are shown in the chronological order that they were published in.
• Link depth: The important relay relationships between the shares of the story are displayed, allowing with ease the
depth of the spread to be shown.
Result Metrics:
• Additional metrics are computed and gathered for the article:
• Potential Reach (see glossary for details)
• Engagement (see glossary for details)
• Number of Twitter Shares of the article
• Number of Facebook Shares of the article
• Number of Facebook Likes of the article
• Estimated page views per month of the source (Alexa Ranking)
• Additional dynamic data gathered from other social media networks
Google Translation
When results are not displayed in the language which your project is set up in you are able to translate the results into
the language that the User Account is set to by pressing 'see translation' at the end of the post snippit. This setting can be
turned on and off from inside the General Settings section of Project Settings.
Grouping of Results
By default none of the results are grouped together, but are sorted by the method defined in the 'Sort by' menu. The is
the ability to group together results which are directed related to each other (e.g. retweets and comments on the parent
tweet) by using the 'Threaded View'; or also adding results which have very similar content by using the 'Similar Stories
and Threaded View' option.
Sort by
The ordering of the results can be changed and sorted to display in the most relevant way for the project. The available
options are:
• Potential Reach:
Displays the articles published on sources with a high reach first. The reach is calculated for each article/post based
on its type:
◦ Blogs, news and message boards: estimated page views per month based on Alexa Ranking.
◦ Twitter: number of followers.
◦ YouTube: number of views that a video on YouTube has.+ See glossary for detailed reach computation for all
article/post types.
• Engagement:
Ranks articles/posts by how much engagement they have received over social media networks, with the highest
ranked engaged articles being shown first. The engagement is calculated for each article/post based on its type:
◦ News, blogs, forums: Sum of the number of comments, shares on Twitter and shares on Facebook.
◦ Facebook: Sum of shares, likes and comments.
◦ Twitter: Number of retweets.
See glossary for detailed reach computation for all article/post types.
• Published:
Sorts the results based on the published date and time that is stated on the article itself. The most recently published
results come first.
• Last found:
Sorts the results based upon when they have been found and added to your project. The most recently found articles
will be shown first.
• Comment count:
Results are sorted by the number of comments they have, with the highest commented results appearing first in the
list.
• Facebook:
Sorts the results based on the how users on Facebook have interacted with the article. There are two methods of
sorting these results:
◦ Shares: Articles with the highest amount of Facebook Shares will be displayed first.
◦ Likes: Articles with the highest amount of Likes on Facebook will be displayed first.
• Twitter:
Sorts the results based on data from Twitter and how users have interacted with the article. There are three methods
of sorting these results:
◦ Shares: Articles with the highest number of Twitter shares will be displayed first (the article URL is shared in
tweets).
◦ Retweets: Articles with the highest number of retweets will be displayed first.
◦ Followers: Tweeters with the highest number of follows will be displayed first.
• YouTube:
Sorts the results based upon how users on YouTube have interacted with the result. There are three methods of
sorting these results:
◦ Likes: Results with the highest numbers of YouTube Likes will be displayed first.
◦ Dislikes: Results with the highest numbers of YouTube Dislikes will be displayed first.
◦ Views: Results with the highest numbers of views will be displayed first.
• Instagram:
Sorts the results based upon interaction from Instaram users.
◦ Likes: Results with the highest number numbers of Instagram Likes will be displayed first.
◦ Followers: Results with the highest number of Instagram Followers will be displayed first.
Performance:
The performance section allows you to see how your topics are being perceived and interacted with online via the buzz
generated, engagement, potential reach and the proportion of the sentiment.
Within the Performance tab the following widgets maybe visible:
Reach vs Engagement:
Plots the Potential Reach for the total results from the filter Topics against the Engagement of these results.
Buzz:
Here you are able to see how the amount of total results in the selected period, and the difference with the previous
period.
Previous period means the period of the same length preceding the selected time period, e.g. if 7D
is selected, previous period is the 7D before.
Buzz over time displays the total number of results found over the selected period of time, in the same way as it is
displayed on the results page.
Engagement:
Shows the sum of the engagement of all selected articles/posts, the comparison with the period before, and the evolution
over time. See Glossary for detailed definition of engagement.
Reach:
Shows the sum of the reach of all selected, the comparison with the period before, and the evolution over time. See
Glossary for detailed definition of reach.
Proportion of Sentiment:
Shows the distribution of sentiment for all selected articles/posts. See Glossary for detailed explanations on sentiment.
For the KPI widgets, the following metric prefixes are used:
• K – Kilo (1,000′s)
• M – Mega (1,000,000′s)
• G – Giga (1,000,000,000′s)
Influencers:
The Influencer tab helps finding out which source/author is the most influential on a specific configuration. The default
table lists the authors, sorted by engagement.
For each author, you can see:
• The source type.
• The total number of posts written by the author.
• The split between articles with positive, neutral and negative sentiment.
• The total reach for all the articles of the author.
• The total engagement for all the articles of the author.
You have the following display options:
• Choose the number of authors/sources to display in the table (Top 10; 25; 50; 100) *Sort by number of articles (Total;
Positive, Neutral, Negative Sentiment; Reach; Engagement).
• Toggle between authors and sources (via the Action button).
The author extraction is based on heuristics and statistical evaluations. We cannot guarantee 100%
accuracy for the author being recognized and extracted automatically in all articles.
Possible actions:
Clicking on an author/source in the table links to the results page, filtering the results of that author/source.
Sentiment
Shows the distribution of sentiment attached to the found results in the current selected time period.
Within the Sentiment tab the following widgets maybe visible:
• Sentiment - Overall:
Displays the sentiment from the topics, compared by whichever filter has been selected in the Compare bar. If 'None'
has been selected in the Compare bar then this widget will not be displayed.
• Share of Sentiment:
Shows the share of the positive, negative and neural sentiment in the current filtered time period.
• Sentiment over Time:
Plots the different sentiment categories over the current filtered time period. Also shown in on the graph is the total
number of results which are being taken into consideration.
Themes
Themes visualise the most commonly found words contained within the results in the form of word clouds and plotting
of themes over time.
Within the Themes tab the following widgets maybe visible:
• Top Themes:
Displays in a word cloud the highest mentioned words from the filtered results. The larger the words appear in the
theme cloud, the more results have been found with these results. Hovering over any of the found words will display
the total number of results that have been found containing this keyword, and clicking on this keyword will return
you to the Results tab, filtered to only show you results that matched this theme word.
There are two different display options available within the Top Themes widget - 'All Themes' (default) and 'Hashtags
Only'. 'All Themes' will return to the widget results from all types of words, whereas 'Hashtags Only' will only display
hashtagged results within the visualisation.
• Themes Over Time:
Plotted here are the found themes plotted over the given filtered period of time. Displayed on the graph-key are the
themes which have been plotted onto the graph of the widget.
Demographics
The demographics section displays the breakdown in the top countries, top languages and gender distribution from the
results.
Within the Demographics tab the following widgets maybe visible:
• Top Countries:
Gives a breakdown of the top countries from which the results have been found have originated from.
• Top Languages:
Displays a breakdown of the top languages which the results found have been published in.
• Gender:
Visualises a breakdown between the distribution of Male and Female authors on the currently selected results.
The gender is not set for all results, for example when the author is a company, as this cannot be
determined to be male or female. We do not display ”unknown” as a gender category, therefore the
total number of results for the sum of Male & Female authors on a topic may differ from the
overall total number of article results found for that topic.
We talk here about the countries, languages and gender of the author/source, and not the
distribution of the population reached by the article.
World Map
Within this tab there is the 'Distribution on the World Map' widget which displays the arrangement of selected results to
the geographical areas which they originate from. Zooming in on the map will allow you to break the larger regions
down to a country-based level, and clicking on any of the number bubbles will return you to the Results tab, with the
displayed results filtered by the chosen country or group of countries.
Within this tab there is the 'Distribution on the Work Map' widget which displays the arrangement of selected results to
the geographical areas which they originate from. By default the bubbles displaying the numbers of results are grouped,
and zooming in on the map will allow you to break the larger displayed regions into smaller more accurate sizes.
The key in the bottom right of the map shows the total number of Results being displayed on the current map view is
displayed. Also in this section you are able to filter the results shown by either 'All data'; 'location at time of post' or
'location of author profile'. When the option of 'location at time of post' is selected, the map will display the location that
the result was posted from, with any results that do not have exact location co-ordinates not being shown in this option.
Choosing 'location of author profile' will show the location of the authors of the results on the map, and not the location
that the result was posted from. When selecting the default setting of 'All data', all of the results will be displayed on the
world map and not those that have either exact location post data or the location that the author is from.
Hovering the mouse cursor over any of the bubbles on the World Map will give you the option to 'Zoom in' further onto
the area which the results have come from, as well as the option to 'Show details' about the results in the bubble.
Clicking on the 'Show details' option will bring up a pop-up in the screen containing three tabs: Share of topics; Results
and Top Themes.
• Share of Topics:
Displays the results spilt by topic along side of the list of the found results. Results: Lists the found results alongside
their corresponding metrics. Top Themes: Shows a Theme Cloud of words based upon the found results
• Drilldown:
Also in the pop-up screen there is the option to 'Drilldown' the results. Clicking on this button will zoom the map into
just the region where the results bubble is from and will also remove all of the other bubbles from the map, setting a
filter on the results to only display from that one area.
• Heatmap:
Clicking on the options for the World Map widgets allows you to change the layout between seeing the world map
with bubbles over the locations, and a heatmap of the results. With the heatmap selected the widget will show a
colour heat intensity of the location of the results. All of the results shown in this display option are of the 'location
at time of post' setting, showing on the map only the exact locations that the results were posted from.
Navigation Bar - Channels:
When Channels are monitoring Twitter or Facebook is selected, some additional Navigation Bar tabs become available
for additional analytical widgets.
Overview
The Overview section within Channels gives you an insight into the owner and audience activity, as well as how content
has been received and the engagement and response rate on the monitored channel. Within the Overview tab the
following widgets maybe visible:
• Activity:
Here you are able to see a breakdown between the number of results from the channel owner compared to the
number of results from the audience on the channel.
• Content Appreciation:
Shows how content published on the channel is being received by the audience. You are able to see the amount of
Like and Shares (Facebook) that the channel posts are getting or the number of Retweets (Twitter) that are occurring
with the channel owner tweets.
• Audience:
Displays the number of Fans (Facebook) or Followers (Twitter) that a channel has, allowing you to track growth or
declines in fans and followers of the monitored channel.
• Engagement Rate:
Shows the rate of which a post or tweet written by the channel owner has been engaged with, displayed in a
percentage figure. Please see the glossary for a detailed explanation of how engagement rate is calculated.
• Response Rate:
Gives a comparison rate between the number of audience posts and how many of these have been responded to by
the channel owner to show a response rate in a percentage figure.
Owner Activity
Within the Owner Activity section you are able to see and compare the total amount of activity on a monitored channel,
the distribution of types of content, how engaging each content type has been and also the time periods of activity peaks
with the channel owner. Within the Owner Activity tab the following widgets maybe visible:
• Owner Activity:
Here you are able to compare when looking at Facebook channel: the number of channel owner posts against the
number of comments placed on the channel, or when monitoring Twitter channels: the number of Tweets by the
channel owner, Replies from the channel and Retweets of Tweets from the channel.
• Content Distribution:
Within the Content Distribution section you are able to see the difference between the different types of content
posted to the channel by the channel owner. We differentiate between Text, Links, Pictures, Sound and Video posts
or tweets.
• Most Engaging Media Type:
Shows which type of post or tweet by the channel owner in the current time period has been most engaged with. The
media type categories are the same as are used in Content Distribution.
• Owner Activity Peaks:
Displayed here are the peak activity points of the channel owner over the filtered time period, with smaller lighter
circles representing less activity compared to larger darker circles which represent more owner activity on the
monitored channel.
Audience Activity
In the Audience Activity section you are able to see how the audience of the monitored channel are behaving with their
posting or Tweeting activity as well as the types of posts and the peak times of the activity on the monitored channel.
Within the Audience Activity tab the following widgets maybe visible:
• Audience Activity:
On Facebook channels this gives a comparison of the number of posts onto the channel compared to the number of
comments posted onto the channel. Within Twitter monitored channels this compares the number of mentions
compared to the number of Retweets of the channel owners posted Tweets.
• Content Distribution:
Within the Content Distribution section you are able to see the difference between the different types of content
posted to the channel by the channel audience. We differentiate between Text, Links, Pictures, Sound and Video
posts or Tweets.
• Most Engaging Media Type:
Shows which type of post or Tweet by the channel audience in the current time period has been most engaged with.
The media type categories are the same as are used in Content Distribution.
• Content Appreciation:
Displayed here is how published content is being received and distributed by the audience of the channel. With
Facebook channels it is the number of Like and Shares that are displayed, whereas with Twitter channels it is the
number of Retweets and Shares that are shown.
• Engagement Rate:
Shows the rate of which a post or tweet written by the channel owner has been engaged with, displayed in a
percentage figure. Please see the glossary for a detailed explanation of how engagement rate is calculated.
• Response Rate:
Gives a comparison rate between the number of audience posts and how many of these have been responded to by
the channel owner to show a response rate in a percentage figure.
• Audience Activity Peaks:
Displayed here are the peak activity points of the audience of the channel over the filtered time period, with smaller
lighter circles representing less activity compared to larger darker circles which represent more audience activity on
the monitored channel.
Audience
Within the Audience section you are able to see an overview of the channel audience and how the number of audience
members are changing over time, be it growth or declining figures.
Within the Audience tab the following widgets maybe visible:
• Fans/Followers:
Shows the total number of Fans (Facebook) or Followers (Twitter) displayed over the period of filtered time.
• Fan/Follower Growth:
Displayed here is the growth in Fans (Facebook) or Followers (Twitter) that the monitored channel has grown by in
filtered period of time.
• New Fans/Followers per Day of the Week:
Visualised the number of new Fans (Facebook) or Followers (Twitter) that the monitored channel gains, broken
down to which day of the week it is.
• Country of Origin:
Shown here are the country origins of the fans of the monitored channel.
Compare Bar
Overview
On each of the different Navigation Bar tabs you also have the ability to 1-click compare the results on different
predefined criteria, in order to easy contrast sets of data. The following options are available for the Compare Bar:
• None
• Topics
• Media Types
• Sentiment
• Countries
• Languages
• Panels
• Tags
• Events
The options available in this bar will depend upon your selection: in order for a criterion to appear
at least two possibilities need to be present within the results (i.e. at least 2 topics selected, at least
2 Panels attributed to results, at least 2 tags used in results, etcetera).
When a compare option is selected:
• On the result page:
Results over time are broken by the compare option and a pie-chart widget 'Share of' is added to the right with the
overall distribution for the period. The order of individual results shown below is not affected, and results can be
sorted and curated like when no compare option is selected.
• On Performance/Influencers/Themes/Demographics pages:
A common representation combines all possibilities of the compare choice selected, e.g. compares the sentiment
distribution for all the selected topics.
Below, for example, the common sentiment widgets are displayed for each individual topics:
The individual representations are ordered by number of results (i.e. topics with the most results
on top) and are limited to 10 (e.g. the 10 languages with the most results).
Widgets Overview
Widget Options
Each Widget in the tool has multiple different options available to it, with regards as to how it displays in the project, the
ability to add the widget a report or a dashboard, as well as exporting the data contained in the widget or sharing and
integrating it on another platform.
View By
Depending on the currently selected date range, you will be able to view graph widgets by different time intervals of
seconds; minutes; 5 minutes; 15 minutes; hours; days; weeks and months.
Advanced Chart Options
Each of the widgets is displayed in its own default view, however you’re able to change these widget views to display in
different formats on either the Analytics screen or any reports and dashboards that have been set up.
Common available chart options include the following:
• Horizontal bar chart:
◦ Not Stacked: Bars are displayed side to side.
◦ Stacked (absolute): Bars are displayed on top of each other, total bar length is equal to number of results.
◦ Stacked (%): Bars are displayed on top of each other, total bar length adds up to 100%.
• Vertical bar chart:
◦ Not Stacked: Bars are displayed side to side.
◦ Stacked (absolute): Bars are displayed on top of each other, total bar length is equal to number of results.
◦ Stacked (%): Bars are displayed on top of each other, total bar length adds up to 100%.
• Line chart:
◦ Simple line(s).
◦ Line chart area: Shaded area below the line(s).
• Table:
Absolute numbers of results are showed in flat tabular format.
• Pie Chart:
Spread of the result. Only the top ten results are displayed within the pie chart to keep the chart clear and easy to
read.
• KPI Result:
Shows the value for the current period & the value for the previous period, as well as the percentage increase or
decrease compared to the previous period.
Previous period means the period of the same length preceding the selected time period, e.g. if 7D
is selected, previous period is the 7D before.
• Bubble:
Results are displayed in bubble formats. The more results, the bigger the bubble.
Dashboard
Each widget can be added to either an existing dashboard, or to a new dashboard. Hovering the mouse over the 'Add to
Dashboard' icon will bring up further options of the existing dashboards in the project in a list, or at the bottom of the
list 'Add to new Dashboard' is available to click on.
When adding a widget to an existing dashboard, you’ll be presented with the option to change the title that will be
displayed for the widget as well as the entering in a description that will appear underneath the widget. If you add the
widget to a new dashboard you’ll be presented with the same options but also you will need to enter in a name for the
new dashboard as well as a description for that dashboard. The titles and descriptions which you give to the widgets can
be changed later on via the edit menu of the dashboards.
Reports & Alerts
In the same way that each widget can be added to a dashboard, widgets can also be added to reports in the project.
Hovering over the 'Add to Report' button will present you with all of the existing reports which are in the project as well
as the possibility to add to a new report. Clicking on an existing report will immediately add that widget to the given
report.
Clicking on 'Add to new report' will present to you the Report options to fill in before the report can be created. You will
need to enter in a name for the report under the 'Report label'; choose if you would like to assign it to an existing group
of reports and select if you want to incorporate any existing report settings (such as formatting) from other current
reports into the new report.
Export
With all widgets you are able to export the data which is presented in them in a number of different formats.
The possible formats are:
• Image (PNG)
• Word
• PPT
• PDF
• PDF Word
• PDF PPT
• XLS
• CSV
Not all of the formats will be available for all of the widgets
Export All
Within the Results widget there is a further export option labelled 'Export All'. This will export all of the results (up to a
maximum of 20000 results) from the given Topics or Channels into a CSV file.
This option is only possible on full accounts - on Trial accounts it is not possible to export all of the
results.
Embed on Another Platform
With all widgets you’re able to share and integrate the information from the widget on some Social Media platforms and
also with a URL that can be integrated externally.
The possible choices are:
• Facebook
• Twitter
• Image (PNG)
• JSON
• XML
• RSS Feed
• CSV
• CSV (Rows)
When Sharing to Social Media platforms, you will be asked to will in any comment which you wish to attach to the post
when you share it to your wall or feed. When sharing RSS Feeds and Images, when you click on the format an
Embedding Widget box will pop-up on the screen asking you to name the widget and state how often the widget should
refresh, as well as stating if you want an expiry date on the widget to be set. These options can be later changed from
the Embedded Widgets section of your setting.
Page Actions
Overview
In the top right of the Analytics page there are different Page Actions available for selection.
The following options are available:
Refresh
This refreshes the entire page, updating all of the widgets with the current information inside of them.
Add to Dashboard
All of the widgets on the current page will be added to a new Dashboard. You will need to add a Name for the new
Dashboard as well as a Description for the Dashboard.
Add to Report
All of the widgets from the current page will be added to a new Report. You will need to enter a name for the Report in
the Label box, as well as choosing if you wish to assign the Report to an already set up group and if you wish to
incorporate any settings into the report that are on other existing reports within the project.
Create Alert
Generates a new subscription to an alert report. You will need to enter in a name for the Report in the Label box; list the
recipients who are going to receive the alert; select the format that the report will be sent out in; state the trigger type
and
set
the
trigger
on
the
alert.
For
further
information
link:/talkwalker/40.reporting/20.reports.adoc [Reports] section of the academy.
on
Alerts,
please
refer
to
the
Bookmarks
Overview
You’re able to save different page views and filters on your Analytics screen by clicking on your name in the top right
hand corner of the screen and selecting 'Save a new bookmark' from the pull down menu. Any bookmarks which have
been saved can be chosen and opened from the 'Save a new bookmark' option.
If multiple Bookmarks have saved in your project you are able to select which of these is the Default Bookmark view
which the project will be shown when the project is opened. Within the Bookmarks section of the Project settings you
are able to delete any saved Bookmarks as well as choosing which will be presented as your default Bookmark when the
Analytics screen is opened.
Reporting Overview
Overview
Talkwalker can be used as an effective tool to create, customise and send Reports, as well as being an effective early
warning system with alerting capabilities using the Alerts system. The Reporting section allows you to set up both
Reports and Alerts which can be immediately dispatched or set to be scheduled on an automatic basis or when given
thresholds are met.
How to create a new Report
• From your Analytic menu, choose a widget which you wish to include in the report.
• Select a widget(s) from dashboard and choose to add to either a new report or an existing one.
• Choose the settings you wish to attribute to the Report and save your settings.
Please refer the to main Reports section for more further information and details.
Reports
Overview
Here you are able to see any reports which have been set up within your project, as well as editing, sending, duplicating
these reports.
Reports:
You will find listed here the current reports which are set up within the project. Clicking on one of these names will
send you to the Edit screen of the report.
Report History:
Within this section you are able to see a log of reports which have been previously sent out from the project in the
'Reports log'. You are also able to see reports which have been deleted from the project inside the 'Deleted reports'
section.
Main Table
The main table displays the following information:
Report Title
The name which has been given to the report. This is displayed on reports which are sent out via email or are
downloaded.
Last Change
Here is a date-stamp showing the last time that any edits or changes were made to the set up report, and if no changes
have been previously made, it will display the date-stamp at which the report was created on.
Trigger
This column specifies what trigger criteria have been set for the dispatching of the report or alert to the given
recipients. If no triggers have been set, then 'No trigger defined' will be displayed.
Last Send
Here a date-stamp is displayed showing the last time that the report was sent out to the given recipients.
Actions
Within this column you are able to Edit the report; Copy the report; Sent the report; Download the report and Delete the
report.
Reports Actions
• Edit:
Clicking on the Edit icon will take you through to the Edit Menu, allowing you to change the report as well as
customising it. More information can be found in the Edit Menu section.
• Copy Report:
This allows you to duplicate the report you have set up within your project. Clicking on the duplicate icon will bring
up a pop-up box, asking you to name the newly duplicated project. The newly copied report will then appear in your
Reports list.
• Send Report:
Sends the report to the recipients listed, or to the selected setup mailing list.
• Download Report:
Clicking on this will download a copy of the report to your local machine.
• Delete:
This deletes the setup report from the Reports list, after which the report can be found in the Deleted reports section
of Report History.
Edit Menu
Layout
Within this section you are able to set the format of the report, as well as altering the appearance of the widgets
contained in the report.
• Output format:
Here you are able to choose the format of which the report will be composed in. The available choices are:
◦ HTML
◦ Word
◦ PPT
◦ PDF Word
◦ PDF PPT
• Output layout:
You are able to customise the layout of you report on the page before it is sent out in the format which you have
selected. Widgets can be relocated on the report and resized according to the needs of your report, and you’re also
able to adjust the appearance of the widgets which you have selected to be contained within the report.
Moving widgets
To move a widget which are on a report, simply click-hold and drag the widget to the location which you wish the
widget to be placed at on the report. As soon as you drag a widget on-top of another widget, you will be presented with
the option of where you wish to place these widgets in relation to each other.
The following locational positions are available:
Above (1)
Below (2)
Left (3)
Right (4)
Swap (5)
Moving a widget to either above (1) or below (2) the widget will change the position of the widget, moving it either
above or below underlying widget.
Moving a widget to either the left (3) or the right (4) will position the moved widget to that position, and at the same
time resize both of the widgets so that they fit onto the same line together.
Swapping the location of a widget (5) will change the positions of the widgets so that they will switch positions with each
other.
Resizing widgets
Hovering over a widget will also present you with icons which will allow you to shrink or enlarge widgets on the report.
Clicking on the Shrink icon will reduce the width-size that the widget takes up. The Enlarge icon works in the same
respect, increasing the width-size of the widget in the report.
Not all widget that you add to the report can be resized. Widgets such as Results, Influencers and
the World Map cannot have their size altered.
Add Textbox
Underneath each widget on your report, you are able to add a comment in the form of a Textbox, which can include a
headline, text and image, or a mixture of these. To insert a comment simply click on the 'Add Comment' button which
appears when the mouse cursor is hovered over the widget.
The following options are available:
• Headline:
Adds a title-style headline to the widget
• Text:
Add a text box to the widget in which HTML style tagging can be used (<b> bold </b>; <i>italic</i> etc)
• Headline Text:
Includes both a Headline title and the Text box.
• Image Headline Left:
Includes both the Headline title and Text box, as well as the possibility to upload an image, which will appear to the
right of the text.
• Image Headline Right:
Includes both the Headline title and Text box, as well as the possibility to upload an image, which will appear to the
left of the text.
• Image:
Adds an uploaded image to the widget.
Once a comment has been created, it can be edited by selecting the 'Edit' icon which appears when the mouse cursor is
hovered over the comment. Hovering the mouse cursor also will display the 'Delete' icon with which the comment can
be deleted. Pressing on this will cause a Confirmation box to appear asking if you are sure, as this action cannot be
undone.
The comment is also able to be moved about within the report and placed, working in the same way as the moving of
widgets, with the placement dictated with where the comment is dragged to.
Schedule
Reports can either be sent directly when you wish to customers, but they also have the ability to be scheduled so that
they can be sent to given recipients or to a set up mailing list. The scheduling of the alerts can be set either against
calendared agenda, or for the mail out to occur when a set up Trigger criteria is met.
Each report by default has scheduling disabled until it is set up. To begin setting up scheduling simply toggle the 'Enable
scheduling' button from 'Off' to 'On' and further options will be presented on the page.
Recipients
• Report recipients:
Within this box you are able to list the recipients which you would like to receive the report, separating multiple
email addresses with a comma. There is also the possibility to use all of the addresses from one or many mailing
lists, via the 'Include mailing lists' button.
Mailing lists must be set up by a project administrator in the 'Account Settings' section of the
project before they can be used.
Unsubscribed emails
Here you will see a list of any email addresses which have clicked on the 'Unsubscribe' button on an email which they’ve
received from this report.
Trigger
For a report to be dispatched, it needs to be triggered in one way or another. The following triggering conditions are
available to be set against a report:
• New Results
• Irregular activity during last days (absolute)
• Irregular activity during last days (%)
• Irregular activity week-on-week (%)
• Schedule
Trigger Types:
• New Results:
Alert triggered whenever more than the trigger number of new results is found. For example if the trigger number
was set to 10, you would be sent an alert email every time more than 10 new results for your project were found.
• Irregular activity during last days (absolute):
Alert triggered when more than the set number of new results are found with the last set number of days. If this is
set to 50 new results in 5 days, an email alert would be sent if more than 50 new results were found in the current
last five day period.
• Irregular activity during last days (%):
Alert triggered when more than a set percentage of new results are found in the set number of days, compared to
the same number of days in the previous period. If this is set to 25% in the last 4 days, then an alert would be sent if
25% more results were found in the current 4 day period compared to the previous 4 day period.
• Irregular activity week-on-week (%):
Alert triggered when more than a set percentage of new results are found on a day, compared to new results that
were found on the same day the week before. If this is set to 33% and today is Monday, then the alert would be
triggered if more than 33% more new results are found today, compared to last Monday.
Trigger Condition:
For all Trigger types other than 'Schedule' you will need to set a Trigger Condition which defines the results selection
that will make the alert send out.
To set the trigger on the report click on 'Create Trigger Condition' which will take you through to the Results section on
the Analytics screen. Here you can set the filter conditions at the top of the page which you wish to be applied as a
Trigger on the report. Once you have decided on the trigger conditions which you would like for the report, click onto
'Save alert' at the top of the page to save these conditions to the report.
Schedule
Alert triggered on a specific scheduled basis. You have the choice to schedule alerts: * Day(s):
Every certain number of days, at a set time. If this is set to 2 days at 10:00, then an Alert email would be sent every two
days at 10am. * Week(s):
Every certain number of weeks, at a set time, on a set day of the week. If this is set to 3 weeks at 14:00 on Friday, an
email alert would be sent every third Friday at 2pm. Multiple days can be selected (e.g. every Monday and Wednesday).
* Month(s):
Every certain number of months, at a set time, on a set date of the month. If this is set to 2 months at 09:00 on 15 of the
month, an email alert would be sent every two months on the 15th of the month at 9am.
Talkwalker will send the alert recipients an email even if no alerts are found when the trigger type
is set as Schedule. This feature can be stopped by selecting 'OFF' for the sending of emails if no new
results are found.
Settings:
Within the Settings section of Reports, you are to change the name of the report that appears within your project, as
well as setting more of the advanced settings that can be applied to the report.
Label and group
• Report label:
This is the name which will appear within the email for the recipients and is also the title of the report which will
show in the Reports list on the main page of the Reports section.
• Assign to group:
Reports can be assigned to groups, making them easier to view on the Reports main page. If any groups have already
been created you can assign the report directly, else clicking on 'Add to new group' allows the creation of a new
group.
Advanced options
• Native excel charts:
By default this is switched 'OFF', which will display widgets as images and not in native Excel format when the
report is exported. When this is set to 'ON' the widgets will instead be displayed in a native Excel format and not as
images.
• Customise email subject:
When this is switched 'ON', the email subject is able to be edited and customised. By default this is switched 'OFF'.
• Customise email header:
If this is switched to 'ON', a header on the email is able to be entered into the report. To create and edit the text
simply click on the 'Edit' icon and you will be presented with the same layout options which are available for
creating Comments in the Report in the Layout section.
• Customise email footer:
When switched to 'ON', the footer on the emailed report can be edited and customised. To create and edit the text
simply click on the 'Edit' icon and you will be presented with the same layout options which are available for
creating Comments in the Report in the Layout section.
• Word template:
It is possible to customise the Word template file which is used for the Report. It is recommended that you first
download the Word Template to use as a guide for the customisation. When the template has finished being
customised, it can be re-uploaded by either clicking on the Upload File and located the file on your computer, or by
dropping and dragging the file into the 'Upload File' box.
Reports History
Reports log
Within this section can be found a log history of the actions which have been performed on any Reports set up in the
project. The following columns are displayed:
• Report Title:
The title which the report had been given
• Report Group:
Here is will display any group which the report was associated with. If the report was not placed into a group this
will display 'No group'
• Action Type:
Within this column it will be displayed what action was taken on the Report, such as if the report was Downloaded
or Sent.
• Generated On:
Here a date-stamp is displayed which shows when the action on the report was completed on.
• Actions:
Present in this column are the options to Download the Report which had been generated and the function to be able
to Delete the report from the Reports log table.
Deleted reports
Within this subcategory can be found any reports which have been deleted, along with the details of when they were
deleted; their defined triggers and when they were last sent. You are able to restore a deleted report by clicking on the
Restore icon, which will return the report to being active and present on the Reports menu.
Topics
Overview
Topics contain the keywords which you wish to search for in the form of search queries. Topics are organised into
categories, and each topic can contain multiple search queries and can be set up and edited from within the Topic Setup
section.
To add a new Topic, click on the 'ADD TOPIC+' button, which will open up a screen to enter in the details for the topic.
Add in the “Search query” text box the relevant keywords to include in the topic, then click on “Add”. Provide a label
and a colour for the topic is automatically generated (the label and colour are the ones displayed in the topic menu and
on charts). You are able to change the generated colour by first clicking on the down arrow next to the colour, scrolling
down to 'Cusomise colour' and from here you can either enter in a Hexinumber for the colour you wish, or by clicking
on the colour itself you are able to choose a colour from the available colour-pallet.
Assign the topic to an existing group, or create a new group for the topic to be contained within. Topics can be organised
into groups of topics, in the event that the project monitors large number of topics. Topics can either be assigned to an
existing group, to a new group, or remain without any group. All topics no belonging to any groups are listed on the top
of the topic menu.
Multiple lines of search queries are combined with the OR operator.
Within the Advanced Options you are able to add keywords and search syntax, which will exclude these terms from the
results. This can be used to great effect when refining your Topics to only return the results which you want.
In order to get the most of your search queries:
Use quotation marks when searching for a brand that has 2 words, e.g. “Louis Vuitton”
Search queries can be tweaked using Boolean operators, e.g. apple AND (computer OR phone).
Those are always written in CAPITAL LETTERS, or they will be interpreted as keywords.
In the “Advance options” menu, you are able to specify which search queries need to be excluded
from the topic. This can be useful if many exclusions are required.+
Please refer to the Talkwalker Query Syntax section for more information.
Channels
Overview
With Channels you are able to monitor Channels from social media sites and see the activity on these pages alone.
Monitored channels can either be social media pages (monitor the activity of a Facebook page, a Twitter account,
comments on a YouTube video), or mainstream websites (articles or comments posted on a page). Because the
monitoring of channels is set on specific pages, it is not query-related, in other words all posts/comments of the page
will be collected, whatever their content is.
When monitoring a Facebook Page or a Twitter Account, additional page statistics are displayed on the Analytics
screens. Please see the Analytics section for more details on these.
To add a channel to monitor, click on the 'ADD CHANNEL +' button from within Topic Setup, which will open the Edit
Mode, from which you can enter in the Channel you wish to monitor.
There are multiple ways to enter in the channels which you wish to have results returned from. Either copy and paste in
the URL of the specific channel you wish to monitor, or you can enter in the name of the brand you’re looking for and
Talkwalker will propose to you a list of available pages.
If you first select a set Channel within the 'Choose you channel' section at the top of the page, you will only be returned
results from that set channel.
Clicking on any of these proposed pages will direct you to another page where you’re able to select a Group label for the
contained channels, and within Advanced Options you can add further channels, from the same media type, to the
group.
If you enter in an exact URL of a Twitter user, you will be presented with some further options of what it is that you
wish to monitor. The choices are:
• The Twitter User:
All the content that is published on the feed of the user.
• Owner Tweets Only:
Only the Tweets from the Owner of the Twitter account will be returned to the project
• Audience Tweets Only:
Only the Tweets from the Audience of the Twitter account will be returned to the project, and none of the Tweets
from the Owner.
For further information on what can be monitored on different channels, please refer to the Available Channels Section.
Available Channels
General
Popular pages from main networks are proposed when entering a brand or a name in the General search box. When
selected, a page is automatically added to the corresponding category. When entering into this box a brand name, the
system will search across all of the social media and mainstream websites which are listed below and return to you a
selection of the best given results, from which you can pick and select which search results you wish to monitor.
Facebook
Monitor a Facebook Page or a Facebook group.
Description
Example
Monitor a Facebook Page (posts and comments)
https://www.facebook.com/cocacola
Monitor a Facebook Group (posts and comments)
https://www.facebook.com/groups/246561515501543/
Twitter
Monitor all tweets published by @author on Twitter, or the results of a search query on Twitter.
Activity
Description
Search Query
Search for #monitoring
Page Monitoring
Monitor all Tweets published by @talkwalker
AND talkwalker
Google+
Monitor a Google+ Page, a Google+ group, or the results of a search query on Google+.
Description
Example
Monitor results of a search on Google+ (within description https://plus.google.com/s/talkwalker
and comments)
Monitor a Google+ page for new posts by owner
https://plus.google.com/+nike/posts
YouTube
Monitor the description and comments of a video, all the videos of a channel, or the results of a search query on
YouTube.
Description
Example
Monitor results of a search on YouTube (within
descriptions and comments)
www.youtube.com/results
Monitors all comments of a specific video
www.youtube.com/watch
Monitor all videos on a specific YouTube Channel
(descriptions and comments)
www.youtube.com/user/cocacola
Flickr
Monitor descriptions and comments of a user photo stream, a user’s favourites, a user’s photoset, or the results of a
search query on Flickr.
Description
Example
Search for images with Coca-Cola in the title, description
or comment of a picture
coca-cola
Monitor results of a search on Flickr (within title,
descriptions)
www.flickr.com/search/
Monitor Photo Streams (descriptions and comments from
list of photos of a specified user)
www.flickr.com/photos/saggiamente/
Monitor Favourites (descriptions and comments from list
of photos marked as favourite by a specified user)
https://www.flickr.com/photos/34116966@N03/favorites/
Monitor Photosets (descriptions from list of photos from a
specific set of photos from a specific user)
www.flickr.com/photos/34116966@N03/sets/721576240832
54876/
Foursquare
Monitor descriptions and comments of a venue or the result of a search query on Foursquare.
Description
Example
Monitor results of a search on Foursquare (within
descriptions and comments of venues)
https://foursquare.com/explore?q=pizza
Monitor page of a venue (description and comments)
https://foursquare.com/v/akacit%C3%A9/4b66bf45f964a52080292be3
Instagram
Monitor posts and comments of an Instagram profile.
Description
Example
Monitor posts (images, videos) and comments of an
Instagram profile
instagram.com/adidas
Monitor a hashtag on Instagram
#adidas
Mixcloud
Monitor descriptions and comments of a single Cloudcast, Cloudcasts of a user, favourite Cloudcasts of a user,
Cloudcasts listened to by a user, Cloudcasts on a user activity page, all comments of a user, or the results of a search
query on Mixcloud.
Description
Example
Monitor results of a search on MixCloud (within
descriptions and comments)
www.mixcloud.com/search/
Monitor Cloudcasts of a user (descriptions and comments)
www.mixcloud.com/dazed/
Monitor Favorite Cloudcasts of a user (descriptions and
comments)
www.mixcloud.com/dazed/favorites/
Monitor Listened Cloudcasts of a user (descriptions and
comments)
www.mixcloud.com/dazed/listens/
Monitor Cloudcasts on the user’s activity page
(descriptions and comments)
www.mixcloud.com/dazed/activity/
Monitor the comments posted for a single Cloudcast
www.mixcloud.com/aboveandbeyond/above-beyondanjunabeats-volume-9-minimix/
Monitor the comments that a user posted on various
Cloudcasts
www.mixcloud.com/dazed/messages/
SoundCloud
Monitor the tracks of the profile page of a user, or the results of a search query on Soundcloud.
Description
Example
Monitor results of a search on SoundCloud (within
descriptions and comments)
https://soundcloud.com/search/sounds?q=news
Monitor tracks of the profile page of a user
https://soundcloud.com/topdawgent
Vimeo
Monitor the description and comments of all videos from an album, a channel, a group, a user, in which a user appears,
uploaded by a user, or the results of a search query on Vimeo.
Description
Example
Monitor results of a search on Vimeo (within descriptions
and comments)
https://vimeo.com/search?q=Talkwalker
Monitor the videos from an album (descriptions and
comments)
https://vimeo.com/album/61259
Monitor the videos from a channel (descriptions and
comments)
https://vimeo.com/channels/142212
Description
Example
Monitor the videos from a group (descriptions and
comments)
https://vimeo.com/groups/213407
Monitor the videos that a user liked (descriptions and
comments)
https://vimeo.com/blinkprods/likes
Monitor the videos that a user uploaded (descriptions and
comments)
https://vimeo.com/blinkprods/videos
Monitor the videos in which a user appears (descriptions
and comments)
https://vimeo.com/blinkprods/videos/appears
Monitor the videos that a user uploaded or in which
he/she appears (descriptions and comments)
https://vimeo.com/blinkprods/videos/all
Monitor the comments of a video (comments)
https://vimeo.com/75333525
Dailymotion
Monitor the description and comments of a single video, a channel, a group, a playlist, a user, a user’s favourites, or the
results or a search query on Dailymotion.
Description
Example
Monitor results of a search on Dailymotion (within
descriptions and comments)
www.dailymotion.com/us/relevance/search/cars
Monitor the videos from a channel (descriptions and
comments)
www.dailymotion.com/us/channel/music
Monitor the videos from a group (descriptions and
comments)
www.dailymotion.com/group/ACcomedy
Monitor the videos from a playlist (descriptions and
comments)
www.dailymotion.com/playlist/x2z548_BnFCollection_bnfcollection-jazz-blues/1
Monitor the videos from a user profile page (descriptions
and comments)
www.dailymotion.com/user/reuters/
Monitor the videos from a user’s favourites page
(descriptions and comments)
www.dailymotion.com/gb/bookmark/arty0807/1
Monitor the comments on a single video page
www.dailymotion.com/video/x1apjjs_t-mobile-super-bowlad-feat-tim-tebow_fun
Weibo
Monitor keywords on Wiebo
Description
Example
Monitor the results from a search on Weibo
Unilever
Newsletter
Monitor the results of a subscribed newsletter
Description
Example
Monitor results from a newsletter
www.greenpeace.org
External URL
External URL allows you to monitor multiple different kinds of content, in a variety of ways. The available option are:
Review Site comments:
Monitor all reviews from a product on one of the covered review sites.
Description
Example
Monitor results from an Amazon product
http://www.amazon.co.uk/gp/product/B00EC288K6/
The available review sites are:
• Amazon
• ciao
• ebay
• Pagesjaunes.fr
• Alatest
• Dooyoo
• Kununu.com
• iTunes Store
• Google Store
• Otto
RSS Feeds:
Monitor all the results from an entered RSS feed.
Description
Example
Monitor results from an RSS feed
http://feeds.bbci.co.uk/news/rss.xml
External URLs:
Monitor results from specific URL addresses. Copy and paste into the box the exact URL which you are wishing to
monitor and the system will present you with the available different options available for that URL.
• Host:
Monitor all new articles on a specific host (e.g. all articles on http://www.nytimes.com/, including articles on pages
further in the hierarchy like http://www.nytimes.com/pages/sports/hockey/index.html)
• Domain:
Same as host, but also includes articles of pages in other subdomains (e.g. all articles on http://www.nytimes.com/,
including articles on pages further in the hierarchy like http://www.nytimes.com/pages/sports/hockey/index.html,
and also articles on http://well.blogs.nytimes.com/, including articles on pages further in the hierarchy like
http://well.blogs.nytimes.com/category/body/)
• Links:
Monitor all new articles linked from a specific web page (ignores new articles on the page itself)
• Track Changes:
Monitor changes on a specific web page. Portions of text on a page that have changed over time will be collected as
new results.
Filters
Overview
With Talkwalker, you have the ability to further refine and specify your returned results by using filters. Filters contain
keywords and Boolean operators and can be applied to one or more topics, and in combination with other filters. By
using filters, you can avoid having multiple queries for which only the last keyword differs.
As an example, you may be willing to include all results related to “Air France” in a topic, but occasionally focus on
customer support-related terms (delay OR “lost luggage” OR enquiry) or on top management (CEO OR CFO). Adding
these as filters, the user does not have to modify the queries and can also apply these filters to other topics. In a similar
way to topics, filters are organised in categories, and each filter can contain multiple search queries.
Important remarks about filters
• Topics and filters are combined by using the AND operator.
• Multiple filters of one single filter category are combined by using the OR operator.
• A filter of multiple filter categories is combined by using the AND operator.
• Pages and filters are combined by using the AND operator as well.
• Proximity search returns results found within a stated interval amount using the ~ operator.
• The NEAR/x operator works in a similar way to the proximity search operator, but can be used on multiple terms
using parentheses.
For further information please see the Talkwalker Query Syntax section.
Events
Overview
Events are predefined time periods which when created allow you to to easily select or compare results from specific
time periods.
To create a new Event from within the Topic Setup section, click on the 'ADD EVENT +' icon.
Clicking on this will open up the Event options screen, from which the following options need to be filled in:
• Event label:
Enter a name for the Event
• Description:
Enter in a short description for the event, to help you distinguish it from other similarly named events.
• Event date range:
Select here the date range which you wish to be included for the event. This should be a run-up of time leading up to
the event and also after the event. The event day has be to included into this date range.
• Event day:
Choose here the actual date of the event. This date has to be within the range chosen in the 'Event date range' time
period.
Once all these details have been entered, pressing save will save the Event to your project, after which results can
filtered against it.
Project Settings Overview
Overview
Within the Project Settings section you’re able to change all of the settings that affect the project. This includes both the
restrictions that can be applied to things such as the Media types and Countries which the results will be returned from,
as well as editing and changing setting which have been set in the project, such as embedded widgets, tags and events.
General Settings
Project Settings
• Project name:
The name given to the project.
• Project description:
Enter in here a short description about the project, which will help you to easily distinguish between projects with
similar names.
• Email notifications:
By default this setting is set to 'ON' and means that all important notifications will be sent via email to the project
administrators.
• Enable Google translations of results:
Results that are not in the native language of the project, can be translated one by one from within the Results
widget. However if you wish for all results to be translated by default then you’re able to do so by turning this option
to 'ON'. In order for this to work you will need to obtained a Google API key from Google and enter it into the Google
API Key box.
Project data criteria
Within the project data criteria section you are able to state which which types of data will be included or excluded
across your entire project. Please note that these settings do not apply to any channels set up within Channels.
• Restrict to panels:
When this setting is turned 'ON', the project will only return you results which have been found on the sources listed
in the source panels defined in the project. Source panels can be created, edited and removed from within the
Sources section of Project Settings. By default this is set to 'OFF'.
• Restrict to filters:
With this set to 'ON', each of the topics within the project will be restricted to the set search query filters which have
been set up in the project. By default this is set to 'OFF'
• Exclude from all topics:
Any keywords or search syntax which is entered into this section will be automatically excluded from all of the
topics which are set up in the project. Please note that this does not apply to any channels set up within the Channels
section.
• Media types:
Choose here the media categories and social media channels which you wish to see results in your project coming in
from. By default this is set to 'All media types'.
• Countries:
Select which source countries from which the results in your project will be delivered from. Be aware that this will
only restrict the source country and not the language. For example, if you restrict your country results to only be
from Italy, you may still receive results in Italian, English and French as well as any other language as well, as long
as they were published on an Italian source. By default this is set to 'All countries'.
• Languages:
Set the languages you wish to restrict your results to come into your project from. Be aware that this will only
restrict the language that the article is written in and not the location that the article originated from. For example if
you restrict your language settings to be only delivered in French, you may get results from France and also Belgium,
Luxembourg and any other country, as long as the article has been published in French. By default this is set to 'All
languages'.
We suggest that you only activate the languages, countries and media types that you feel are the
most relevant to cover in your project to avoid false positives from occurring in the results.
• Automatic sentiment:
With this turned on, all articles and posts that arrive in your results will be automatically tagged with either a
positive, negative or a neutral sentimentation depending on the content of the result. Turning off this setting will
stop results being automatically classified by the system, you are however still able to manually categorise these.
• Spam Filter:
The spam filter will take away from your results any items which the system classifies as spam articles or posts. You
have the ability here to turn this option off, however with it switched off you may find yourself getting many more
unwanted posts filtering through to your results.
• Porn Filter:
The porn filter will remove from your results all posts and articles which are deemed to have pornographic content
or themes contained inside of them.
Project display options
The options set within this section define the language, time zone and the date format that are to be seen throughout the
project.
• Language:
This is not only the language which the project will be displayed in, but is also the language in which your exported
data and results will be shown in. By default, it is inherited from the user.
• Time Zone:
This is the time zone which your project calendar is set to and it is highly recommended that this is set to be the
same as your local time zone. This is the time that will be displayed in all of your exported results and graphs, and
also any other time specific parameters within your project. By default, it is inherited from the user.
• Date Format:
Choose the format you prefer the date to be displayed with. This is the same format that will be used across the
entirety of your project as well as your exported data and reports. By default, it is inherited from the user.
• Widgets embedding:
Choose which widgets you wish to be selectable for embedding from the project. Choices are:
◦ All
◦ CSV
◦ CSV (Rows)
◦ Facebook
◦ Image
◦ JSON
◦ RSS FEED
◦ Twitter
◦ XML
Social Media Accounts
Overview
The connection of your social media accounts is essential to get social media data flowing into your projects as well as
enabling monitoring within the Channels section.
To enable a connection to a social media network, click on its icon and a pop-up will open asking you your credentials.
Once these have been entered the tool will confirm the authorisation to use your account with Talkwalker.
Talkwalker will not use your accounts to post on your wall or profile on your behalf. Access tokens
will be used for read only purposes.
To remove an associated social media account simply click on the delete icon to the right of the name of the account,
and 'Ok' the pop-up confirmation message.
Bookmarks
Overview
You are able to save different page views from your Analytics screen by accessing your Settings Menu in the top right of
the screen and then clicking on ‘Save a new bookmark’ from that menu. Any Bookmarks which have been saved will be
visible from the Bookmarks settings page.
If multiple Bookmarks have saved in your project you are able to select which of these is the Default Bookmark view
which the project will be shown when the project is opened. The table on the Bookmarks page has the following
information in the table columns:
• Title:
The name given to the Bookmark when it was saved from the Analytics screen.
• Actions:
A tick in the circle here denotes that this is the default view which will be shown when the project is opened.
Clicking on the dustbin next to this will delete the Bookmark from the project.
Embedded Widgets
Overview
Any widgets which have been embedded from the project will display in this section. Embedded widgets can be set to
have expiration dates so that they only work for a limited period of time, or can be set to never expire.
Shown in the table are the following columns:
• Name:
The title given to the embedded widget is shown in bold, underneath this is the unique system name for the widget.
• Creation Date:
The date which the widget was first created on.
• Format:
The type format which the embedded widget it. The format can be CSV; Facebook; Image; JSON; RSS; FEED; Twitter;
or XML.
• Valid Until:
The date which the widget is valid until. By default widgets will have a set expiry date, however this can be changed
to a different date or alternatively the widget can be set to never expire.
• Last Refreshed:
The date and time which the widget was last refreshed and updated at.
• Actions:
From this column you are able to do the following via the displayed icons:
Edit Embedded Widget Settings:
Contained in the Edit section are the following options:
• Widget Name:
The displayed name of the widget
• Never Expires:
This is by default set to ‘OFF’, so the widget will expire. When this is set to ‘ON’ the widget will never expire.
• Valid Until:
Displayed here is the day which the widget is valid until. After this date the widget will not return any information
when it is called. This option only appears when the Never Expires setting is set to ‘OFF’. Pressing ‘Change’ allows
you to alter the date which the widget will expire on.
• Format:
The format which the widget was created in. This cannot be changed
• Refresh:
Widgets will only update when they are called by a user or program, the Refresh frequency shows displays
maximum frequency at which the widget will refresh and update the data contained inside of it.
• Last Refreshed:
The date-stamp here shows when the information inside the widget was last updated.
• Edit topic and filters:
Change the topics or filters from which the widget is set up against. Save the changes that have been made at the top
of the screen by clicking on the 'Save changes and return', or cancel any changes made by clicking on the red cross to
the right of this.
Delete Embedded Widget:
Deletes the Embedded Widget
Refresh Widget:
Updates the widget with the current information from the tool for the topic and filter parameters which have been set.
Widgets will normally refresh every time they are called by the applications using them, you are however able to
manually refresh the widgets using this option.
Events
What is an event?
In Talkwalker, events are defined as specific periods of time. Once defined, an events enables the user to select in oneclick a period of time without having to click on the date picker. Furthermore, events can be compared between each
other for advanced insights.
Even when an activity happens on a single day, you might want to monitor results some time before and after the event.
Hence we distinguish:
• Event range:
Range of days included in the event.
• Event day:
Date on which the event is actually occurring. It is used as reference when comparing events.
Where do I find events in Talkwalker?
Events can be found in the Analysis screen, when clicking on the time filter:
We distinguish:
Pre-defined events: quickly select and compare pre-defined periods of time.
1 week events: time periods of 1 week. The 4 pre-defined events are:
• Last 7 days
• 7 days before the last 7 days
• 7 days before the last 14 days
• 7 days before the last 21 days
1 month events: time periods of 4 weeks. The 4 pre-defined events are:
• Last month
• 1 month before the last month
• 1 month before the last 2 months
• 1 month before the last 3 months
The names of these events are the date ranges for each of them. It is for ease of understanding
only. These events are always relative to date of the day: if you select the first 2 predefined week
events, compare on events and add to the dashboard, the last 7 days will always be compared to
the 7 days before.
• My Events:
Your project-defined events.
• Multiple events can be selected at the same time (among other things in order to compare them)
How to set-up a new event?
To set up an event:
• Click on the “+Add” button at the bottom of the time filter options.
• Enter a label and a description.
• Select the range of the event(can be one day only).
• Select the event day (must be included in the event range).
• How do I edit an event?
Your events can be modified/deleted from the “Edit Mode”, by clicking on the cog wheel next to your project name on
the top left. Custom-defined events are listed under “My Events” under the filters.
Sources
Overview
Source panels allow you to define sources and authors which you wish to exclusively include or exclude from your
results and also to filter your results to ones from certain predefined panel.
Custom panels
Custom panels are user-defined panels. In custom panels, you can choose to include or exclude sources and authors
from the panels.
To create a custom panel:
1. Click on the +Create panel button on the right hand side of the page, which will open a new page for adding a custom
panel.
2. Enter a name for the panel. This name will appear in filters so choose it wisely.
3. Choose either include or exclude:
If you wish to exclude entries: Add excluded entries by entering a list of site URLs for sources which you wish to
explicitly exclude from appearing when filtering your results by the panel. If you wish to select only results from
specific URLs: Add included entries
Entering both entries to include and entries to exclude is irrelevant, as only the include will
matter.
Exact match means that you will limit your results to match exclusively the source URLs which are
entered into the panel. For example, the URL www.myurl.com can point to a different IP address
than the URL myurl.com. With exact match, it would only look at myurl.com.
Pre-defined panels
You also have the ability to state the star rating you wish particular sources to have, which in turn gives you the chance
to stipulate which sources will have more or less influence within the found results in your project.
The star rating you set to any given sources will change the way in which they are attributed to your results, with
sources that are added to the Favourite panel or placed in the Three star sources panel being seen as more important
than sources found within the Zero or One star sources panel. Sources which are added to your Blocked Sources panel
will not appear in your results.
There are two ways in which you are able to block sources and authors as well as giving sites specific star ratings:
Firstly within your Results section on your Analytics screen, for each of the results displayed you are able to: set the star
rating of the source; block the source or author; and add the source or author to a custom source panel. To access these
setting, on the post you wish to specify the source, click on the menu tab on the right hand side of the post, scroll down
to the Source Panels section, and hover the mouse cursor over either the Source or the Author, and choose to either
block the source or author; change the given star rating of the source; or to add the source or author to a source panel.
Within the Sources section of the settings of your project you are able to define which sources and authors you want to
have on specific star panels, which are to be blocked and which you wish to be favourited. You also here have the
chance to create Custom panel, which sources can be added to, where they will be included or excluded from your
results when filters are run on the panel.
Within the Sources section of the Settings of your project, the following sections are available:
Predefined Panels: The predefined panels are a list of different panels which are set up into every project and cannot be
deleted or removed from the available panels. You are able to assign each of your sources a star rating between Zero
stars and Three stars, Block certain sources from appearing and Favourite sources. These can be used to filter your
results by the sources which matter and are important to your project, removing the sources which are not relevant by
adding them to the Blocked sources panel, and choosing your favourite sources by adding them to the Favourite sources
panel.
Export
Allows you to export, in a CSV file, all of the currently set up manually added sources. Included within this file are any
custom panels which have been set up, alongside the predefined panels. As soon as your press the Export button, the
CSV file will download within your browser.
Import
You are able to import a CSV file of your desired list of sources to be included on your predefined and any custom panels
you wish to be set up, by importing the list in a CSV formatted file.
It is strongly recommended that before you attempt to upload your sources, you first export your
current sources so that you are able to better see and understand the format in which the CSV file
must be built so that it is understood by the system when it is uploaded with your manually
defined sources included in it.
To import your sources CSV file, click onto the Upload File box and select the file you are wishing to upload from your
computer. If the Override button is ticked, any sources you have previously entered which are included on the same
panels on your imported CSV file will be overwritten. If the Override button is left unticked, then you have a risk of
duplicates. After the file has been chosen, pressing the Import button will upload the file and import into the project
your manually defined sources.
Tags
Overview
Tagging is a very powerful curation mean. Alongside with manually updating the sentiment of an article, marking it as
important or adding sources or authors to panels, you have the possibility to manually append tags to articles.
Tags are used as markers to manually categorise one or multiple articles. Once results have been tagged, you are able to
filter results to only show posts containing this tag.
With the 2D tagging functionality, you are able to tag an article within 2 dimensions. e.g. “Coca-Cola smells good and
tastes bad” can be tagged as Taste / Bad and Smell / Good.
How to create a new tag?
The easiest way to create new tags is to enter a tag name in the text box of the individual result option menu. Just enter
the word and then press ENTER to create the tag.
Tags added this way are stored under the “ungrouped” category (either in the filters on top and in
the settings)
If you enter a tag in the top results of a Group of results when Threaded or Similar Stories
Grouping View is selected, then all the results contained within this group will be tagged with the
same tag (upto the first 1000 results)
How do I create a new tag with 2 dimensions?
Dimensions are separated by a forward slash. To create a tag group price and a tag expensive within that group, enter
price/expensive in the text box.
How to add to an article a tag that already exists?
When adding a tag to an article, suggestions of existing tags are presented to the user to be able to reuse same tag names
and avoid duplicates.
Manage tags
You are able to add and remove tags and groups of tags from the Settings of the Project under the Tags section.
As a general rule, it is advised to add tags directly from the results page directly and to use the tag page on settings only
to remove unwanted tags.
Once tags are removed from the settings menu, they are removed from all the articles of the
project. This cannot be undone.
All single tags are stored under the predefined/ungrouped section
Single tags can be added by hovering on the “Ungrouped” menu and clicking on the + icon in the right box. Enter the
name of the tag and press ENTER. Single tag can be removed by hovering on the “Ungrouped” menu and clicking on the
x next to the tag to remove. 2D tags are stored under the custom menu
New groups can be created by clicking on the + icon on the top (next to Groups). New tags can be added in a group by
hovering on the name of the group and clicking on the +icon in the right box. Enter the name of the tag and press
ENTER. Tag can be removed from a group by hovering on the name of the group and clicking on the x next to the tag to
remove.
Any tags added by freehand will be automatically added to your ungrouped section within your
tag settings.
Themes
Overview
On the themes tab, the default theme cloud is built by finding common words and phrases across results and
representing these graphically in the form of a word cloud. Words that appear more often in your results will appear
larger in size.
Talkwalker offers advanced word cloud functionalities.
Custom theme panels
With custom theme panels, you are able to provide the tool with a list of themes, and get in return a word cloud build
based on the number of times the given themes are found within the results. You might have for example a list of
candidates to an election and would like to graphically see the ones that appear the most often in the results.
How do I create a custom theme panel?
To create a custom theme panel:
1. Click on '+Create theme panel' in the top right of the Themes screen
2. Set a title for the panel (this will appear as section title in the Theme page)
3. Click on Save
4. Enter your list of themes in the “Theme cloud entries” text box
5. Click on Add, which will save the themes you’ve entered into the custom theme panel.
Where do I find my custom theme cloud?
The custom theme cloud appear in the Theme tab on the Analytics screen, underneath the general theme cloud.
Pre-defined theme panels
The pre-defined theme panel called “Blocked themes” enables you to set a list of themes that you wish to exclude from
all theme clouds of the project.
To add themes to block: . Click on the cog wheel next to “Blocked themes” . Enter the list of themes you would like to
block . Click on Add
Export
Allows you to export, in a CSV file, all of the currently set up manually added theme words. Included within this file are
any custom panels which have been set up, alongside the predefined panel of Blocked themes. As soon as your press the
Export button, the CSV file will download within your browser.
Import
You are able to import a CSV file of your desired list of theme panels and their containing theme words, by importing
the list in a CSV formatted file.
It is strongly recommended that before you attempt to upload your sources, you first export your
current sources so that you are able to better see and understand the format in which the CSV file
must be built so that it is understood by the system when it is uploaded with your manually
defined themes included in it.
The information that needs to be included in the imported CSV file are the following columns: * Panel ID:
The name of the panel; the list entry number of the custom theme panel.
• Panel Title:
The title which is given to the panel. Each line within that panel must have the same title attributed to it.
• Tag:
The theme word you wish to include in your customer theme panel. Any terms added to the Blocked themes list will
be excluded from your themes.
Import Documents
Overview
You are able to import results into your project via the Import Documents section.
These results can be imported in either CSV, XLX or XLSX format, with the only restriction being that the files are under
10MB in size.
Before you try to upload a document with the results you wish to import, we strongly recommend that you download
the sample documents. These display the minimum required information that is needed to be contained in the import
file, as well as the correct format that is required for the system to accept the imported file.
There are two different types of Imports possible for Topics Results and Channels are Simple and Complex. With
Complex uploads you are able to populate all of the possible fields in the CSV upload file, whereas for the Simple upload
you need only to populate some of the fields before uploading the file.
To upload the results you are wishing to import, either drag-and-drop the file on to the ‘Upload File’ icon on the page, or
alternatively click on the ‘Upload File’ icon and navigate on your computer to the file which you are wishing to import.
Project
Overview
You are able to create a new project in your account by clicking on the button “Create project” on the top right of the
Projects screen. Once clicked, the project is created and a new group of settings is added at the bottom of the settings
menu to the right.
To create a new project in your account, click on the + Create Project button located at the top of the page. Once clicked,
the project is created and the page is redirect to the project Settings page of the newly created project.
If you cannot see the + Create Project button then you do not have the sufficient access rights to
create any new projects. Please contact your project Administrator if you need to create more
projects.
Displayed in the Project Table on this page are the projects associated with the account of the logged in user. The Project
Table displays the following information in the columns:
• Project Name:
The name and description that has been given to the project
• Creation Date:
The date which the project was created on
• MTD Results:
The Month to Date shows the amount of results which have been found so far in the project this calendar month.
This is expressed as a total number, as well as a percentage of the allowed monthly results based upon the current
project subscription, which have been used so far in the month.
Results figures that are displayed in red in the column are currently over their monthly allowance
based on the current subscription. No more results will be delivered to the project for the
remainder of the calendar month unless the project is Upgraded.
• EST. EOM:
The Estimated End of Month shows the estimated amount of results which are expected to be found by the end of the
calendar month based on the number of results which have been returned so far. This is expressed as a total
number, as well as a percentage of the allowed monthly results based upon the current project subscription.
Results figures that are displayed in red in this column are being predicted that they will be over
the monthly allowance of results based on the current project subscription by the end of the
calendar month. This is only an estimation and results will continue to flow into the project until
the results in the MTD column have reached the allocated monthly total.
• Actions:
From this column you are able to do the following via the displayed icons:
◦ Login to a project Dashboard screen
◦ Login to a project Analytics screen
◦ Login to a project Settings screen
◦ Delete a project
If a project has expired you will not be able to log into it, and instead will be presented with an
Upgrade button, which when pressed will take you through to a subscription page.
Users
Overview
You are able to give multiple users access to the different projects in your account. These users can also be given
different permission levels of access in the projects they can access.
To create a new user, click on the '+Add user' button, from which you’ll be able to enter in the details for a new user on
your account or project.
Found on the Users page is a list of the current users associated with the account. The displayed table here contains the
following information:
• Name:
The name which was given to the user when they were set up.
• Account Admin:
Shows if the user is an admin on the account or not. A tick in the circle indicates that the user is an admin.
• Email:
The email address which is associated with the user. This is the email address which the user uses to log into the tool
and is the address which all Talkwalker notifications for the user will be sent to.
• Actions:
From this column you are able to perform the following actions:
◦ Edit the details of the user, including name; email address and project access permission levels
◦ Delete the user
◦ Resent confirmation email (If account has not been confirmed)
• Create a new user:
To create a new user or admin, from the Users page click on the + Add User button, which will take you through to
Add User screen. For each admin and user, the following sections must be filled in:
• Name:
This will be used to identify the user within the tool.
• Email:
This email address will be used by the user for logging onto the tool and for sending any account specific
information to the user
• Password:
This will be used by the user when logging onto the tool to confirm their identity.
• Confirm Password:
This must match the entered password for the user.
• Account admin control:
If you wish the user to be an account admin, this button must be set to ‘On’.
Differences between Admin and Users:
Admin users on an Account have the rights to access all areas of the projects associated with the
account. This includes not only being able to view the Dashboard and Analytics screens, but also
having the ability to edit, add and delete any settings, widgets or other options within the project.
Admin users also have the ability to be able to create further users and grant them access to
projects associated with the account.
Users must have their access rights defined when they are created. These access right apply to the account associated
projects with the following permission levels available:
• Project Admin:
User has access to all Dashboards, Analytics options, Project Settings and also the ability to create and edit Users
within that project.
• Full Tool:
Access to all of the Dashboard and Analytics options and settings as well as access to Project Settings.
• Custom:
Set the permission levels for which the user has across their account. You are able to access levels for each of the
projects within the account as well as setting if the user can access the Analytics screens, the Dashboard menus and
the Report menus. In addition to this you’re able to set what level of access the user has to each of the individual
dashboards and reports which are contained within the project.
• No access:
User has no access to this project.
Api Settings
Overview
You are able to use the Talkwalker API to feed the results found in your project into your own systems. In order to do
this you must purchase credits, which can be obtained by contacting your Talkwalker account manager.
Access Tokens
Presented here are the two access tokens for your account. By default there will be one read and one write access token,
both of which can be renamed and have their modes changed. If you wish to add any further tokens, you’re able to do
so by clicking on the '+ Add Access Token' button. To delete any tokens, simply click on the delete icon within the Actions
column.
Credits
Displayed within this section are the remaining credits on your account, split into Remaining recurring credits;
Remaining one-time credits and the number of Total remaining credits left on your account.
Mailing Lists
Overview
You are able to set up Mailing Lists, which can be chosen from the Reports, to send mails to mass recipients.
To create a new mailing list, click on the '+Add List' icon which will take you through to the edit menu. From here you
will need to give the mailing list a name, to help distinguish it between other created lists. Within the 'Add recipients'
you can list the email addresses which you wish to add to the mailing list. Multiple addresses can be separated by either
a comma or by entering each address onto a new line. Once the addresses have been added, click on the 'Add' button to
save the addresses to the list and press the 'Save' button.
Once a mailing list have been created, the list will be displayed on the main Mailing Lists setting page. From here within
the Actions column mailing lists can be edited or deleted.
Talkwalker IQ Apps
Overview
The Talkwalker IQ Apps allow you to with quickly and ease to apply already created tools to the topics which are
already set up within your project. The pre-defined tools within the Talkwalker IQ Apps allow you to select the pieces of
information which you are interested in, and have these results presented in an pre-build dashboard format.
To begin with the Talkwalker IQ Apps, firstly select one of the Apps which is most relevant to your needs. As soon as
you’ve clicked on the App you’ll be taken into the App itself, where you can start to refine further to see the results
you’re looking for.
What are Talkwalker IQ Apps?
Dashboards enable you to display in one place all of the widgets which represent the data you’re interesting is seeing in
one place. Talkwalker IQ Apps have in place pre-defined widgets in a Dashboard format which allow you to quickly
select different Topics or Channels from which you wish to see analysis from. Each of the different Apps is customised to
display the relevant widgets for the subject selected, for example Crisis; Hashtag Campaigns or Brand Listening.
Once you have opened up an IQ App you must first choose which area of the App you wish to focus in on, by choosing
the appropriate filter for the results. These set filters will depend on the area which the App is built around and will
differ from App to App, so for example within Brand Listening you are able to focus on all or certain media types, but
within Hasttag Campaigns there is only the the selection choose between different social media platforms.
After you have selected the set-filter, you need to then select where the results on the widgets will be being generated
from. The topic groups which have been set up in your project will be visible and you can select from these the topic
itself which you want to have results displayed from, or alternatively the topics which you wish to compare sets of data
from.
Only some Apps will allow you to select multiple topics simultaneously, with these being the Apps
to contrast and measure data sets in. All of the other Apps will restrict you to one topic selection of
data at a time.
Within the App, once the topics and set-filters have been selected, you will see all the widgets populated with analytical
information coming from the data results.
Talkwalker IQ App Options
By default widgets inside the App will show 7 days of data, however the date ranges along with all of the usual filters
which are found on the Analytics screen are also found inside of IQ Apps and can be applied to the data displayed.
These filters include the media types, countries and languages which results will return from etc.
Any changes you make make to the filters will be applied to all of the widgets on the page and not
just specific widgets.
You also have the option to add the Apps to either your Dashboards; Report or set an Alert up against the results in the
App. These options are found in the top right hand corner of the screen.
Dashboards
Dashboards overview
A Dashboard is a place in which you can save any result representation from the Analytics section. A Dashboard thus
enables you to have in one place the representations that are key to your project, and that you would like to see in a
with ease. You’re able to add multiple different widgets to each Dashboard and also have many different Dashboards
within a project, allowing you to have different views set up on the results analysis you need.
Dashboards are comprised of a selection of custom chosen widgets which have been selected from your Analytics
screen. Once created, Dashboards can be accessed from your Home Screen, with each dashboard being listed and
clickable, giving you direct access to it.
How to create a Dashboard
To create a Dashboard, you first will need to choose a widget from your Analytics screens to begin the Dashboard with.
To do this, click on the Actions button of the chosen widget, move the mouse cursor to 'Add to Dashboard' and select the
option 'Add to new Dashboard'.
Once clicked on, the 'Add widget to new dashboard' screen will pop-up with the following sections to be filled in:
• Dashboard name:
Enter in a name for the newly created Dashboard.
• Dashboard description:
Enter in a short description for the Dashboard, to help you easily distinguish it between other Dashboards within
your project.
• Widget title:
Enter here a title for the widget that you’re adding.
• Widget description:
Enter in a short description about the added widget. This information will appear below the widget title on the
Dashboard.
Once you’ve pressed the 'Add' button at the bottom of the page, the Dashboard will be created and the widget will have
been added to the Dashboard.
How to add widgets to Dashboards
Once your first widget has been added to your newly created Dashboard, you’re able to continue to add further widgets
to that Dashboard. To add additional widget, first click on the Actions button of the widget, hover the mouse on 'Add to
Dashboard' and click on the Dashboard which you wish to add the widget to.
Once clicked on, the 'Add to Dashboard' screen will pop-up, with the following sections to be filled in:
• Title:
Enter a title for the widget that you’re adding to the Dashboard.
• Description:
enter in a short description about the widget which is being added. This information will appear below the widget
title on the Dashboard.
Once you’ve pressed the 'Set' button, the widget will be added to the Dashboard.
Any filters which been applied to the widgets on your Analytics screen will also be carried over to
the widget when it is added to the Dashboard.
How to edit dashboards
Once widgets have been placed upon your Dashboard, you’re able to move and locate them around the Dashboard until
you’re happy with the way in which it’s displayed, as well as editing the information which they contain.
Each of the widgets can:
• Be moved around the Dashboard
• Have its size increased or decreased
• Have the title and description edited
• Have the topics and filters its set against edited
• Be removed from the Dashboard
• Have their views and chart options changed
In order to change anything on your Dashboards, you must first enter into the Dashboard Edit Mode, which can be done
by clicking on the 'Edit Dashboard' icon in the top right hand corner of the screen.
You must save any changes which you make to the Dashboard by clicking on the 'Save' button in the Dashboard name /
description section when you have finished making changes in order for the alternations to be saved. If you wish to not
save any changes you have made, you can click on the red cross at the top of the screen next to text of 'Edit Mode', which
will take you back to the Dashboard overview.
Moving widgets
To move a widget which are on a Dashboard, simply click-hold and drag the widget to the location which you wish the
widget to be placed at on the Dashboard. As soon as you drag a widget on-top of another widget, you will be presented
with the option of where you wish to place these widgets in relation to each other.
The following locational positions are available:
• Above (1)
• Below (2)
• Left (3)
• Right (4)
• Swap (5)
Moving a widget to either above (1) or below (2) the widget will change the position of the widget, moving it either
above or below underlying widget.
Moving a widget to either the left (3) or the right (4) will position the moved widget to that position, and at the same
time resize both of the widgets so that they fit onto the same line together.
Swapping the location of a widget (5) will change the positions of the widgets so that they will switch positions with each
other.
Resizing widgets
Hovering over a widget will also present you with icons which will allow you to shrink or enlarge widgets on the report.
Clicking on the Shrink icon will reduce the width-size that the widget takes up. The Enlarge icon works in the same
respect, increasing the width-size of the widget in the report.
Not all widget that you add to the report can be resized. Widgets such as Influencers and the World
Map cannot have their size altered. In addition to this if the Results widget is decreased in size, the
article metrics will not be displayed next to the posts.
Editing Titles and Description
The Dashboard name and Dashboard description which was previously entered can both be edited from with the Edit
Mode. In addition to this the titles and descriptions which each of the widgets has can also be altered. To edit the title or
description that a widget has, firstly click on the Actions button of the widget, then select from the menu 'Edit title and
description'.
Once you have changed the text, click on 'Set' to save the changes you have made.
Editing Topics and Filters
It is possible to change the topics and filters which the widget has been setup against after it has been added to the
Dashboard. To do this firstly click on the Actions button of the widget, then select 'Edit topics and filters' from the menu.
Once selected you will be taken back to the Analytics screen with only the widget that has been selected showing. You
can change and add to the Topics which the widget is set up from, as well as being able to change any of the filter
settings shown when expanding the 'Open Filters' section at the top of the page.
Once you have made the alterations needed to the widget, click on the 'Save changes and return' to go commit these
changes and return back to the Dashboard.
If you wish to undo any changes before the widget has been saved, simply click on the red cross icon next to the 'Save
changes and return' text.
Removing widget from Dashboard
To permanently remove the widget from the Dashboard, click on the widget Actions icon for the widget you wish to
delete and select 'Remove from Dashboard'. This will immediately remove the widget from the Dashboard.
View by & Advanced Chart Options
When adding a widget to a Dashboard, it will save with the same view and chart display options which are displayed on
it when it was added. These can be changed temporarily when viewing the Dashboard outside of the Edit Mode, or
permanently when saved from inside the Edit Mode. To change the View by and Advanced Chart Options, click on the
widget Actions button and change the options to the views you’d like to see.
These changes of views will not be saved unless they are done from within the Edit Mode and
Saved. If changes are made outside of the Edit Mode, they will not be in place the next time that the
Dashboard is opened.
Filter Options
When expanding the 'Open Filters' section at the top of the screen, you’re able to apply all of the filter options which are
available on the Anayltics screens, including Media Types; Countries; Languages and Tags, to the Dashboard which you
are currently on. Acting in the same way as the View by & Advanced Chart Options, if these are applied outside of the
Edit Mode, the changes will not be saved, however if they are applied from within the Dashboard Edit Mode and the
changed are saved, they will be permanently applied to the widgets on the Dashboard.
If you apply and save changes from these filters to the Dashboard, these will be applied to all of
the widgets contained on the Dashboard, overwriting any other filter settings which had been set
on individual widgets. If you wish to change the options on not all of the widgets contained in the
Dashboard you need to do so via the 'Edit Topics and Filters' setting as documented above.
Dashboard Options
In the top right hand corner of the Dashboard, there are the following options available which can be applied to the
Dashboard:
• Refresh:
Refreshes the widgets contained on the Dashboard with the latest data available.
• Edit Mode:
Takes you through to the Edit Mode of the Dashboard where changes can be made and saved.
• Copy Dashboard:
Allows you do duplicate the Dashboard which has been built. Clicking on this icon will bring up the following
options to be filled in:
◦ Dashboard Name:
Enter in a name for the duplicate Dashboard to be called.
◦ Dashboard description:
Enter in a brief description for the Dashboard to help you distinguish it from other Dashboards in your project.
• Add to Report:
Adds the Dashboard to a new report. Clicking on this icon will bring up the following fields to be set:
◦ Report label:
Enter in a title for the Report.
◦ Assign to Group:
Add the Report to any already created groups.
◦ Report Settings:
Import into the report any settings and formatting from an existing set up Report.
• Create Alert:
Subscribes the Dashboard to a new Alert subscription. Clicking on this icon will bring up the following fields to be
set:
◦ Report label:
Enter in a title for the Alert.
◦ Report recipients:
Enter in the email addresses of the recipients to be sent the Alert.
◦ Report format:
Choose the format which the Alert is to be built in.
◦ Trigger type:
Select the type of conditions which have to be met in order for the Alert to be sent
◦ Trigger:
Set the trigger conditions for the Alert.
Further information on Reports & Alerts and the settings that can be set on these can be found
within the Reports section of the Academy.
Fast Tagging
Overview
You are able to quickly navigate through your results on the Analytics screen by using shortcuts. The following shortcuts
are available:
Navigation Shortcuts:
↑
Select previous result
↓
Select next result
Ctrl
Selects all results in current view
Ctrl + Click
Selects clicked upon result(s)
Return
Reload results
Esc
Close open windows
Fast Tagging
You are also able to use keyboard shortcuts in order to quickly add tags and change sentiments given to your results.
The following shortcuts are available:
q
Toggle important flag (en/de keyboards only)
a
Toggle important flag (fr keyboards only)
w
Set sentiment to positive (en/de keyboards only)
z
Set sentiment to positive (fr keyboards only)
e
Set sentiment to neutral
r
Set sentiment to negative
t
Add custom tag
s
Toggle read tag
d
Toggle checked flag
Del
Remove article
Glossary
Overview
Admin User: In addition to normal user rights, admin users can:
• Create other users
• Modify the profile and access level of users
• Reset passwords of users
• Change email addresses of users
• Create new projects in the account (within limits set by Talkwalker).
Each account can have a maximum of 3 administrators.
Alerts: Notification by email as soon as a given threshold of results is reached. Additionally, alerts can be used to
schedule automatic sending of results or of other result visualisations
Automatic Sentiment: See sentiment
Branding: The entire Talkwalker can be white labelled in your corporate image
Buzz: Shows the noise that search queries have generated online in the currently filtered time period, compared to the
identical previous time period.
Content Appreciation: Displays how many times the Audience of a Facebook channel or a Twitter channel have Liked
or Share (Facebook) or have Retweeted (Twitter) posts from the Monitored Channels
Dashboard: Dashboards enable you to display in one place the representations of the results that are key to your
project. If you only want to see the result articles, the sentiment produced by these results and the demographic spread
of these, they can all be added to one dashboard
Demographics: Information about the author/source of a post. Demographics include country of publication, language
and gender of the author.
Engagement: The engagement of an article/post is the sum of actions made by others on that article/post. The
engagement of a topic is the sum of the engagement of all articles/posts of the topic.
Engagement Rate is calculated in the following ways:
• Facebook Engagement Rate: ((Number of Likes + Number of Comments + Number of Shares by others) / Number of
Fans) * 100
• Twitter Engagement Rate: ((Number of Retweets by others) / Number of Followers) * 100
Engagement is calculated in the following ways:
• Blogs; News Sites; Forums: Number of Facebook Likes + Number of Comments on the article + Number of Shares on
Facebook of the URL + Number of Tweets on Twitter of the URL
• Facebook: Sum of shares, likes and comments
• Twitter: Number of Retweets
Event: An event is a specific period of time. It thus acts are a filter on time. Talkwalker proposes pre-defined events and
user can create custom events.
Filter: A filter enable you to add further restrictions to your topics. Filters can either be keyword filters or filters based
on metadata of results (filter on sentiment, filter on media type, …).
Impressions: The impressions of one tweet is the sum of the followers of the tweeter of the tweet. The audience
impressions is the sum of the impressions of each tweet of the audience (this includes retweets)
Influencer: An influencer is an author/a source that is writing about your topic. Top influencers are the ones who write
the most about your topic (most articles/posts), whose articles/posts reach the largest audience (largest reach) or the
ones that generated the most virality (largest engagement)
Location Criteria: The logic for country detection within the tool is the following:
• Own list of URLs with associated countries (custom made)
• The language used in the post
• The IP address of the domain of the URL
With regards to Social Media platforms, we take in priority the location that is given by the respective Social Media
API. If these are not given to us, we fall back to confirm the location with the above mention as is used in website
country locations.
Media Type: Media in which the article/post was published. Media types can be news (and its sub categories), blogs,
forums, social media networks, …
Channels: Channels enable you to monitor specific channels without taking into consideration any keywords, meaning
all data published on the channel will flow into the system.
Channels can be social media pages (Facebook pages, Twitter profiles, YouTube channels, etc.) or any other sites where
you want to monitor all the data being published.
Performance (K; M; G): The performance widget shows how the selected topics are being perceived and interacted
with online via the buzz generated, engagement, potential reach and the proportion of the sentiment.
For the KPI widgets, the following metric prefixes are used:
• K – Kilo (1,000′s)
• M – Mega (1,000,000′s)
• G – Giga (1,000,000,000′s)
Project: A project includes one or more topics, monitored channels and specific filters that are relevant to the
monitoring of a brand or a company. The project also contains specific project settings, such as sources to include in the
results, and user definitions.
Reach: The reach of an article/post represents the number of people who were reached by this article/post.
Note that the views only get set to a proper value if the host of the URL is either a domain (like theguardian.com) or if it
is a domain with a well-known 3rd-level-subdomain in front (mainly applies to www, e.g. www.theguardian.com). Reach
is set to 0 for other hosts, i.e. hosts with other 3rd-level-subdomains, like on foobar.blogspot.com, as using the Alexa
views of the domain would assign much too high reach to mere sub-hosts otherwise.
Reach is calculated in the ways:
• Blogs; News Sites; Forums: Number of Page Views
• Facebook: The Number of Fans of the Page (Note: Only available for public pages)
• Twitter: The number of Followers of the author
RSS: Also known as ‘Really Simple Syndication’ – this is a standard web format that is used by many websites to
frequently publish information into. Talkwalker can have RSS links imported into it via the Channels section and can
also export the results found in projects in the format of RSS.
Search Query: A search query is the technical translation of the keywords and phrases that you wish to search for. For
some brands, search queries can be very easy (“Vodafone”), for other brands ("Apple"), they can be more complex.
Search Syntax: Terms and Operators which link together keywords in Search Queries to allow building of complex
Queries. Please see Detailed Search Query Syntax for more information.
Sentiment: Sentiment that is associated with an article/post. As default, a generic sentiment analysis is being calculated
for each result based on our own sentiment analysis. All articles/posts are then attributed a positive, neutral or negative
sentiment.
Source: A website, forum or social media site from which results are delivered and sourced from.
Source Panel: A list of sources which you wish to either restrict your results to, or stop results being delivered to your
project from.
Tag: Tags can be used to categorise your posts with relevant markers throughout your project. These are custom
identifies added to individual results to help you identify and group these results at a later time. The tags which have
been added to the project can be managed in the Tags section of your project settings. Please refer to Tags for more
information.
Topic: A topic contains the keywords and phrases you wish to search for within posts and articles, in the form of search
queries. The first topic is usually your brand and subsequent topics are typically competitor brands.
Appendix - Source Types
Media Source Types
ONLINENEWS
All news sites
ONLINENEWS_MAGAZINE
Printed magazines sites
ONLINENEWS_NEWSPAPER
Printed newspaper sites
ONLINENEWS_PRESSRELEASES
Results from sites that publish press releases
ONLINENEWS_TVRADIO
TV or radio stations
ONLINENEWS_AGENCY
News agencies
ONLINENEWS_OTHER
News results that do not fall under of the other news
categories
BLOG
All blog sites
MESSAGEBOARD
All forums and message boards
SOCIALMEDIA
All social media sites
SOCIALMEDIA_TWITTER
Results from Twitter
SOCIALMEDIA_FACEBOOK
Results from Facebook
SOCIALMEDIA_YOUTUBE
Results from YouTube
SOCIALMEDIA_LINKEDIN
Results from LinkedIn
SOCIALMEDIA_GOOGLEPLUS
Results from Google+
SOCIALMEDIA_FLICKR
Results from Flickr
SOCIALMEDIA_FOURSQUARE
Results from Foursquare
SOCIALMEDIA_INSTAGRAM
Results from Instagram
SOCIALMEDIA_MIXCLOUD
Results from Mixcloud
SOCIALMEDIA_SOUNDCLOUD
Results from SoundCloud
SOCIALMEDIA_VIMEO
Results from Vimeo
SOCIALMEDIA_DAILYMOTION
Results from Dailymotion
SOCIALMEDIA_WEIBO
Results from Weibo
OTHER
Everything else which does not fit into the above listed
categories
Please note that the above list is not the full entire list of possible sources, however it should cover
all of the sources you will need to use.
Language Codes
Overview
ABKHAZIAN
ab
AFAR
aa
AFRIKAANS
af
AKAN
ak
ALBANIAN
sq
AMHARIC
am
ARABIC
ar
ARAGONESE
an
ARMENIAN
hy
ASSAMESE
as
AVARIC
av
AVESTAN
ae
AYMARA
ay
AZERBAIJANI
az
BAMBARA
bm
BASHKIR
ba
BASQUE
eu
BELARUSIAN
be
BENGALI
bn
BIHARI
bh
BISLAMA
bi
BOSNIAN
bs
BRETON
br
BULGARIAN
bg
BURMESE
my
CATALAN
ca
CHAMORRO
ch
CHECHEN
ce
CHINESE
zh
CHINESE_SIMPLIFIED
zh_cn
CHINESE_TRADITIONAL
zh_tw
CHURCH_SLAVIC
cu
CHUVASH
cv
CORNISH
kw
CORSICAN
co
CREE
cr
CROATIAN
hr
CZECH
cs
DANISH
da
DIVEHI
dv
DUTCH
nl
DZONGKHA
dz
ENGLISH
en
ESPERANTO
eo
ESTONIAN
et
EWE
ee
FAROESE
fo
FIJIAN
fj
FINNISH
fi
FRENCH
fr
FRISIAN
fy
FULAH
ff
GALLEGAN
gl
GANDA
lg
GEORGIAN
ka
GERMAN
de
GREEK
el
GREENLANDIC
kl
GUARANI
gn
GUJARATI
gu
HAITIAN
ht
HAUSA
ha
HEBREW
he
HERERO
hz
HINDI
hi
HIRI_MOTU
ho
HUNGARIAN
hu
ICELANDIC
is
IDO
io
IGBO
ig
INDONESIAN
id
INTERLINGUA
ia
INTERLINGUE
ie
INUKTITUT
iu
INUPIAQ
ik
IRISH
ga
ITALIAN
it
JAPANESE
ja
JAVANESE
jv
KANNADA
kn
KANURI
kr
KASHMIRI
ks
KAZAKH
kk
KHMER
km
KIKUYU
ki
KINYARWANDA
rw
KIRGHIZ
ky
KOMI
kv
KONGO
kg
KOREAN
ko
KURDISH
ku
KWANYAMA
kj
LAO
lo
LATIN
la
LATVIAN
lv
LIMBURGISH
li
LINGALA
ln
LITHUANIAN
lt
LUBA_KATANGA
lu
LUXEMBOURGISH
lb
MACEDONIAN
mk
MALAGASY
mg
MALAY
ms
MALAYALAM
ml
MALTESE
mt
MANX
gv
MAORI
mi
MARATHI
mr
MARSHALLESE
mh
MOLDAVIAN
mo
MONGOLIAN
mn
NAURU
na
NAVAJO
nv
NDONGA
ng
NEPALI
ne
NORTHERN_SAMI
se
NORTH_NDEBELE
nd
NORWEGIAN
no
NORWEGIAN_BOKMAL
nb
NORWEGIAN_NYNORSK
nn
NYANJA
ny
OCCITAN
oc
OJIBWA
oj
ORIYA
or
OROMO
om
OSSETIAN
os
PALI
pi
PANJABI
pa
PERSIAN
fa
POLISH
pl
PORTUGUESE
pt
PUSHTO
ps
QUECHUA
qu
RAETO_ROMANCE
rm
ROMANIAN
ro
RUNDI
rn
RUSSIAN
ru
SAMOAN
sm
SANGO
sg
SANSKRIT
sa
SARDINIAN
sc
SCOTTISH_GAELIC
gd
SERBIAN
sr
SHONA
sn
SICHUAN_YI
ii
SINDHI
sd
SINHALESE
si
SLOVAK
sk
SLOVENIAN
sl
SOMALI
so
SOUTHERN_SOTHO
st
SOUTH_NDEBELE
nr
SPANISH
es
SUNDANESE
su
SWAHILI
sw
SWATI
ss
SWEDISH
sv
TAGALOG
tl
TAHITIAN
ty
TAJIK
tg
TAMIL
ta
TATAR
tt
TELUGU
te
THAI
th
TIBETAN
bo
TIGRINYA
ti
TONGA
to
TSONGA
ts
TSWANA
tn
TURKISH
tr
TURKMEN
tk
TWI
tw
UIGHUR
ug
UKRAINIAN
uk
URDU
ur
UZBEK
uz
VENDA
ve
VIETNAMESE
vi
VOLAPUK
vo
WALLOON
wa
WELSH
cy
WOLOF
wo
XHOSA
xh
YIDDISH
yi
YORUBA
yo
ZHUANG
za
ZULU
zu
Country Codes
Overview
AFGHANISTAN
af
ALAND_ISLANDS
ax
ALBANIA
al
ALGERIA
dz
AMERICAN_SAMOA
as
ANDORRA
ad
ANGOLA
ao
ANGUILLA
ai
ANTARCTICA
aq
ANTIGUA_AND_BARBUDA
ag
ARGENTINA
ar
ARMENIA
am
ARUBA
aw
AUSTRALIA
au
AUSTRIA
at
AZERBAIJAN
az
BAHAMAS
bs
BAHRAIN
bh
BANGLADESH
bd
BARBADOS
bb
BELARUS
by
BELGIUM
be
BELIZE
bz
BENIN
bj
BERMUDA
bm
BHUTAN
bt
BOLIVIA
bo
BONAIRE_SINT_EUSTASIUS_AND_SABA
bq
BOSNIA_AND_HERZEGOVINA
ba
BOTSWANA
bw
BOUVET_ISLAND
bv
BRAZIL
br
BRITISH_INDIAN_OCEAN_TERRITORY
io
BRITISH_VIRGIN_ISLANDS
vg
BRUNEI
bn
BULGARIA
bg
BURKINA_FASO
bf
BURUNDI
bi
CAMBODIA
kh
CAMEROON
cm
CANADA
ca
CAPE_VERDE
cv
CAYMAN_ISLANDS
ky
CENTRAL_AFRICAN_REPUBLIC
cf
CHAD
td
CHILE
cl
CHINA
cn
CHRISTMAS_ISLAND
cx
COCOS_ISLANDS
cc
COLOMBIA
co
COMOROS
km
CONGO
cg
COOK_ISLANDS
ck
COSTA_RICA
cr
COTE_DIVOIRE
ci
CROATIA
hr
CUBA
cu
CURACAO
cw
CYPRUS
cy
CZECH_REPUBLIC
cz
DENMARK
dk
DJIBOUTI
dj
DOMINICA
dm
DOMINICAN_REPUBLIC
do
ECUADOR
ec
EGYPT
eg
EL_SALVADOR
sv
EQUATORIAL_GUINEA
gq
ERITREA
er
ESTONIA
ee
ETHIOPIA
et
FALKLAND_ISLANDS
fk
FAROE_ISLANDS
fo
FIJI
fj
FINLAND
fi
FRANCE
fr
FRENCH_GUIANA
gf
FRENCH_POLYNESIA
pf
FRENCH_SOUTHERN_TERRITORIES
tf
GABON
ga
GAMBIA
gm
GEORGIA
ge
GERMANY
de
GHANA
gh
GIBRALTAR
gi
GREECE
gr
GREENLAND
gl
GRENADA
gd
GUADELOUPE
gp
GUAM
gu
GUATEMALA
gt
GUERNSEY
gg
GUINEA
gn
GUINEA_BISSAU
gw
GUYANA
gy
HAITI
ht
HEARD_ISLAND_AND_MCDONALD_ISLANDS
hm
HONDURAS
hn
HONG_KONG
hk
HUNGARY
hu
ICELAND
is
INDIA
in
INDONESIA
id
IRAN
ir
IRAQ
iq
IRELAND
ie
ISLE_OF_MAN
im
ISRAEL
il
ITALY
it
JAMAICA
jm
JAPAN
jp
JERSEY
je
JORDAN
jo
KAZAKHSTAN
kz
KENYA
ke
KIRIBATI
ki
KUWAIT
kw
KYRGYZSTAN
kg
LAOS
la
LATVIA
lv
LEBANON
lb
LESOTHO
ls
LIBERIA
lr
LIBYA
ly
LIECHTENSTEIN
li
LITHUANIA
lt
LUXEMBOURG
lu
MACAO
mo
MACEDONIA
mk
MADAGASCAR
mg
MALAWI
mw
MALAYSIA
my
MALDIVES
mv
MALI
ml
MALTA
mt
MARSHALL_ISLANDS
mh
MARTINIQUE
mq
MAURITANIA
mr
MAURITIUS
mu
MAYOTTE
yt
MEXICO
mx
MICRONESIA
fm
MOLDOVA
md
MONACO
mc
MONGOLIA
mn
MONTENEGRO
me
MONTSERRAT
ms
MOROCCO
ma
MOZAMBIQUE
mz
MYANMAR
mm
NAMIBIA
na
NAURU
nr
NEPAL
np
NETHERLANDS
nl
NETHERLANDS_ANTILLES
an
NEW_CALEDONIA
nc
NEW_ZEALAND
nz
NICARAGUA
ni
NIGER
ne
NIGERIA
ng
NIUE
nu
NORFOLK_ISLAND
nf
NORTHERN_MARIANA_ISLANDS
mp
NORTH_KOREA
kp
NORWAY
no
OMAN
om
PAKISTAN
pk
PALAU
pw
PALESTINE
ps
PANAMA
pa
PAPUA_NEW_GUINEA
pg
PARAGUAY
py
PERU
pe
PHILIPPINES
ph
PITCAIRN
pn
POLAND
pl
PORTUGAL
pt
PUERTO_RICO
pr
QATAR
qa
REUNION
re
ROMANIA
ro
RUSSIA
ru
RWANDA
rw
SAINT_BARTHELEMY
bl
SAINT_HELENA
sh
SAINT_KITTS_AND_NEVIS
kn
SAINT_LUCIA
lc
SAINT_MARTIN
mf
SAINT_PIERRE_AND_MIQUELON
pm
SAINT_VINCENT_AND_THE_GRENADINES
vc
SAMOA
ws
SAN_MARINO
sm
SAO_TOME_AND_PRINCIPE
st
SAUDI_ARABIA
sa
SENEGAL
sn
SERBIA
rs
SERBIA_AND_MONTENEGRO
cs
SEYCHELLES
sc
SIERRA_LEONE
sl
SINGAPORE
sg
SINT_MAARTEN
sx
SLOVAKIA
sk
SLOVENIA
si
SOLOMON_ISLANDS
sb
SOMALIA
so
SOUTH_AFRICA
za
SOUTH_GEORGIA_AND_THE_SOUTH_SANDWICH_ISLANDS gs
SOUTH_KOREA
kr
SOUTH_SUDAN
ss
SPAIN
es
SRI_LANKA
lk
SUDAN
sd
SURINAME
sr
SVALBARD_AND_JAN_MAYEN
sj
SWAZILAND
sz
SWEDEN
se
SWITZERLAND
ch
SYRIA
sy
TAIWAN
tw
TAJIKISTAN
tj
TANZANIA
tz
THAILAND
th
THE_DEMOCRATIC_REPUBLIC_OF_CONGO
cd
TIMOR_LESTE
tl
TOGO
tg
TOKELAU
tk
TONGA
to
TRINIDAD_AND_TOBAGO
tt
TUNISIA
tn
TURKEY
tr
TURKMENISTAN
tm
TURKS_AND_CAICOS_ISLANDS
tc
TUVALU
tv
UGANDA
ug
UKRAINE
ua
UNITED_ARAB_EMIRATES
ae
UNITED_KINGDOM
uk
UNITED_STATES
us
UNITED_STATES_MINOR_OUTLYING_ISLANDS
um
URUGUAY
uy
US_VIRGIN_ISLANDS
vi
UZBEKISTAN
uz
VANUATU
vu
VATICAN
va
VENEZUELA
ve
VIETNAM
vn
WALLIS_AND_FUTUNA
wf
WESTERN_SAHARA
eh
YEMEN
ye
ZAMBIA
zm
ZIMBABWE
zw
Talkwalker Query Syntax
A single search query can support up to 50 operands and be up to 1024 characters long in length. To create complex
queries, operands may be combined using Boolean Operators.
All queries are executed in their unaccented and case insensitive form, thus a search for "éléVE" will also match all
documents with the word "eleve". No language stemming is being done, thus a search for the "children" won’t return
results with the word "child".
Special Transformations
These transformations apply when a query contains no operators from the query syntax (quotes,
AND, OR,
wildcards etc,
see below).
Words with only capital letters (and special chars +-&) are executed as exact (case sensitive) raw data search (ABC = ++"ABC",
A&B
= ++"A&B").
Screen names (@name), hashtags (#hashtag), cashtags ($cashtag) as well as words containing a dash (-), a plus (+) or an
ampersand (&) are executed as (case insensitive) raw data search (@username = +"@username" , p&t = +"p&t").
If a query contains multiple simple words (no special characters like (#@+-&), no operators and is not only capital letters, it
is executed as a proximity search. The maximum number of jumps is set to (#words - 1) * 10 (cat
dog mouse bird
=
"cat dog
mouse bird"~30).
To prevent this behaviour use the explicit query syntax below. (instead of
mouse
or "cat
dog mouse"
cat dog mouse
use
cat OR dog OR mouse, cat AND dog AND
to search for one of the words, all the words or the exact phrase.
Boolean Operators
combines two keywords: BMW AND bike will find all entries which mention the
keyword BMW and the keyword bike.
BMW AND bike
excludes a word of an entry: BMW AND NOT bike will find all entries with the
keyword BMW, but only if the notion bike is not contained in the same article.
BMW AND NOT bike
OR
means that a least one of the terms which are linked by an OR have to be
mentioned in the same article: BMW OR bike will find all entries that include
either the keyword BMW or the keyword bike.
BMW AND NOT bike BMW
OR bike
Exclusion of
Keywords
Negative filters can be created by using the operator NOT.
NOT coupons
Phrase Search
Quotes "" are used for finding keyword sequences: "BMW series" will find all
entries which contain the phrase "BMW series". In contrast the search query
BMW AND series does not respect the order.
"bmw series"
Combinations
Brackets () are used to group several keywords in a way that operators can be
applied on multiple terms within the brackets (distributive law). BMW AND
(motorcycle OR car) is a shortform for (BMW AND motorcycle) OR (BMW AND car)
BMW AND (motorcycle OR
car)
AND
AND
AND NOT
AND NOT
OR
Wildcard Search
The Wildcard operator * is a character that stands for 0 or any possible
number. Wildcards are only accepted at the end of a keyword: Luxemb* will find
all entries including keyworks like Luxembourg , Luxemburg, Luxemburgisch
or any other keyword with the prefix Luxemb.
Luxemb*
Wildcard Search
– one character
The question mark ? has a similar function as the wildcard operator, but only
replaces exactly one character, i.e. it is useful in consideration of British and
American English, e.g.: reali?ation finds realisation but also realization.
reali?ation
Proximity Search The tilde symbol ~ analyses the surroundings of a character string which is
enclosed in quotes (consisting at least two words). You cannot combine the
tilde with the wildcard operator. e.g. "obama merkel"~5 finds "A statement released
from the White House said Obama, Monti and Merkel agreed on certain steps"
(3 jumps between both words), "obama merkel"~5 finds every entry, containing the
keywords obama and merkel within an interval of maximum of 5 jumps.
"obama merkel"~5
Fuzzy X Search
The tilde symbol ~X after a word searches for words similar to the given word.
The value after the tilde (0, 1 or 2) defines the number of changed characters.
roam~1 will also find foam.
roam~1
Fuzzy Search
The tilde symbol ~ after a word will find this word as a two part word with a
hyphen, space or other special character in it. carsharing~ will find carsharing, carsharing, car sharing etc
carsharing~
Raw Data Search
A simple + in front of a keyword samples an exact character string including
special characters and punctuation, it does not consider lower and upper
cases. It also works with brackets and tilde: +"l'oral" or +"d&g" etc
+"l'oréal"
Exact Raw Data
Search
Two ++ in front of a keyword samples an exact character string including
special characters and punctuation, it does consider lower and upper cases. It
also works with brackets and tilde: ++"L'Oréal"
++"L'Oréal"
NEAR/x
The NEAR/x operator works similar to the proximity search operator, but also
works with parentheses and thus can be used with multiple terms. (default
value for x: 15)
(BMW OR Audi) NEAR/3
(motorcycle OR car)
ONEAR/x
Same as NEAR/x but respects the order of terms.
(BMW OR Audi) ONEAR/3
(motorcycle OR car)
Sentence Search
The SENTENCE operator works similar to the NEAR/x operator. It searches for
keywords that appear in the same sentence. SENTENCE can also be used with
multiple terms.
(BMW OR Audi) SENTENCE
(motorcycle OR car)
Ordered Sentence Same as SENTENCE but respects the order of terms in the sentence.
Search
(BMW OR Audi)
OSENTENCE (motorcycle
OR car)
Note:
In phrase search and raw data phrase search ("" or
+"")
the number and type white space characters are ignored. For
example "BMW series" (one space) will also match documents which contain "BMW series" (two spaces) and vice versa.
White space characters include spaces, tabs and new line characters, also transitions between letters and special
characters are considered as whitespace. For example +"P&T" will match P&T but also P& T and P & T.
Advanced Search Options:
Single Keyword
Search
Search for simple brands, products, keywords, etc.
Apple
Title Search
It searches within the title of an article. title:sixt will find all results which
contain the keyword sixt within the title. title:"obama merkel"~5 matches with:
Obama Seeking Ally Finds Merkel a Tough Sell
title:sixt
title:"obama merkel"~5
Content Search
It searches within the article content:sixt will find all results which mention the
keyword within the main text of the article.
content:sixt
Author Search
It searches for authors of articles. author:Franz will find all results containing
articles which defined Franz as author.
author:Franz
Language Search
It searches for languages of articles. lang:de only indicates German results.
lang:de
Source Country
Restriction
It searches for the country of origin of sources. sourcecountry:de filters all articles
from German sources and which were published in Germany.
sourcecountry:de
Author Country
Restriction
If the author is in a specifiy country when writing posts, authorcountry:fr limits
results to ones from French authors.
authorcountry:de
Source Type
Restriction
sourcetype:"BLOG"
restricts results to a specific media/source type. Returns only
sourcetype:BLOG
BLOG entries.
Comments Search Find only comments by setting is:comment or without comments (-is:comment)
is:comment
Retweets Search
Find only retweets with is:retweet or exclude retweets with -is:retweet and get
only original posts
is:retweet
Twitter Reply
Search
Find only tweets that are replies to other tweets
is:twitter_reply
Questions Search Search for questions. is:question will find only documents that are questions.
is:question
Image Search
contains:image
returns those documents that include images
contains:image
Audio Search
contains:audio
returns those documents that include audio
contains:audio
Video Search
contains:video
returns those documents that include videos
contains:video
Talkwalker Tags
Search
finds all documents that were manually tagged as important in
Talkwalker. is:read finds documents that were read (original document link
opened). is:checked finds documents were the sentiment has been checked
manually in the project
is:important, is:read,
is:checked
finds all documents that were manually tagged with the respective
score. (In a Talkwalker project scores can be added to a selected document by
pressing the number keys)
score:4
allows to search only for documents of type image. Possible
values are TEXT LINK IMAGE VIDEO AUDIO.
posttype:LINK
is:important
Score Search
score:n
Post Type Search
posttype:IMAGE
Url based Search
returns the document with this exact url. Prefix Wildcard (e.g. *apple)
matching is not supported.
url:http://twitter.com
/bmw
/status/56192586115556
1473
returns all child documents (comments or retweets) from a
document specifed by the given url. E.g. Give me all the comments for this
document url.
parenturl:http://twitt
er.com/bmw
/status/56192586115556
1473
Url Search
url:
Parent Url Search
parenturl:
Host Url
Restriction
returns all the documents from the host www.spiegel.de
hosturl:"http://www.sp
iegel.de/"
returns all the documents from the domain Spiegel.de. Pay
attention not to insert www. into the query
domainurl:"http://spie
gel.de/"
returns all documents from the site twitter.com/bmw/.
site:googleblog.blogspot.com returns documents from googleblog.blogspot.com. Pay
attention to end with a / if the site includes a specific path (/bmw/) but not if it
ends with the top level domain (.com)
site:googleblog.blogsp
ot.com
site:blogspot.com
site:twitter.com/bmw/
returns all documents which have the keyword facebook anywhere
in their url, or which have it in any referenced url in the content.
inurls:facebook
hosturl:"www.spiegel.de"
Domain Url
Restriction
domainurl:spiegel.de"
Site Search
site:twitter.com/bmw/
In Urls Search
inurls:facebook
Metric (Minimum / Maximum) Restrictions
metric_name:>n
,
metric_name:<n
and
metric_name:n
return only documents which match a specific value or range of a metric.
Following tables explains the possible metrics
metric_name
Description
Example
reach
The reach of an article/post represents the number of people who
were reached by this article/post.
reach:>100
engagement
The engagement of an article/post is the sum of actions made by others
on that article/post.
engagement:<1000
facebook_shares
Number of Facebook share an article has
facebook_shares:0
facebook_likes
Number of Facebook likes an article has
facebook_likes:>0
twitter_retweets
Number of Twitter retweets an article has
twitter_retweets:>1000
twitter_shares
Number of Twitter share an article has
twitter_shares:0
twitter_followers
Number of Twitter followers a source has
twitter_followers:>1000
youtube_views
Number of YouTube views a video has
youtube_views:>100000
youtube_likes
Number of YouTube likes a video has
youtube_likes:>100
youtube_dislikes
Number of YouTube dislikes a video has
youtube_dislikes:>0
comment_count
Number of Comments an article has
comment_count:>0
published
Timestamp of publication (epoch time in milliseconds)
published:>1420731027000
searchindexed
Timestamp of indexation in Talkwalker (epoch time in milliseconds)
searchindexed:>1420731027000
sample
Get a random sample of the results (percent of the total number of
results i.e. setting 25 will return one of four the documents) values:1100
sample:25
sample_million
Similar to sample_percent, with higher precision (i.e. setting 2000 will
return one of 500 documents) values:1-1000000
sample_million:2000
sentiment
The detected sentiment of the article (values -5 (negative) to 5
(prositive)). sentiment:positive, sentiment:negative and sentiment:neutral map to
the respective sentiment ranges of Talkwalker
sentiment:>0
sentiment:negative
Geographic Restrictions
Note: Some documents have precise geographic data in form of GPS measured coordinates provided by the source. For
other documents this data is based on source metadata, with a certain precision level. These levels (ordered from lowest
precision to highest) are: country, region and city (extracted data) and coordinates (exact data).
The coordinates for lower precision geographic data are equal to their capital.
Restriction
Description
Example
sourcegeo
Restricts the results to a rectangular geographic area defined by the
coordinates (latitude,longitude) of the upper left and lower right corner.
sourcegeo:50.3,5.7;49.4,6.5
sourcegeo_resolution
Restricts to documents that have a minimum precision level of
location data. Possible levels are coordinates, city, region and country.
default: all documents
sourcegeo_resolution:coordin
ates
Example: Search for documents that are in a box that roughly corresponds to Luxembourg and have exact coordinates.
Luxembourg’s north end is at around 50.3°, south is at 49.4°, west at 5.7° and east at 6.5°, the upper left corner is 50.3,5.7 the
lower right corner is 49.4,6.5. The final query is : sourcegeo:50.3,5.7;49.4,6.5
AND sourcegeo_resolution:coordinates.
Special Query Modifiers
All queries are executed in their unaccented and case insensitive form on the content and the title of documents. To
change this behaviour, use flag:<modifier_name> to enable special query modes.
Modifier Name
Description
Example
matchinurls
Query will also match URLs and links.
flag:matchinurls
matchauthor
Query will also match author field
flag:matchauthor
matchexact
Use Raw data search as default. All keywords are considered as caseinsensitive exact character string including special characters and
punctuation.
flag:matchexact
matchexactcase
Use Exact raw data search as default. All keywords are considered as
case-insensitive exact character string including special characters and
punctuation.
flag:matchexactcase
matchfuzzywords
Use Fuzzy Search as default. All keywords will also match combined
words carsharing will match words like carsharing, car-sharing or car sharing.
flag:matchfuzzywords
The special modifiers can be combined:
carsharing flag:matchauthor flag:matchfuzzywords
searches for words like carsharing, car
sharing or car-sharing in the fields title, content and author_name.
Note: When
matched.
matchinurls
or
matchauthor
is set, API results will not have highlighting in snippets when one of these fields is