1
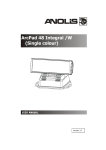
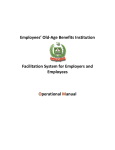
Facebook Page Insights
Product Guide for Facebook Page owners
Businesses will be better in a connected world. That’s why
we connect 800M people and their friends to the things they
care about, using social technologies that drive business
growth. Pages are where you connect with people.
With Pages Insights, you can:
• Understand the performance of your Page;
• Learn which content resonates with your audience; and
• Optimize how you publish to your audience so that
people will tell their friends about you.
Get started . . . . . . . . . . . . . . . . . . . . . . . . . . . . . . . . . . . . . . . . . . . . . . . . . . . . . 2
Understand the overall performance of your Page. . . . . . . . . . . . . . . 4
Optimize how you publish to your audience . . . . . . . . . . . . . . . . . . . . . 6
Learn more about your audience . . . . . . . . . . . . . . . . . . . . . . . . . . . . . . . . 9
Conclusion: Focus on engaging your audience. . . . . . . . . . . . . . . . . . 15
© 2011 Facebook, Inc. All rights reserved. Product specifications subject to change without notice.
Page Insights
Get started
To see insights about your Facebook Page, visit your Page and click on the Insights tab on the left-hand
side of your Page.*
* Please note that the new Page Insights is initially launching as a preview. To access it during the preview period,
please visit facebook.com/insights and click on your Page, or click on “View Insights” on the right-hand side of
your Page, then follow the instructions at the top of the Insights page.
© 2011 Facebook, Inc. All rights reserved. Product specifications subject to change without notice.
2
Page Insights
You can review your Insights data through the dashboard, or export it using the ‘Export’ button in the
top right corner.
If you decide to export it, a dialog box will allow you to specify:
•
The date range for which you want to see data about your Page;
•
Whether you would like to get the data as as an Excel file or as a CSV (comma separated values) file;
•
The type of data you want to see: select “Page level data” for aggregated data about your Page, and
“Post level data” for data on each of your Page posts.
The “Key Metrics” tab of the Excel file contains all the high level metrics across time. All other
individual tabs show you a breakdown of these high level metrics. Please note that while the number of
impressions that your Page or posts got is not available in the Page Insights dashboard, it is available in
the “Export” file.
© 2011 Facebook, Inc. All rights reserved. Product specifications subject to change without notice.
3
Page Insights
Understand the overall performance of your Page
The four metrics at the top of your Insights tab allow you to quickly understand the size and engagement of
your audience. You should monitor these metrics closely to assess the success of your marketing strategy.
Total Likes:
The number of
unique people who
like your Page.
Friends of Fans:
The number of unique people
who are friends with your
fans, including your current
fans.
People Talking About
This:
The number of unique
people who have
created a story about
your Page in the last
seven days.
Total Reach:
The number of unique
people who have seen any
content associated with
your Page (including any
Ads or Sponsored Stories
pointing to your Page) in the
last seven days.
You can hover over the question mark next to the metric to see the time frame of each metric.
Because friends of fans represent a much larger set of consumers than fans alone and are much more likely
than the average consumer to visit a store, website, and even purchase a product or service*, you can see
not only how many fans you have (Total Likes) but also how many friends your fans have (Friends of Fans).
Friends of fans represent the total number of people you could potentially reach if all of your fans were
talking about your business to their friends.
The next metric, “People Talking About This”, indicates how many people are actually talking about your
business to their friends. This metric includes everyone who:
•
•
•
•
•
•
•
Liked your Page
Liked, commented on, or shared your Page post
Answered a Question you’ve asked
Responded to your event
Mentioned your Page
Tagged your Page in a photo
Checked in or recommended your Place
Getting more people to talk about your business allows you to reach more people. You can see how many
people your Page is reaching by looking at the “Total Reach” metric.
Please note that two of these metrics - Total Likes and People Talking About This - are visible to anyone
visiting any Page. As a result, people who visit your Page can look at these two metrics to understand how
popular, active and engaging your Page is.
* According to research from comScore, 2011.
© 2011 Facebook, Inc. All rights reserved. Product specifications subject to change without notice.
4
Page Insights
Posting regularly with engaging content gets more people to talk about your business with their
friends. As a result, you end up reaching more people overall. The following graph shows you how the
posts that you publish to your Page influence the number of people talking about you, and how the
number of people talking about you influences your overall reach.
People Talking About This: The number of unique people who have created a story
about your Page in the 7 days leading up to each date shown on the chart.
Total Reach: The number of unique people who have seen
any content associated with your Page (including any Ads or
Sponsored Stories pointing to your Page) in the 7 days leading up
to each date shown on the chart.
Number of posts: The size of the bubbles represents
the number of posts your Page published each day.
This chart shows data for the last 30 days.
© 2011 Facebook, Inc. All rights reserved. Product specifications subject to change without notice.
5
Page Insights
Optimize how you publish to your audience
Your ultimate goal as a Page owner is to publish content that will reach a large audience, and that your
audience will engage and share your content with friends. Now you can use Page Insights to better
understand what your audience wants to hear about.
This section of Insights gives you deep analytics on every single one of your Page posts, so that you can
understand at a granular level how many people your post reached, how many people engaged with
it, and how many people talked about it with their friends. The “virality” column will also allow you to
compare your different posts by showing the % of people who talked about your post to their friends
after seeing it.
Date: The day this post was
published, in Pacific Standard Time.
Engaged Users: The number of
unique people who have clicked
anywhere on your post.
Post: An extract from your post. Click
on the text to see the full version.
Reach: The number of unique
people who have seen your post.
Talking About This: The number of unique
people who have created a story from your
Post. Stories include:
• Liking, commenting on or sharing your post
• Answering a Question
• Responding to an event
Virality: The number of
unique people who have
created a story from your
Page Post as a percentage
of the number of unique
people who’ve seen it.
Figures only include the first 28 days after the publication of the post. Only posts published after July 19th, 2011 are available.
Based on this data, you should try to identify which types of posts are most effective at helping you
reach your objectives. Do your fans respond better to videos than pictures? Do they always seem
to engage more when you talk about a specific theme? Do they tend to “like” more when you post a
picture and “comment” more when you ask them a question?
And we’ve made it easy for you to see the posts to see which ones generate the most reach, engaged
users or people talking about this. You can sort all posts by clicking on the title of each column.
© 2011 Facebook, Inc. All rights reserved. Product specifications subject to change without notice.
6
Page Insights
!
Each of the columns of the list of posts gives you a different perspective on the success of
your publishing strategy, depending on your objectives. For example, if you are a movie studio
and want to drive awareness of a new movie, you will mostly focus on “reach” and “engaged
users” to understand how many people your trailer reached and how many watched it.
However, if you are an automotive company asking people about their favorite feature in your
latest car, you will likely look at the “People Talking About This” column to assess success.
By clicking on any data point in this list of posts, you can see more details such as the full text of the
post, or the different types of engagement and stories this post generated.
The Reach graph allows you to understand by which channel (organic, paid or viral) your post reached
its audience. Please note that, since people might have seen your post through several channels, the
sum of organic, paid and viral reach might be larger than your total post reach.
Organic: The number of unique people, fans or nonfans, who saw this post in their News Feed, Ticker or
on your Page.
Paid: The number of unique people who saw this post
from a sponsored product, such as a Page Post Ad or
Sponsored Stories.
Viral: The number of unique people who saw this
post from a story published by a friend. These stories
can include liking, commenting or sharing your post,
answering a Question or RSVP-ing to an event.
© 2011 Facebook, Inc. All rights reserved. Product specifications subject to change without notice.
7
Page Insights
The Engaged Users graph allows you to understand the different types of engagements your post
generated. Anyone clicking anywhere on your post is considered an “Engaged User.” The types of
engagement you can find in the pie chart include all the different ways people can consume your post
(clicking on a link, viewing a picture, watching a video...), spread it to friends (by liking it, commenting
on it, answering a Question, RSVP-ing to an event, etc...) or simply click on some other area of your post
(“Other Clicks”).
Video plays: The number of times the play
button of your video was clicked on.
Photo views: The number of times your photo
was viewed in its full size.
Link clicks: The number of time the link included
in your post was clicked on.
Other clicks: The number of clicks on your post
that are not counted in other metrics. These
clicks can include clicks on people’s names in
comments, clicks on the like count, clicks on the
time stamp, etc.
Stories generated: The number of stories that
were created from your post. Stories include
liking, commenting on or sharing your post,
answering a Question or RSVP-ing to an event.
The Talking About This graph shows all the different types of stories that your post generated. Please
note that, since People Talking About This are a subset of Engaged Users, this graph offers a more
granular breakdown of the “stories generated” section of the “Engaged Users” pie chart.
Likes: The number of likes on your post.
Shares: The number of times your post was shared.
Comments: The number of comments on your post.
Event RSVPs: The number of times people
responded to your event.
Questions answered: The number of times your
question was answered.
© 2011 Facebook, Inc. All rights reserved. Product specifications subject to change without notice.
8
Page Insights
Learn more about your audience
Understanding who your audience is and how you’re reaching it is key to optimizing your Page strategy.
This information helps you publish content that people will want to see, engage with and talk about to
their friends. For example, if you discover that the majority of people who like your Page are men 18 to
24, you might decide to adapt the content you publish to fit with the interests of these young men.
By clicking on the Fans, Reach, and Talking About This tabs on the left-hand side of your Page, you can
learn more about:
•
Who your fans, the people you reached with your messages, and the people who talk about your
Page are
•
How you acquired, reached or engaged them
You can specify the date range for which you want to see data by selecting dates from the date selector at the top of each tab.
Fans tab
The Fans tab helps you understand who your fans are and how you acquired them.
Gender and Age:
The percentage of
people who liked
your Page for each
age and gender
bracket as of the last
day of your selected
date range. This is
based on the data
people enter in their
profile.
Countries: The number of
people who liked your Page
as of the last day of your
selected date range, broken
down by country. This is based
on the user’s IP address.
Cities: The number of people
who liked your Page as of the
last day of your selected date
range, broken down by city.
This is based on the user’s IP
address.
Languages: The number of people
who liked your Page as of the last
day of your selected date range,
broken down by language. This
is based on the user’s default
language setting.
© 2011 Facebook, Inc. All rights reserved. Product specifications subject to change without notice.
9
Page Insights
New Likes: The total number of
unique people who have liked
your Page each day during your
selected date range.
Unlikes: The total number of
unique people who have unliked
your Page each day during your
selected date range.
Like Sources: The number of times your Page was liked, broken down by where the Like happened (on
your Page, from News Feed, on your website, etc.), during your selected date range.
On Page, News Feed, or Ticker: People who liked your
Page on the Page itself or in a News Feed or Ticker story.
Ads and Sponsored Stories: People who clicked “Like”
in an ad or Sponsored Story pointing to your Page. This
does not include view-through or click-through Likes that
occurred after people viewed your ad.
Facebook Recommendations: People who liked your
page from Facebook “Recommended Pages”.
Mobile: People who liked your Page from a mobile device.
New User Wizzard: People who liked your Page in
the New User Wizard when registering for Facebook.
Third party applications: People who liked your Page via
an application developed by a third party.
Page Likes Another Page: Pages that have liked your Page.
Admin Registration: People you added to your Page
as admins.
Timeline Edit: People who added your page to their Likes
on their Timeline.
Admin Registration: People you added to your Page
as admins.
Page Browser: People who liked your Page using
Facebook’s Page Browser.
Admin invite: People who liked your Page through
an invite from an admin.
Like box or Like button: People who liked your Page
from an external site using a Facebook social plugin.
© 2011 Facebook, Inc. All rights reserved. Product specifications subject to change without notice.
10
Page Insights
Reach tab
The Reach tab helps you understand who the people you are reaching are and how you managed to
reach them.
Gender and Age:
The percentage of
people who saw
any content about
your Page in the
last seven days for
each age and gender
bracket, as of the
last day of your
selected date range.
This is based on the
data people enter in
their profile.
Countries: The number of
people who saw any content
about your Page in the last
seven days, broken down by
country, as of the last day of
your selected date range, .
This is based on the user’s IP
address.
Cities: The number of people
who saw any content about
your Page, in the last seven
days, broken down by city,
as of the last day of your
selected date range. This is
based on the user’s IP address.
Languages: The number of people
who saw any content about
your Page, in the last seven days,
broken down by language, as of
the last day of your selected date
range. This is based on the user’s
default language setting.
© 2011 Facebook, Inc. All rights reserved. Product specifications subject to change without notice.
11
Page Insights
Reach graph: This graph shows how many people have seen any content about your Page and whether
these people were reached through an organic, paid or viral channel. People might see your content
through more than one of these channels, so the sum of your organic, paid and viral reach might be
larger than your total Page reach.
Organic: The number of unique people, fans or nonfans, who saw any content about your Page in their
News Feed, Ticker or on your Page.
Paid: The number of unique people who saw an ad
or Sponsored Story that pointed to your Page.
Viral: The number of unique people who saw this
post from a story published by a friend.
Frequency graph: This graph shows the number of people who have seen content about your Page in
the last 7 days, broken down by the number of times they saw it during that time.
For example, you can see on this graph that
about 5,000,000 people were exposed to any
content about your Page once, and about
2,000,000 people were exposed to it twice.
Please note that you can further refine the data shown in the Reach and Frequency graphs by selecting
to see all content about the Page, only Page posts only, or only content about the Page generated by
users from the dropdown menu.
© 2011 Facebook, Inc. All rights reserved. Product specifications subject to change without notice.
12
Page Insights
Page Views: The number of times
your Page was viewed on each day
during your selected date range.
Unique Visitors: The number of
unique people who visited your
Page on each day during your
selected date range.
Total Tab Views: The number of
times each of your Page tabs were
viewed during your selected date
range.
External Referrers: The number
of times people arrived on your
Page from a URL that is not part
of facebook.com, during your
selected date range.
!
How to interpret the demographic data across several tabs
While you might see in the Fans tab that your fan base is mostly comprised of women
between 35 and 44, you might realize by looking at the “Talking about this” tab that the people
who are talking about your business to their friends are actually mostly women between 18
and 24.
If your current content is geared towards an older audience, you might consider posting more
content that resonates with a younger audience since these younger women seem more likely
to spread the word to friends.
Or if your current content is geared towards younger women, then you might consider posting
content that resonates better with a 35 to 44 years old women audience to get these older
women to start talking about you.
© 2011 Facebook, Inc. All rights reserved. Product specifications subject to change without notice.
13
Page Insights
Talking About This tab
The Talking About This tab helps you understand who the people talking about your Page are, and the
types of stories they’re telling friends about your business.
Gender and Age:
The percentage of
people who talked
about your Page in
the last 7 days for
each age and gender
bracket as of the last
day of your selected
date range. This is
based on the data
people enter in their
profile.
Countries: The number of people who who
talked about your Page in the last 7 days as
of the last day of your selected date range,
broken down by country. This is based on
the user’s IP address.
Languages: The number of people who
talked about your Page in the last 7 days as
of the last day of your selected date range,
broken down by language. This is based on
the user’s default language setting.
Talking About This: The number of
unique people who have created
a story about your Page in the last
7 days, for each day during your
selected date range.
Viral Reach: The number of unique
people who saw a story published
by a friend about your Page in the
last 7 days, for each day during your
selected date range.
You can further refine the data shown in both of these graphs by selecting a
specific type of content from the drop-down menu.
© 2011 Facebook, Inc. All rights reserved. Product specifications subject to change without notice.
14
Page Insights
Focus on engaging your audience
The best way to get your audience to engage with your content and share it with friends is to
understand deeply what the people you’re reaching care about. Page Insights gives you the data you
need to gather these consumer insights.
You should visit Page Insights on a regular basis to track which of your posts resonated with your
audience and generated the most engagement so you can post more of this type of content.
For best practices on how to publish engaging content, please download this guide.
© 2011 Facebook, Inc. All rights reserved. Product specifications subject to change without notice.
15