1
Winter Term – Final Report
MECH 4020
Project:
Human Powered Water Purification System
Design Project Team #15:
Nawaf Alsinani
B00518739
Lukas Domm
B00513852
Alex Heukshorst
B00531734
Mohanad Khairy
B00511394
Design Project Supervisor:
Dr. V. Ismet Ugursal
Design Project Coordinator:
Dr. Ted Hubbard
Dr. Clifton Johnston
Department of Mechanical Engineering
Dalhousie University
Halifax, Nova Scotia
Canada
April 08, 2013
MECH 4020
Team #15
Human Powered Water Purification System
Winter Term – Final Report
Table of Contents
List of Figures ................................................................................................................................................ 4
List of Tables ................................................................................................................................................. 6
Executive Summary....................................................................................................................................... 7
1.
Introduction ........................................................................................................................................ 8
2.
Design requirements .......................................................................................................................... 9
3.
Design Selection Process .................................................................................................................. 10
3.1.
3.3.
4.
Purification Systems Considered .............................................................................................. 10
Designs Considered ................................................................................................................... 13
3.3.1. Design Considered #1: Slow Sand Filtration with Solar Disinfection ................................. 13
3.3.2. Design Considered #2: Ceramic and Reverse Osmosis System .......................................... 14
3.3.3. Design Considered #3: Ceramic, Ultrafiltration, and Reverse Osmosis System ................. 14
3.3.4. Fall Term Selected Design: Microfiltration and Reverse Osmosis System ......................... 15
3.3.5. The Final Design ................................................................................................................. 16
Final Design ....................................................................................................................................... 18
4.1.
4.2.
Frame Design ............................................................................................................................ 18
Drivetrain .................................................................................................................................. 19
4.2.1. Pedal Crank Assembly ........................................................................................................ 22
4.2.2. Intermediate Sprocket Assembly ....................................................................................... 24
4.2.3. Pump Drive Assembly......................................................................................................... 25
4.4.
Hydraulic Circuit ........................................................................................................................ 27
4.4.1. Pump Selection................................................................................................................... 27
4.4.2. Purification System............................................................................................................. 28
5.
Testing .............................................................................................................................................. 37
5.1.
5.2.
5.3.
Objectives.................................................................................................................................. 37
Materials and Equipment.......................................................................................................... 37
Procedures ................................................................................................................................ 37
5.3.1. Flow Rate Testing ............................................................................................................... 38
5.3.2. Human Power Testing ........................................................................................................ 40
5.3.3. Water Quality Testing ........................................................................................................ 40
5.4.
Results ....................................................................................................................................... 44
5.4.1. Flow rate Results ................................................................................................................ 44
5.4.2. Human Power Results ........................................................................................................ 46
5.4.3. Water Quality Results......................................................................................................... 48
Dalhousie Univ.
Dept. of Mechanical Eng.
Page 2 of 102
MECH 4020
Team #15
Human Powered Water Purification System
Winter Term – Final Report
6.
Budget............................................................................................................................................... 51
7.
Implementation ................................................................................................................................ 55
7.1.
7.2.
7.3.
8.
Economic Analysis ..................................................................................................................... 55
Environmental sustainability .................................................................................................... 56
Design comparison.................................................................................................................... 56
Conclusion ........................................................................................................................................ 59
References and Bibliography ...................................................................................................................... 61
Appendix A
Raw Data ............................................................................................................................ 63
Appendix B
Design Calculations ............................................................................................................ 68
Appendix C
Matlab code for process flow simulation........................................................................... 78
Appendix D
Product Specification Sheets .............................................................................................. 80
Appendix E
Supervisor Meeting Minutes .............................................................................................. 85
Appendix F
Assembly/User Manual ...................................................................................................... 90
Appendix G
CAD Drawings ................................................................................................................... 102
Dalhousie Univ.
Dept. of Mechanical Eng.
Page 3 of 102
MECH 4020
Team #15
Human Powered Water Purification System
Winter Term – Final Report
List of Figures
Figure 1
Figure 2
Figure 3
Figure 4
Figure 5
Figure 6
Figure 7
Figure 8
Figure 9
Figure 10
Figure 11
Figure 12
Figure 13
Figure 14
Figure 15
Figure 16
Figure 17
Figure 18
Figure 19
Figure 20
Figure 21
Figure 22
Figure 23
Figure 24
Figure 25
Figure 26
Figure 27
Figure 28
Figure 29
Figure 30
Figure 31
Figure 32
Figure 33
Particle size removal capabilities of different media and membrane filters ......................... 12
Design considered #1 ............................................................................................................. 13
Process flow diagram of design considered #2 ...................................................................... 14
Process flow diagram of design considered #3 ...................................................................... 15
Water purification process flow diagram ............................................................................... 16
Final design of the hydraulic assembly of the Human Powered Water Purification
System .................................................................................................................................... 17
CAD rendering of final design ................................................................................................. 18
Frame components ................................................................................................................ 19
Pedaling power vs. RPM (Wilson, 2004)................................................................................. 20
13.5:1 Sprocket Drivetrain...................................................................................................... 20
Mechanical drivetrain components ....................................................................................... 21
Pedal crank assembly ............................................................................................................. 22
Bearing housing ..................................................................................................................... 22
Intermediate sprocket assembly ............................................................................................ 24
Pump drive assembly ............................................................................................................. 25
Physical layout of the hydraulic circuit................................................................................... 27
Schematic illustrating the hydraulic circuit ............................................................................ 29
Osmosis (PASCO, Web.).......................................................................................................... 31
Spiral wound membrane element (RPI, Web.)....................................................................... 31
Permeate flow rate vs. applied pressure for two Black Max 100 gpd membranes in
parallel. ................................................................................................................................... 33
Permeate flow rate vs. human power for two Black Max 100 gpd membranes in
parallel. ................................................................................................................................... 34
Maximum sustainable human power output. (Wilson, 2004). .............................................. 35
Experimental setup of flow rate testing ................................................................................. 38
System performance testing set-up. Measurement points designated by arrows. .............. 39
Measuring levels of total dissolved solids in laboratory ........................................................ 41
Mixing in the Colilert reagent into the water samples to test for presence of Coliform
and E.coli ................................................................................................................................ 42
The water samples after 24 hours of incubating at 35°C ....................................................... 42
Water sample testing demonstrating presence of E. coli. ..................................................... 43
Water quality testing. 1) Source, 2) After Pre-treatment, 3) RO permeate .......................... 43
Samples prepared for TOC/DOC analysis ............................................................................... 44
Flow rate VS backpressure for various pump speeds ............................................................ 45
Flow rate VS TDS level for pressures of 90 and 100 psi and ~95 rpm pedal speed ............... 45
Flow rate VS driving power for various water qualities and ~95 rpm pedal speed ............... 47
Dalhousie Univ.
Dept. of Mechanical Eng.
Page 4 of 102
MECH 4020
Figure 34
Figure 35
Figure 36
Figure 37
Figure 38
Figure 39
Figure 40
Figure 41
Figure 42
Figure 43
Figure 44
Figure 45
Figure 46
Figure 47
Figure 48
Team #15
Human Powered Water Purification System
Winter Term – Final Report
Human power capability compared to system power requirement. Human power
capability data obtained from (Wilson, 2004)........................................................................ 48
Location of case study ............................................................................................................ 56
The Aquaduct ......................................................................................................................... 57
The Pedal Powered Human Ultrafiltration Unit ..................................................................... 57
Left to right: Main Post, base cross-piece, main frame ......................................................... 93
Main post and base cross-piece ............................................................................................. 94
Assembled frame.................................................................................................................... 94
Shaft/bearing placement (left), Crank pedal assembly (right) ............................................... 95
Full drivetrain (shown without chain) .................................................................................... 96
Hydraulic circuit ...................................................................................................................... 97
Procon pump connection (Down = IN, Up = OUT) ................................................................. 97
Filter mount assembly (Left to right: Sediment, Carbon, Ultra)............................................. 98
Pressure valve (not shown is the PSV) ................................................................................... 98
Left: Reverse osmosis membrane housings ........................................................................... 99
System recovery valve .......................................................................................................... 100
Dalhousie Univ.
Dept. of Mechanical Eng.
Page 5 of 102
MECH 4020
Team #15
Human Powered Water Purification System
Winter Term – Final Report
List of Tables
Table 1
Table 2
Table 3
Table 4
Table 5
Table 6
Table 7
Table 8
Table 9
Table 10
Table 11
Table 12
Table 13
Table 14
Table 15
Table 16
Table 17
Summary of design requirements ............................................................................................ 9
Summary of existing water purification systems ................................................................... 11
Summary of components in pedal crank assembly ................................................................ 23
Summary of components in intermediate sprocket assembly .............................................. 24
Summary of components in pump drive assembly ................................................................ 26
Comparison of membrane configurations ............................................................................. 32
Materials and equipment required for testing ...................................................................... 37
Full 20 minute pedaling test results ...................................................................................... 46
Water quality bacterial test results summary for Banook Lake ............................................. 49
Water quality bacterial test results for Fog Pond .................................................................. 49
Water quality bacterial test results for McIntosh Run ........................................................... 49
Water quality bacterial test results for Frog Pond ................................................................. 50
Summarized budget categorized by major components ....................................................... 51
Detailed budget ...................................................................................................................... 52
Economic analysis summary ................................................................................................... 55
Design comparison of different water purification systems .................................................. 58
Summary of achieved design requirements........................................................................... 59
Dalhousie Univ.
Dept. of Mechanical Eng.
Page 6 of 102
MECH 4020
Team #15
Human Powered Water Purification System
Winter Term – Final Report
Executive Summary
The Human Powered Water Purification System is a mechanical device designed to purify water for
human consumption using human pedal power. The influent water quality that the system is
designed to treat to potable levels may contain Coliform bacteria, E. Coli, total dissolved solids, and
organic compounds.
The design utilizes pedal power to drive the membrane purification process. The primary
component of the purification system is the reverse osmosis membrane that achieves a level of
purification as fine as 0.001 microns.
The Human Powered Water Purification System has been proven to accomplish the initial design
requirements set by Team 15. The system is capable of being powered using human pedal power,
can produce 9.6 L of potable water after 20 minutes of operation, can remove all existing levels of
coliform bacteria and E. Coli from water, can remove ~94% of dissolved solids, weighs ~30 kg and
comes out to enclose a volume of 1 m3. The cost to construct the final prototype was $1110.
Dalhousie Univ.
Dept. of Mechanical Eng.
Page 7 of 102
MECH 4020
1.
Team #15
Human Powered Water Purification System
Winter Term – Final Report
Introduction
The Human Powered Water Purification System is designed to address the difficulty of accessing
clean, safe water in isolated regions such as off-grid residences, camp grounds, summer cottages,
etc. In many cases, these remote residences have limited access to electricity and/or fuel. The
Human Powered Water Purification System is designed to reduce pathogenic contaminants as well
as dissolved salts from source water through the use of a reverse osmosis membrane process. It is
designed to produce 10 litres of drinking water after 20 minutes of operation (0.5 Lpm). The
system is designed to treat brackish water with microbiological contamination.
The purpose of this document is to provide an overview of the design work completed throughout
the course of the project. This report contains information regarding:
1. Design requirements
2. Design selection process
3. Final design
4. Testing Procedures and Results
5. Budget
6. Economic and Environmental Considerations
7. Current project status
8. Design calculations
9. Specification sheets
10. Testing: Raw Data
11. Meeting minutes
12. Engineering drawings
Dalhousie Univ.
Dept. of Mechanical Eng.
Page 8 of 102
MECH 4020
2.
Team #15
Human Powered Water Purification System
Winter Term – Final Report
Design requirements
The design requirements of this project were divided into the following categories: power
requirements, capacity requirements, water quality requirements, physical requirements and cost
requirements. In some of these categories, essential requirements were supplemented with
optional requirements. The design requirements are summarized in Table 1 below:
Table 1
Category
Power
Summary of design requirements
Essential Requirements
Must be human powered
Must be purely mechanical
Capacity
Optional Requirements
Can be powered by only one
person
Must produce a minimum of 0.5 L of
potable water per minute of operation
Water
Quality
Must produce clean, safe drinking water
Can remove dissolved salts
from sources potentially contaminated
with bacteria, viruses and sedimentation
Physical
Must be robust and portable
Must be easy to operate and maintain
Must not exceed 40 kg in mass
Must not exceed 1 m3 in total volume
Cost
Prototype materials and construction
must not exceed $12001
Projected product
fabrication cost in quantity
should not exceed $200
1Cost
requirement revised in January 2013
Dalhousie Univ.
Dept. of Mechanical Eng.
Page 9 of 102
MECH 4020
3.
Team #15
Human Powered Water Purification System
Winter Term – Final Report
Design Selection Process
The team conducted a thorough literature search in the early fall to identify technologies for
purifying water. Aside from being required to remove both pathogenic contaminants and dissolved
salts, the technologies considered were also evaluated based on whether they were able to meet the
design requirements initially established. Ultimately, reverse osmosis was selected as the primary
component to be integrated in the final design for removing both pathogenic contaminants and
dissolved solids.
3.1.
Purification Systems Considered
During the initial stages of the project, the main difficulty was defining the specific water quality
problem to be solved and the available treatment technologies. It was important that a good
understanding of existing water purification methods and systems was established. A
comprehensive literature review was conducted to establish a fundamental understanding of water
purification methods and techniques. A summary of the information that was collected is in Table 2.
Dalhousie Univ.
Dept. of Mechanical Eng.
Page 10 of 102
MECH 4020
Team #15
Human Powered Water Purification System
Table 2
Purification System
Slow Sand Filtration
Summary of existing water purification systems
Advantages
Removes microbial
contaminants. Typical coliform
removals are in the range of 90 –
99% (Lingireddy, 2002).
Microfiltration
Ultrafiltration
Reverse Osmosis
(RO) Membranes
Vacuum Boiling
Ceramic
Filtration
Used to remove particles 0.05 –
5 microns in diameter
(Lingireddy, 2002).
Effective as a pre-filtration stage
for Ultrafiltration or Reverse
Osmosis.
Used typically for particle
removal (removal of bacteria
and viruses).
Ultrafiltration membranes
typically require a pressure
differential of 7 to 105 psi;
however, the ‘loose’ membranes
require only 10 to 30 psi
(Lingireddy, 2002).
Used to remove all
contaminants from water,
yielding a permeate free from
dissolved salts, ions, and
particles (bacteria and viruses)
(Lingireddy, 2002).
Reduces the boiling point of
water in order to distill at lower
temperatures.
Bacteria, protozoa and microbial
cysts are removed (Brown,
2011).
Dalhousie Univ.
Dept. of Mechanical Eng.
Has been shown to deactivate
pathogenic organisms
(Wikipedia, Web.).
Relatively cheap and uses
readily available materials such
as type 1 plastic.
Disadvantages
Relatively large surface area
required to produce sufficient
filtration rates.
As flow rate increases the
amount of coliform removal
decreases.
Not effective for removing
dissolved ions from water.
Not effective for removing
dissolved ions or viruses from
water.
Not effective for removing
dissolved ions from water.
Requires a high operating
pressure (pressures ranging
from 150 to 1500 psi depending
on system performance and
dissolved salt concentration)
(Lingireddy, 2002).
Energy intensive process.
Not all the contaminants in the
water are separated from the
vapor.
Viruses are generally small
enough to pass through the
filter.
Must be replaced periodically.
Brittle in nature – hairline
cracks form in the filter allowing
contaminants to pass through
(Brown, 2011).
Solar disinfection depends on
amount of sunlight and time.
Effective for clear water only
(turbidity blocks UV rays).
Solar Disinfection
Winter Term – Final Report
Page 11 of 102
MECH 4020
Team #15
Human Powered Water Purification System
Purification System
Activated Carbon
Filtration
Chemical Treatments
(Chlorination)
Advantages
Removes chlorine, odours,
objectionable tastes, dirt, rust,
and sand from influent water
(Fiore, 1977).
Satisfactory for treating fresh
water with pathogenic
contaminants (Agardy, 2009).
Ensures the deactivation of
bacteria and viruses.
Provides a residual effect in the
treated water which prevents
growth of bacteria.
Winter Term – Final Report
Disadvantages
Buildup of organic material and
concentration of bacteria
combine to foster growth and
shedding of bacteria into the
water (Tobin, 1981).
Taste, health risks, and public
acceptance of chlorinated water
in some small communities
challenge the use of this
treatment method.
Increases the corrosion of
certain metals in the pipe
system.
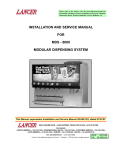
Furthermore, a comparison of the particle sizes that can be removed by different types of media
and membrane filtration is shown in Figure 1.
Figure 1
Particle size removal capabilities of different media and membrane filters
Dalhousie Univ.
Dept. of Mechanical Eng.
Page 12 of 102
MECH 4020
3.3.
Team #15
Human Powered Water Purification System
Winter Term – Final Report
Designs Considered
After researching the different types of water filtration and purification methods currently existing,
a set of designs were considered for purifying water of different quality.
3.3.1.
Design Considered #1: Slow Sand Filtration with Solar Disinfection
Feed Water Quality:
Low turbidity, fresh water with pathogenic contaminants.
Primary Application:
Rural communities, developing nations,
areas with limited access to resources
Description:
This first design that was considered
was developed around the concepts of
sustainability and simplicity. It is a
design that uses slow sand filtration and
solar disinfection as the main two
components of water purification. The
influent contaminated water is poured
into an intake container that provides a
gravity feed into the system. The
Figure 2
Design considered #1
contaminated water flows through a
perforated plate that disperses the water across the top layer of the sand filter. This provides a
uniform distribution of the flow and increases the effective surface area of the slow sand filter. A
sketch of the design is shown in Figure 2.
The contaminated water flows through a layer of large grain sand, a permeable sheet, small grain
sand, and finally a gravel bed. The first layer provides filtration of suspended solids in the water.
The second layer, the permeable sheet, provides a surface for the microbiologically active sand
layer to form. This layer produces a bio-slime that is composed of microorganisms that kill and
strain out influent streams containing pathogens. The third layer containing the fine sand removes
any smaller sized particles that were not filtered out in the initial stage of the system. The effluent
water is then collected in a series of containers made of type 1 plastic that allows sunlight to further
disinfect the water.
Dalhousie Univ.
Dept. of Mechanical Eng.
Page 13 of 102
MECH 4020
Team #15
Human Powered Water Purification System
Winter Term – Final Report
This design was not selected because it did not fit the design requirement scope of the project. The
group felt that this particular deign was too simple and was not challenging enough to meet the
requirements of the senior year design project.
3.3.2.
Design Considered #2: Ceramic and Reverse Osmosis System
Feed Water Quality:
High turbidity, brackish water with pathogenic contaminants.
Primary Application:
Specifically for remote communities with limited access to modern resources.
Description:
The system utilizes coagulation, ceramic filtration, and a RO membrane to purify the source water.
Coagulation would remove sedimentation and decrease the turbidity for the downstream treatment
stages. Ceramic filtration is used to remove small particles that could foul the reverse osmosis
membrane (such as bacteria). Viruses and ionic compounds are filtered out in the final stage
through the RO membrane. The process flow diagram is shown in Figure 3.
Figure 3
Process flow diagram of design considered #2
This design was not selected because of two main reasons:
1. The coagulation process in the pre-treatment stage of the system was decided to be
unnecessary for the chosen scope of the project.
2. Ceramic filters are subject to stress fracture at the high pressures required by the reverse
osmosis membrane.
3.3.3.
Design Considered #3: Ceramic, Ultrafiltration, and Reverse Osmosis System
Feed Water Quality:
High turbidity, brackish water with pathogenic contaminants.
Dalhousie Univ.
Dept. of Mechanical Eng.
Page 14 of 102
MECH 4020
Team #15
Human Powered Water Purification System
Winter Term – Final Report
Primary Application:
Specifically for remote communities with limited access to modern resources.
Description:
This system is identical to the 2nd design that was considered with the addition of an ultrafiltration
membrane. This design is composed of a pre-treatment stage, and a 3 stage purification process.
The increased number of stages in this particular order is expected to increase the lifetime of the
reverse osmosis membrane. The upstream stages of filtration act as pre-filters to remove all
contaminants except for dissolved ions. The process flow diagram is shown in Figure 4.
Figure 4
Process flow diagram of design considered #3
This design was not selected because of the added cost associated with the increased number of
filters in the process. The benefit of increasing the lifetime of the RO membrane is not expected to
outweigh the initial cost of the system (low payback).
3.3.4.
Fall Term Selected Design: Microfiltration and Reverse Osmosis System
Feed Water Quality:
Low turbidity, brackish water with pathogenic contaminants.
Primary Application:
Specifically for remote communities with limited access to modern resources.
Description:
The design that was selected at the end of the fall semester consisted of a system that would be able
to purify brackish water with micro-bacterial contamination. It consisted of a mechanically driven
shaft that powers a positive displacement pump. The system utilized a microfiltration membrane in
series with a reverse osmosis membrane. The microfiltration membrane was selected to serve as
the filter for pre-treatment in order to mitigate fouling of the RO membrane. It was expected to
remove some of the particle and microbial contamination with sizes as small as 0.2 microns. The
Dalhousie Univ.
Dept. of Mechanical Eng.
Page 15 of 102
MECH 4020
Team #15
Human Powered Water Purification System
Winter Term – Final Report
reverse osmosis filter achieves filtration of dissolved ions at a rejection rate of ~98% (AMI
Membrane Inc., Web.). A process flow diagram is shown in Figure 5.
Figure 5
Water purification process flow diagram
This design was initially chosen because of it’s ability to remove pathogenic contaminants and
dissolved salts, because of it’s relative simplicity compared with a three stage membrane process,
and because of the suitability of a microfiltration membrane for RO pretreatment (Buckley and
Jacangelo, 1996).
3.3.5.
The Final Design
Feed Water Quality:
Low turbidity, brackish water with pathogenic contaminants.
Primary Application:
Specifically for remote residences without city water supply and electricity
Description:
In the winter semester the team approached an obstacle with regards to the availability of the
specific membranes specified in the fall term design selected (shown in Figure 5). After ordering
the materials, the suppliers contacted the university to inform them of additional freight charges of
$120. Since costs were required to be cut down anyway at that stage of the project, there was no
possibility that the additional charges could be accepted. As a result, the shipping order was
cancelled and a search for new suppliers was initiated. No local suppliers could supply the same
type of membranes that were initially specified. As a result, the purification system had to be
redesigned using components that were available from local distributors that were guaranteed to
be available. Two smaller reverse osmosis membranes were selected in addition to a 5 micron
sediment filter, an activated carbon filter, and a 0.35 micron Ultra filter to accomplish what was
Dalhousie Univ.
Dept. of Mechanical Eng.
Page 16 of 102
MECH 4020
Team #15
Human Powered Water Purification System
Winter Term – Final Report
initially intended by the selected fall semester design. A schematic of the final design that was
assembled is displayed in Figure 6 below.
Figure 6
Final design of the hydraulic assembly of the Human Powered Water Purification System
Specific details concerning the final design illustrated in Figure 6 are thoroughly discussed in the
proceeding section of this report.
Dalhousie Univ.
Dept. of Mechanical Eng.
Page 17 of 102
MECH 4020
4.
Team #15
Human Powered Water Purification System
Winter Term – Final Report
Final Design
A CAD rendering of the final design of the human powered water purification system is shown in
Figure 7.
Figure 7
CAD rendering of final design
The following sections will discuss the components of the final design categorized into 3 main
categories:
1. The frame
2. The drivetrain
3. The hydraulic circuit
4.1.
Frame Design
The frame for this design was designed to be simple and robust. This particular design uses
aluminum box tubing because it is easily attainable and easy to weld and machine. Aluminum is
more expensive than steel, but has a higher strength to weight ratio, allowing the frame to be made
lighter for transportation.
Dalhousie Univ.
Dept. of Mechanical Eng.
Page 18 of 102
MECH 4020
Team #15
Human Powered Water Purification System
Winter Term – Final Report
The basic dimensions were determined by researching bicycle geometries for ergonomic pedalling
in the sitting position. The seat post angle is designed to be 72° from the vertical. This angle was
chosen after researching that typical seat post angles are between 70 and 74 degrees (HanakiMartin, 2012). The final dimensions of the frame are 36” x 40.5” x 41.5” (including the hydraulic
components). The current design allows the seat to be adjusted approximately one foot to
accommodate people of various heights. The structural members of the frame can accommodate up
to 250 lbm.
One important consideration for the design of the frame was that the assembly must be compact for
easy shipment. To integrate this concept into the design, the frame was designed in three separate
welded components that are bolted together by the user. These three components can be taken
apart and stacked flat for compactness as displayed in Figure 8.
Figure 8
4.2.
Frame components
Drivetrain
The final drivetrain design consists of a two stage, 13.5:1 sprocket system used to increase the
rotational speed of pedaling to the pump shaft. During the literature search, the team found that a
human can produce the most power at around 90 RPM. This is demonstrated in Figure 9 below in
which human power output is plotted vs. pedalling speed for one individual.
Dalhousie Univ.
Dept. of Mechanical Eng.
Page 19 of 102
MECH 4020
Team #15
Human Powered Water Purification System
Winter Term – Final Report
Power VS RPM
200
180
Power, W
160
140
120
100
80
60
40
40
60
80
100
120
140
Pedal RPM
Figure 9
Pedaling power vs. RPM (Wilson, 2004).
The sprocket gearing was chosen to increase the pedaling speed to approximately 1200 RPM (The
choice of 1200 RPM will be discussed in the pump selection section). In the first stage, a 45 tooth
sprocket at the pedal crank is coupled to a 20 tooth sprocket at an intermediate shaft. A 60 tooth
sprocket on the intermediate shaft is coupled to a 10 tooth sprocket on the pump shaft. The
drivetrain is detailed in Figure 10.
Figure 10
Dalhousie Univ.
Dept. of Mechanical Eng.
13.5:1 Sprocket Drivetrain
Page 20 of 102
MECH 4020
Team #15
Human Powered Water Purification System
Winter Term – Final Report
The individual components of the drivetrain are shown in Figure 11.
Pedal Crank Assembly
Intermediate Sprocket
Assembly
Pump Drive Assembly
Figure 11
Dalhousie Univ.
Dept. of Mechanical Eng.
Mechanical drivetrain components
Page 21 of 102
MECH 4020
4.2.1.
Team #15
Human Powered Water Purification System
Pedal Crank Assembly
45 tooth sprocket
Winter Term – Final Report
Socket head screw
Bearing Housing
Pedal
Pedal crank
Crank shaft
Figure 12
Pedal crank assembly
Interior snap ring
Bearing housing
(welded to frame)
Exterior snap ring
Figure 13
Bearing housing
The pedal crank assembly (displayed in Figure 12) is the power transducer between the driver and
the pump. It is designed for simple fabrication and assembly using standard sized materials. A
bearing/shaft housing fabricated from a length of aluminum pipe is welded to the frame. Ball
bearings are held in place in the pipe using snap rings as seen in Figure 13. The exterior snap rings
constrain the shaft while the interior snap rings constrain the bearings within the bearing housing.
The reason the bearing housing was designed in this manner was mainly because of ease of
manufacturing.
Dalhousie Univ.
Dept. of Mechanical Eng.
Page 22 of 102
MECH 4020
Team #15
Human Powered Water Purification System
Winter Term – Final Report
The team considered purchasing a pre-fabricated bicycle bearing hub and sprocket; however, the
chosen design was selected based on ease of interfacing with the bicycle frame and cost of
components. Considering production in quantity, this design is expected to be more cost effective
than purchasing custom bicycle components. Also, should the team find it necessary to test
different gear ratios, the sprocket can easily be removed and inter-changed. Stress calculations
were performed on the shaft, key, crank, and bearings to ensure that they were capable of operating
within the allowable limits of the mechanical system. The calculations for the components were
based on an applied torque corresponding to 150 Watts of power and 90 rpm pedal speed. The
calculations are in Appendix B. A summary of the main mechanical components in the pedal crank
assembly with their selected sizes is in Table 3.
Table 3
Component
Summary of components in pedal crank assembly
Quantity
Size
Steel shaft
1
5/8” dia.
Pedal crank
2
8”x0.5”x1.5”
45 tooth sprocket
1
Sprocket for #35 Chain, 3/8" Pitch, 45 Teeth, 5/8" Bore
Bearing Housing
1
1 ¼” SCH 80
Interior Snap Rings
2
1 3/8” bore diameter
Exterior Snap Rings
2
5/8” shaft diameter
Ball Bearings
2
5/8” shaft diameter
Socket Head
2
¼”-20 x 1.5”
Steel Flat bar
2
6” x 0.5” x 1.5”
Dalhousie Univ.
Dept. of Mechanical Eng.
Page 23 of 102
MECH 4020
4.2.2.
Team #15
Human Powered Water Purification System
Winter Term – Final Report
Intermediate Sprocket Assembly
60 tooth sprocket
Bearing Housing
20 tooth sprocket
Figure 14
Intermediate sprocket assembly
Based on a maximum recommended single stage reduction of 7:1 (Renold Jeffrey, Web.), two stages
were required to produce the 13.5:1 gear ratio. The bearing housing shown in Figure 14 is an
identical assembly of parts as the one shown in Figure 13.
A summary of the main mechanical components of the intermediate sprocket assembly with their
selected sizes is in Table 4.
Table 4
Summary of components in intermediate sprocket assembly
Component
Quantity
Size
Steel shaft
1
5/8” dia.
60 tooth sprocket
1
20 tooth sprocket
1
Bearing Housing
1
1 ¼” SCH 80
Interior Snap Rings
2
1 3/8” bore diameter
Exterior Snap Rings
2
5/8” shaft diameter
Ball Bearings
2
5/8” shaft diameter
Dalhousie Univ.
Dept. of Mechanical Eng.
Sprocket for #35 Chain, 3/8"
Pitch, 60 Teeth, 5/8" Bore
Sprocket for #35 Chain, 3/8"
Pitch, 20 Teeth, 5/8" Bore
Page 24 of 102
MECH 4020
4.2.3.
Team #15
Human Powered Water Purification System
Winter Term – Final Report
Pump Drive Assembly
The pump drive assembly is composed of machine parts that transmit the power from the drive
train to power the pump. The chain size was selected to be an ANSI/ISO #35 chain size. This chain
size was selected based on the rated load according to one supplier (McMaster-Carr, Web.). A view
of the general assembly is shown in Figure 15.
Pump
Flexible coupling
Angle Bar
Bearing Housing
10 tooth sprocket
Figure 15
Shaft
Pump drive assembly
The bearing housing shown in Figure 15 is an identical assembly of parts as the one shown in
Figure 13. The steel shaft was originally sized to match the bore size of the bearings, sprocket, and
flexible coupling that could all be purchased. Stress calculations were performed on the shaft, shaft
key, and bearings to ensure that the stresses induced in the system were well below the allowable
limits of these components. Supporting calculations may found in Appendix B. A summary of the
main mechanical components with their selected sizes is in Table 5.
Dalhousie Univ.
Dept. of Mechanical Eng.
Page 25 of 102
MECH 4020
Team #15
Human Powered Water Purification System
Table 5
Winter Term – Final Report
Summary of components in pump drive assembly
Component
Quantity
Size
Steel shaft
1
5/8” dia.
10 tooth sprocket
1
Bearing Housing
1
1 ¼” SCH 80
Interior Snap Rings
2
1 3/8” bore diameter
Exterior Snap Rings
2
5/8” shaft diameter
Ball Bearings
2
5/8” shaft diameter
Flexible Coupling
1
7/16” and 5/8” coupling hubs
Angle bar
1
4”x4”x¼”
Pump
1
70 gph1
1 Pump
Sprocket for #35 Chain, 3/8"
Pitch, 10 Teeth, 5/8" Bore
specification sheet attached in Appendix D
Dalhousie Univ.
Dept. of Mechanical Eng.
Page 26 of 102
MECH 4020
4.4.
Team #15
Human Powered Water Purification System
Winter Term – Final Report
Hydraulic Circuit
The physical layout of the hydraulic circuit is shown in Figure 16 below.
5 micron sediment filter
Activated carbon filter
0.35 micron Ultra filter
Reverse osmosis membranes
70 gph rotary vane pump
Figure 16
4.4.1.
Physical layout of the hydraulic circuit
Pump Selection
A Fluid-o-Tech rotary vane pump designed for water treatment applications was chosen to supply a
consistent, well-defined flow rate. The rotary vane pump is a positive displacement pump, meaning
that its output flow rate is approximately proportional to its rotational speed. This characteristic
made it possible to easily predict and control the output flow rate of the purification system. The
pump was sized with considerations for both the required flow rate of the system and the
practicality of different sprocket reduction ratios used to drive the pump. The pump was sized to
produce flow at 3.3 Lpm in order to meet system requirements. The 3.3 Lpm flow rate requirement
is based on the ratio of water penetrating the reverse osmosis membrane to the water that flushes
through the membrane and is recirculated (the flow characteristics will be described in greater
detail in the following subsections). The system was designed so that this ratio (the recovery rate)
would be 15% as specified by the membrane manufacturer. Since 0.5 Lpm of clean water
production (permeate) was set in our design requirements, a total flow rate of 3.3 Lpm was needed.
Dalhousie Univ.
Dept. of Mechanical Eng.
Page 27 of 102
MECH 4020
Team #15
Human Powered Water Purification System
Winter Term – Final Report
The Fluid-o-Tech pump is manufactured as a replacement for a near identical product
manufactured by Procon Pumps. In Procon’s literature, the minimum pump rotation speed for the
similar pump was specified as 800 RPM. The drivetrain was chosen to drive the pump at about
1200 RPM at normal pedaling speeds in order to stay well above the 800 RPM lower limit without
going so fast as to cause increased inefficiency in the drivetrain associated with friction caused by
driving the pump shaft at high speeds.
A Fluid-o-Tech rotary vane pump rated at 70 gph (4.4 Lpm) at 1750 RPM was selected in order to
provide the required flow rate at the design pump shaft speed of 1200 RPM. The specification sheet
for this pump can be found in Appendix D. Since for a rotary vane pump the flow rate is
proportional to the speed, the actual output of the pump at design conditions is:
(
)
The 3 Lpm is slightly below the desired 3.3 Lpm. The original design specified an 80 gph pump to
provide the desired flow rate, however, the team was unable to procure an 80 gph pump and
purchased the next best available pump. In the future, the team could adjust the sprocket system to
achieve the specified 3.3 Lpm. For the purposes of this project, the desired permeate flow rate was
achieved by adjusting the recovery rate of the system (increasing it above 15%).
4.4.2.
Purification System
The final design selected for the purification system is a reverse osmosis membrane filtration
process. Contaminated water is pumped from a holding tank, and is conditioned before entering the
reverse osmosis membranes using a pre-treatment stage consisting of three cartridge filters. As the
water enters the reverse osmosis membranes, system backpressure forces about 15% of the
entering water through the membrane. The remaining 85% of the water that enters the reverse
osmosis membranes flushes over the surface of the membrane and is circulated back through a
control valve to the contaminated holding tank. The recovery rate of the system is defined as the
ratio of water that passes through the membranes (the permeate) to the water that enters the
membrane. The water flushing over the membrane is the ‘concentrate’. Normal operation of the
membranes requires that the recovery rate be kept near 15%, because the concentrate stream is
required to continuously flush contaminants away from the membrane. The complete purification
system is detailed in Figure 17.
Dalhousie Univ.
Dept. of Mechanical Eng.
Page 28 of 102
MECH 4020
Team #15
Human Powered Water Purification System
Figure 17
Winter Term – Final Report
Schematic illustrating the hydraulic circuit
The purification system includes an adjustable pressure relief valve in order to limit the system
pressure to a set value. The system components are sized to handle a maximum system pressure of
125 psi. Without the use of a relief valve, a user could produce a large pressure spike by jumping on
a pedal and damage the system. The relief valve mitigates this danger.
The bypass line allows a user to produce significantly more flow rate at a lower system pressure if
the use of the reverse osmosis membranes is deemed unnecessary. This could be the case, for
example, if a user wanted to produce water for bathing or cleaning that did not require rigorous
bacteria and dissolved solids removal. The bypass line also enabled the team to sample the water
after the pre-treatment stage in order to evaluate its effectiveness.
The following subsections will describe each section of the process in detail, and will outline the
selection and sizing of equipment.
4.4.2.1.
Pre-treatment Filtration
Because of the fine pore size and material composition of the reverse osmosis membranes, the feed
water must be pre-treated in order to remove particles and chemicals that could foul or damage the
membranes. The pre-treatment process consists of a 5
carbon filter, and a 0.35
The 5
pore size sediment filter, an activated
ultra filter.
filter is used to remove larger particles of sedimentation. It is a standard size cartridge
filter, and requires replacing approximately once every six months, or as often as needed depending
on the quality of the source water.
The activated carbon filter was a later addition to the design. The activated carbon medium within
the filter is derived from coconut shell, anthracite or some other organic material (Dickenson,
Dalhousie Univ.
Dept. of Mechanical Eng.
Page 29 of 102
MECH 4020
Team #15
Human Powered Water Purification System
Winter Term – Final Report
1997) and is used to remove chlorine and other chemicals by a combination of catalytic reactions
and adsorption to the carbon. The reverse osmosis membranes chosen for this design require that
the chlorine content of the feed water be below 0.1 ppm. Since the team had planned to use tap
water for most of the system performance testing, the activated carbon filter was required to
reduce the chlorine content of the water. In the Halifax Regional Municipality, the chlorine content
of the city water is kept between 0.2 and 1.1 ppm (HRWC, Web.). The activated carbon filter has the
added benefit of removing colour, tastes and odours caused by organic contaminants (Dickenson,
1997). Like the 5
filter, the activated carbon filter must be replaced as often as it becomes
clogged.
The 0.35
‘ultra-filter’ is used as a final treatment before the reverse osmosis to remove even
finer particles that could damage the reverse osmosis membranes. During testing, the team found
that on occasion the ultra-filter removed E.coli from the source water.
Each of the filters used for pre-treatment are dead-end type filters. Since the system as designed
has no backwashing capabilities, all the contaminants that enter the filters will be retained within
the filters until the increase in pressure required to force water through the filters becomes so great
that replacement is necessary.
Initially, the team had expected that the total pre-treatment stage would have a pressure drop on
the order of 5 to 10 psi. However, during testing, the pressure drop was found to be negligible.
Using the analogue pressure gauges the team purchased from McMaster-Carr, there was no
measurable pressure drop across the pre-treatment stage for the normal range of flow rates seen
by the system.
Once the contaminated source water has been conditioned, it can be fed to the reverse osmosis
membranes for total bacteria removal and total dissolved solids reduction.
4.4.2.2.
Reverse Osmosis Membranes
Osmosis refers to the natural passage of water through a semi-permeable membrane separating
two liquids of different salt concentration (Dickenson, 1997). The system wants to find equilibrium
where the salt concentration is the same on either side of the membrane. The passage of water from
the low concentration to the high through the membrane creates a pressure differential, known as
the osmotic pressure. The osmotic pressure differential is often illustrated using a U-tube
configuration as shown in the following figure.
Dalhousie Univ.
Dept. of Mechanical Eng.
Page 30 of 102
MECH 4020
Team #15
Human Powered Water Purification System
Figure 18
Winter Term – Final Report
Osmosis (PASCO, Web.)
Reverse osmosis occurs when a pressure is applied to the solution of higher concentration, causing
the process to reverse and the water to flow from the higher concentration side of the membrane to
the lower. The pressure required to move water through the membrane is a function of the
characteristics of the membrane as well as the salt concentration of the water.
Most commercially available reverse osmosis membranes are either spiral wound or hollow fine
fibre type. For small scale applications, the team was only able to identify spiral wound membranes.
A spiral wound membrane is illustrated in the following figure.
Figure 19
Spiral wound membrane element (RPI, Web.)
The reverse osmosis membranes used in the Human Powered Water Purification System were
selected to provide the required flow rate of 0.5 Lpm. A significant portion of the project was spent
selecting, sourcing, and evaluating the characteristics of the reverse osmosis membranes.
The pressure drop across an RO membrane is a complex relation between flow rate, recovery rate,
salt concentration, and water temperature. Using the rated operating conditions of a membrane
given by the manufacturer (AMI, Web.), the pressure drop can be estimated using the following
equation (AMI, Web).
(
Dalhousie Univ.
Dept. of Mechanical Eng.
)
Page 31 of 102
MECH 4020
Team #15
Human Powered Water Purification System
Winter Term – Final Report
Where P is the trans-membrane pressure in psi required to produce permeate flow rate Qp,
is
the osmotic pressure across the membrane in psi, and CT is a temperature correction factor. The
osmotic pressure is a function of the concentration of salt in the feed water and the permeate water.
According to AMI Membranes, a manufacturer of reverse osmosis membranes, the osmotic
pressure can be estimated using the following rule of thumb:
Where
is the osmotic pressure differential in psi and
is the total dissolved solids
concentration of the feed water in parts per million (ppm). A more accurate calculation can be
performed by taking into account the salt concentration of the product water (Kucera, 2010);
however, because of the high salt rejection rate of the membranes (98% salt rejection specified for
the Black Max membrane) the effect on osmotic pressure is neglected.
In the fall term, the team presented a comparison of different reverse osmosis membranes in order
to choose the best piece of equipment based on the system flow requirements and cost. The
comparison resulted in a choice of a 2.5x21” Low Energy Brackish water membrane as the best
option. However, in the winter term, the team had difficulty sourcing this membrane. The team
ultimately chose to use two Black Max Residential Thin Film Composite reverse osmosis
membranes rated for 100 gpd (0.26 Lpm) of permeate flow rate at a system pressure of 65 psi for
500 ppm feed water. The specification sheet for this membrane can be found in Appendix D.
The use of two 1.8x12” Black Max RO membranes in parallel over a single 2.5x21” LE brackish
water membrane may be validated by looking at the system flow and cost requirements for each.
The results of the calculation are shown in the table below. The calculation assumes that the pump
efficiency is 35%, and that the drivetrain efficiency is 85%.
Table 6
Comparison of membrane configurations
Membrane
Selection/Configuration
Required Pressure, psi
Required Power, W
Total Cost
2.5x21” LE Brackish
-single element
75
90
$230
1.8x12” Residential RO
– 2 elements in parallel
76
92
$180
1Total
cost includes all required membranes and housings.
on 0.5 Lpm of total permeate flow rate for water with 2000 ppm TDS at 25
2Based
Dalhousie Univ.
Dept. of Mechanical Eng.
Page 32 of 102
MECH 4020
Team #15
Human Powered Water Purification System
Winter Term – Final Report
As can be seen in the comparison shown in Table 6, the use of two small membranes in parallel is
comparable to the use of a single medium sized element in terms of the system pressure and power
requirements to produce the desired 0.5 Lpm of permeate. However, the use of two small elements
offers a significant cost saving over the use of the single medium sized element.
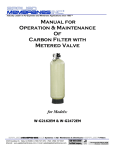
Use of the Black Max 100 gpd membranes was validated by calculating the flow characteristics over
a range of operating conditions. The simulation predicts the permeate flow rate that would be
produced for various system backpressures (controlled by the recovery rate valve) and various
human power inputs. In Figure 20, two Black Max membranes are simulated in parallel such that
the flow through each membrane is assumed to be the same. For the power input calculation, the
user is assumed to be pedaling at a constant 90 RPM. The results of the simulation are shown in
Figures 20 and 21 below.
Figure 20
Permeate flow rate vs. applied pressure for two Black Max 100 gpd membranes in
parallel.
Dalhousie Univ.
Dept. of Mechanical Eng.
Page 33 of 102
MECH 4020
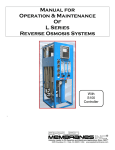
Figure 21
Team #15
Human Powered Water Purification System
Winter Term – Final Report
Permeate flow rate vs. human power for two Black Max 100 gpd membranes in parallel.
In order to calculate the human power requirement, the efficiency of the rotary vane pump was
taken into account. Although Fluid-o-Tech does not cite pump efficiencies, the team found
documentation citing pump brake horsepower for a near identical Procon pump. The efficiency of
the pump was found to be in the range of 35%. Also, the efficiency of the sprocket drivetrain was
assumed to be 85%.
Note in the graphs that as the salt concentration of the feed water increases, the pressure and
power requirements also increase. Based on the simulation, the membranes are expected to
produce the 0.5 Lpm of flow desired to meet the design requirements. The 0.5 Lpm is also
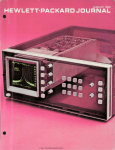
achievable within human power capabilities. In order to understand how much power a human can
produce, the team examined a study on the maximum power a healthy adult can produce over a
period of time. The results of the study are summarized in the following figure.
Dalhousie Univ.
Dept. of Mechanical Eng.
Page 34 of 102
MECH 4020
Team #15
Human Powered Water Purification System
Winter Term – Final Report
Maximum Sustainable Human Power Output for a Healthy
Adult
600
Power, W
500
400
300
200
100
0
0
Figure 22
10
20
30
Duration, min
40
50
Maximum sustainable human power output. (Wilson, 2004).
Comparing the study to the system simulations, the average power requirement for the purification
system using the two Black Max membranes falls well below the maximum sustainable power
output for a human over 10 minutes of pedaling.
Altogether, the purification system was designed to remove biological contamination and total
dissolved solids. However, two important points must be noted. Careful examination of the
specification sheet for the reverse osmosis membranes indicates that the membranes are designed
for a maximum feedwater concentration of 2000 ppm total dissolved solids, but the team wanted to
test the system up to around 4500 ppm. After consultation with the staff at EMS Water Systems, the
team determined that the primary reason for the limitation of 2000 ppm was that for greater
concentrations, dissolved solids could deposit on the membrane surface and cause it to foul. The
team found that there were commercially available membranes similar in size and capacity to the
chosen Black Max membranes but made with different material that could withstand greater
concentrations of dissolved solids, but that these membranes would have to be shipped from
farther away and would add significant shipping costs and downtime to the project. For the
purposes of this project, the team used the Black Max membranes beyond their recommended
operating limits of dissolved solids. The staff at EMS indicated that fouling effects would likely not
occur during the short period of time the team required the membranes for the testing phase of the
project. Future iterations of the design would replace the Black Max membranes with membranes
specifically designed for brackish water applications. It is not expected that this change would
Dalhousie Univ.
Dept. of Mechanical Eng.
Page 35 of 102
MECH 4020
Team #15
Human Powered Water Purification System
Winter Term – Final Report
greatly affect the performance of the system, but would significantly increase the system’s longevity
and durability.
Another important point is that the Black Max membrane specification recommends that the
membranes be used with feedwater that has no microbiological activity. The team expects that the
primary cause for this concern is that as bacteria become trapped within the membrane it can grow
and cause bacterial fouling. Some reverse osmosis literature suggests that membranes be shocked
with a biocide at certain intervals in order to destroy bacterial growth in the system. This biocide
could simply be chlorine, although there are other commercially available options (Kucera, 2010).
During testing, the team encountered no difficulties due to bacterial fouling (though testing was
only performed over a period of a few weeks), and proved reliably that the system was completely
removing all traces of bacterial contaminants.
The following section of this report will outline the testing done to characterize the system
performance and prove that the system can meet the design requirements.
Dalhousie Univ.
Dept. of Mechanical Eng.
Page 36 of 102
MECH 4020
5.
Team #15
Human Powered Water Purification System
Winter Term – Final Report
Testing
5.1.
Objectives
There were 3 main objectives associated with testing:
1. To measure the output flow rate of permeate for varying influent water qualities, recovery
rates, and pedaling speeds
2. To verify that the power requirements of the system can be achieved using human power
3. To demonstrate the effectiveness of the system to purify water
5.2.
Materials and Equipment
Table 7 below summarizes the list of materials and equipment that were utilized throughout the
testing sessions:
Table 7
Quantity
1
2
1
2
3
1
1
1
12
9
-
5.3.
Materials and equipment required for testing
Equipment
Tachometer
Digital multi-meter
Digital thermometer
Digital scale
18.5 L water jug
Stop watch
¼ HP, 90 Volts, 3.0 Amp DC Motor
Motor speed controller
500mL Nalgene bottles
500mL sterile glass bottles
TDS probe and measurement setup
Colilert water test setup
Total Organic Compounds/Dissolved
Organic Compounds water test setup
Procedures
The equipment listed in Table 7 was used to measure system parameters required to characterize
the system performance and demonstrate its effectiveness at meeting the design requirements. For
all water quality testing, the team was given access to the equipment at the Centre for Water
Resources Studies’ water quality lab. The staff at the lab helped the team to set up the various tests
required to validate the effectiveness of the purification system. The following subsections 5.3.1,
5.3.2, and 5.3.3 summarize the testing procedures corresponding to the different tests performed.
Dalhousie Univ.
Dept. of Mechanical Eng.
Page 37 of 102
MECH 4020
5.3.1.
Team #15
Human Powered Water Purification System
Winter Term – Final Report
Flow Rate Testing
The design requirement of producing 10 L of clean water in 20 minutes of pedaling required that
the system produce at least 0.5 Litres per minute of permeate. To determine whether the system
was capable of producing this flow rate, it was tested using the set-up shown in Figure 23 below:
Figure 23
Experimental setup of flow rate testing
Flow rate was measured while varying specific operating parameters. The parameters that were
varied included:
1. Motor speed (varied RPM: 1010 rpm, 1130 rpm, 1260 rpm, and 1390 pm)
2. System Pressure (varied from 70 psi – 110 psi in increments of 10 psi)
Dalhousie Univ.
Dept. of Mechanical Eng.
Page 38 of 102
MECH 4020
Team #15
Human Powered Water Purification System
Winter Term – Final Report
3. TDS level of water (varied concentration from 100 ppm, 1500 ppm, 3000 ppm, and 4500
ppm)
The motor speed was varied using the variable speed box. A tachometer was used to measure the
rpm of the shaft driving the pump. Two multi-meters measured voltage and amperage being drawn
by the motor. The recovery rate valve was manually adjusted to modify the system back pressure
which was read by the analog pressure gages. The accumulated mass of concentrate and permeate
water exiting the reverse osmosis membranes were measured separately by two digital scales.
Using a stop watch, the flow rate was calculated based on the difference in mass measured over a
measured time interval.
The test set-up detailing the specific measurements is shown in the schematic in Figure 24 below.
Figure 24
System performance testing set-up. Measurement points designated by arrows.
For the system flow rate tests, the voltage and current drawn by the motor were measured in order
to quantify the power consumption of the system under different operating conditions. The power
measurements will be discussed in further detail in the following subsection.
For the different tests, a sample of the influent water quality and permeate was collected in the 250
ml Nalgene bottles. These bottles were then taken to the Water Center for Resources Studies to be
measured for total dissolved solids. To achieve the different levels of total dissolved solids, table
salt was added manually to the jug of water that was feeding the system.
Dalhousie Univ.
Dept. of Mechanical Eng.
Page 39 of 102
MECH 4020
5.3.2.
Team #15
Human Powered Water Purification System
Winter Term – Final Report
Human Power Testing
The Human Powered Water Purification System was designed so that it may produce 10 L of
drinking water after 20 minutes of operation using only human power. To ensure that the bike can
be powered only using human power, the entire system was assembled (bicycle and hydraulic
circuit) and 2 tests were conducted. The following data was collected at one minute intervals until
10L of clean water were produced:
1. The pedaling speed of the user
2. The system backpressure
3. The accumulated mass of the permeate (clean water)
To measure these parameters, the tachometer, pressure gages, digital scale, and timer were used.
Collecting this data produced results that displayed how much clean water can be produced for an
average pedaling speed and average system back pressure over the course of 20 minutes. The
water quality used for this test was that of lake water (containing approximately 300 ppm TDS).
This type of water quality was selected because it is representative of the type of water that may be
available as the source water for typical applications of this system.
In order to quantify the power consumption of the system and compare it with the power
capabilities of normal humans, the test set-up described in the previous section also incorporated
measuring electrical power being drawn by the motor. The team initially intended to use the
electrical power measurement to correlate to the human power requirement of the system.
However, the team was unable to identify a specification sheet for the DC motor used, and therefore
was unable to determine the efficiency of the motor. For the purposes of the power analysis, the
electrical power drawn by the motor was used only as a rough indication of the human power
requirement. Because of the efficiency of the motor, the electrical power being drawn by the motor
is larger than the mechanical power being used by the system to drive the pump. Because of this,
using electrical power as an indication of mechanical human power is conservative, and gives only
an over-estimate of the mechanical power requirement of the system.
5.3.3.
Water Quality Testing
To measure the effectiveness of the system in improving the water quality, the following
parameters were measured:
1. Total dissolved solids
2. Presence/absence of total coliform bacteria
Dalhousie Univ.
Dept. of Mechanical Eng.
Page 40 of 102
MECH 4020
Team #15
Human Powered Water Purification System
Winter Term – Final Report
3. Presence/absence of E. Coli
4. Total organic carbon (TOC) and dissolved organic carbon (DOC)
Water tests were performed on water collected from three different locations around Halifax, Nova
Scotia, Canada. Water was obtained from Lake Banook in Dartmouth, Nova Scotia and from Frog
Pond and McIntosh Run at Roaches Pond in Spryfield, Nova Scotia. The team selected these
particular lakes for the following reasons:
1. All three lakes were within approximately 20 minutes’ drive of Dalhousie University.
2. According to the HRM Lake Water Data, all 3 lakes contained levels of TDS ranging from
between 50-300 ppm and contained detectable levels of E. Coli.
It was necessary to confirm that the levels of total dissolved solids in the lakes were within
treatable limits of the system before deciding to use the body of water for testing. It was also
necessary to confirm that there were detectable levels of E. Coli in the water so that water quality
tests could show an initial presence of bacteria in the water before treating it with the system.
To measure total dissolved solids, a TDS probe was used as displayed in Figure 25.
Figure 25
Measuring levels of total dissolved solids in laboratory
Each time the probe was setup to measure TDS of a batch of water samples, the probe was
calibrated by inserting it into a known standard solution of 667 ppm. In between samples, the
probe was rinsed using ultrapure water to avoid cross contamination and inaccurate
measurements between water samples.
Dalhousie Univ.
Dept. of Mechanical Eng.
Page 41 of 102
MECH 4020
Team #15
Human Powered Water Purification System
Winter Term – Final Report
To measure bacteria levels, a Colilert Water Test was performed. The Colilert Water Test consists of
a test kit which uses a reagent that is mixed in with the water samples as seen in Figure 26 below.
Figure 26
Mixing in the Colilert reagent into the water samples to test for presence of Coliform and
E.coli
The reagent is composed of indicators that react with enzymes found in coliform and E. coli to
visually alter the colour of the water to indicate either an absence or presence of coliform or E. coli.
This test required that each water sample to be incubated at 35°C for 24 hours. The water samples
were then taken out of the incubator as seen in Figure 27.
Figure 27
The water samples after 24 hours of incubating at 35°C
The round vessel at the bottom left hand of the above image is a standard against which the results
are compared. Water samples that appeared more yellow than the standard after the incubation
Dalhousie Univ.
Dept. of Mechanical Eng.
Page 42 of 102
MECH 4020
Team #15
Human Powered Water Purification System
Winter Term – Final Report
period indicated the presence of total coliforms in the source water. Water samples that appeared
fluorescent blue when placed underneath an ultraviolet lamp (as seen in Figure 28) indicated the
presence of E. coli. Positive detection of E. coli or coliform indicates that there is at least one
organism of bacteria present within 100 ml.
Figure 28
Water sample testing demonstrating presence of E. coli.
The water samples were all collected in sterile glass bottles as per the recommendation of staff at
the water treatment lab. For each type of lake water, water was collect at 3 different points. At the
inlet of the system (influent), after the pre-treatment stage (Pre-Ro), and at the outlet of the RO
membrane (permeate). The test points are shown in the system flow diagram in Figure 29 below.
Figure 29
Water quality testing. 1) Source, 2) After Pre-treatment, 3) RO permeate
Finally, total organic carbon and dissolved organic carbon were also measured. The team was
shown how to prepare the TOC/DOC samples for analysis, but the staff at the water treatment lab
performed the actual analysis. To prepare the sample for TOC and DOC analysis, each water sample
was poured into 100 ml sample containers as shown in Figure 30. Four drops of phosphoric acid
Dalhousie Univ.
Dept. of Mechanical Eng.
Page 43 of 102
MECH 4020
Team #15
Human Powered Water Purification System
Winter Term – Final Report
were added to each sample. Additionally, for the DOC samples, the water samples were filtered
through a 0.45
filter sheet so that only dissolved organic carbon was measured.
Figure 30
5.4.
Samples prepared for TOC/DOC analysis
Results
The raw data obtained for all the different tests performed may be found in Appendix A. Only a
summary of the main results is shown in the following subsections.
5.4.1.
Flow rate Results
For the first set of results, clean tap water was filtered through the system to obtain data for system
performance. Tap water was measured to contain ~ 70 ppm of TDS. From this, as expected, the flow
rate was observed to increase as a function of increased back pressure. So as the recovery rate
valve was closed, increasing the system pressure, more flow was observed to penetrate through the
RO membranes producing higher permeate flow rates. For this type of water quality, flow rates
above 0.5 Lpm were observed for all four pump speeds. As the level of TDS increased, it was
expected that the flow rates would shift down. This was confirmed in Figure 31 below.
Dalhousie Univ.
Dept. of Mechanical Eng.
Page 44 of 102
MECH 4020
Team #15
Human Powered Water Purification System
Winter Term – Final Report
Permeate Flowrate (Lpm)
System Performance Curves
Water Quality: <100 ppm TDS
0.70
0.60
0.50
0.40
0.30
0.20
60
70
80
1010 RPM
Figure 31
90
Pressure (psi)
1130 RPM
100
1260 RPM
110
120
1390 RPM
Flow rate VS backpressure for various pump speeds
Flow rate VS TDS at ~95 RPM and Various System Back Pressures
0.6
Flow rate (Lpm)
0.5
0.4
0.3
0.2
0.1
0
0
500
1000
1500
2000
2500
3000
TDS (ppm)
90 psi
Figure 32
3500
4000
4500
5000
100 psi
Flow rate VS TDS level for pressures of 90 and 100 psi and ~95 rpm pedal speed
As observed from Figure 32, a drop in flow rate is observed as the level of TDS increases. Also, as
the pressure is increased from 90 psi to 100 psi, more flow is observed for all TDS levels. For a
system pressure of 100 psi, the flow rate was observed to drop below 0.5 Lpm at a TDS level of
approximately 500 ppm. To increase the level of TDS that can be pumped through the system while
Dalhousie Univ.
Dept. of Mechanical Eng.
Page 45 of 102
MECH 4020
Team #15
Human Powered Water Purification System
Winter Term – Final Report
maintaining a flow rate of 0.5 Lpm, the curve needs to be shifted upwards corresponding to
increasing the system pressure to 110 or 120 psi.
The following subsection summarizes the results of the human power testing.
5.4.2.
Human Power Results
Two 20 minute trials were performed to demonstrate that a human can sustainably power the
Human Powered Water Purification System for 20 minutes time to produce 10 L of drinking water.
One team member pedaled the bike for 20 minutes. The pedaling speed was measured every
minute to maintain a constant pedaling speed of ~90 RPM. The results of both tests are shown in
Table 8 below.
Trial 2
Trial 1
Table 8
Full 20 minute pedaling test results
Average Pedaling Speed
90 RPM
Average System Back Pressure
100 psi
Total Water Purified
8.2 L
Average Pedaling Speed
90 RPM
Average System Back Pressure
120 psi
Total Water Purified
9.6 L
In the two 20 minute trials of pedaling lake water containing approximately 300 ppm of TDS, the
recovery rate of the RO membranes was varied to increase the permeate from 8.2 L to 9.6 L. Even
though the trial that produced the most amount of water was still 4% under the desired quantity of
10 L, the team believes that it is still possible to achieve 10 L. The team believes that during one test
using water from Halifax harbour, the reverse osmosis membranes were slightly fouled because of
the high salt concentration of the seawater (~35,000 ppm). The full 20 minute tests were done after
seawater was pumped through the system. The system is not designed to handle such high
concentration salt water, but thought it was worth testing purely out of interest and curiosity.
Using the first test set-up in which the pump was being driven by a DC motor, the electrical power
drawn by the motor was also used to quantify the power requirements of the system. The relation
between the permeate flow rate and electrical power to the motor is shown in Figure 33 below.
Dalhousie Univ.
Dept. of Mechanical Eng.
Page 46 of 102
MECH 4020
Team #15
Human Powered Water Purification System
Winter Term – Final Report
Permeate Flowrate (Lpm)
Permeate Flowrate VS Driving Power for various TDS levels
at ~95 RPM Pedal Speed
0.60
0.55
0.50
0.45
0.40
0.35
0.30
0.25
0.20
0.15
0.10
0.05
90
Figure 33
100
110
120
Power (W)
~70 ppm, 22°C**
~1500 ppm, 22°C**
~4500 ppm, 24°C
~80 ppm, 8-10°C
130
140
150
~3000 ppm, 23°C
Flow rate VS driving power for various water qualities and ~95 rpm pedal speed
As demonstrated in the plot, the power requirements of the system vary between about 100 and
140 W. This power requirement is well within the capabilities of human power production. As
described previously in the report (see Figure 22) a healthy adult is able to produce a maximum of
~270 W over a duration of 20 minutes. The power requirements of the Human Powered Water
Purification system fall well below this limit.
One important point to note is that the flow rate of 0.5 Lpm is not achieved for source water with
high concentrations of total dissolved solids, but only for relatively fresh water. In the design
requirements, the team set out an optional requirement that the system remove total dissolved
solids. For this reason, the team is satisfied that the system can achieve the required flow rate for
source waters with low total dissolved solids. For more brackish sources, the system is still able to
produce a reasonable flow rate in the range of 0.3 Lpm, but somewhat less than the 0.5 Lpm target.
In the following figure, the power requirements of the system for different pedaling speeds are
compared to an example of a human power output over a range of pedaling speeds.
Dalhousie Univ.
Dept. of Mechanical Eng.
Page 47 of 102
MECH 4020
Team #15
Human Powered Water Purification System
Winter Term – Final Report
Power VS RPM
200
180
Power, W
160
140
120
100
80
60
40
40
60
Example Human Output
Figure 34
80
100
Pedal RPM
120
140
System Requirement at 100 psi and 70 ppm
Human power capability compared to system power requirement. Human power
capability data obtained from (Wilson, 2004).
As demonstrated by the figure, the power consumption of the system for this particular operating
condition falls within the capabilities of human power. It should be noted that quality of water that
can be treated is limited by human power capabilities, the level of TDS in the water, and the
pressure limitations on the system. The higher the TDS, the higher the pressure required to force
the water through the reverse osmosis membrane. Since power is proportional to the flow rate
multiplied by the pressure produced by the pump, higher TDS water would require that the system
flow rate be decreased in order to keep the power requirements within human capabilities.
5.4.3.
Water Quality Results
For the 3 different water sources, the Colilert Water Test was completed and showed that the
permeate water in all cases was absent of coliform and E. coli. A summary of results from the 3
different lakes is summarized in Tables 9, 10, and 11 below.
Dalhousie Univ.
Dept. of Mechanical Eng.
Page 48 of 102
MECH 4020
Team #15
Human Powered Water Purification System
Table 9
Winter Term – Final Report
Water quality bacterial test results summary for Banook Lake
Lake Banook
E. Coli
Coliform
TDS
Influent
Present
Present
507 ppm
Pre-RO
Absent
Present
491 ppm
Permeate
Absent
Absent
10 ppm
Table 10
Water quality bacterial test results for Fog Pond
Frog Pond
E. Coli
Coliform
TDS
Influent
Present
Present
374 ppm
Pre-RO
Present
Present
---
Permeate
Absent
Absent
47 ppm
Table 11
Water quality bacterial test results for McIntosh Run
McIntosh Run
E. Coli
Coliform
TDS
Influent
Absent
Present
212 ppm
Pre-RO
Absent
Present
---
Permeate
Absent
Absent
18 ppm
The Colilert Water test is sensitive enough to detect a single organism of E. coli or coliform within a
100 ml sample. Therefore, results that yield “Absent” prove that the water contains no E. coli or
coliform in every 100 ml sampled. For all 3 lakes, it is demonstrated that any levels of E. coli or
coliform were removed in the permeate water. Interestingly for Lake Banook, it is actually observed
that E. coli was removed in the pre-RO stage. This suggests that the pre-treatment stage of filters
(before the RO membranes) were successful in removing E. coli. However, in Frog Pond, E. coli was
still present at the Pre-RO stage and was only removed after penetrating through the reverse
osmosis membranes. These conflicting results may be attributed to the fact that the ultra filter in
the pre-treatment stage of the system is specified to filter material at 0.35 microns nominal. E. coli
which may have sizes in the range of 1 micron (Abedon, 1998) may still be getting through since the
nominal rating of 0.35 microns is not an absolute pore size. This demonstrates that the pretreatment stage cannot be relied on and guaranteed to remove micro-bacterial organisms.
However, the permeate out of the RO membranes proves to be successful in removing all
pathogens. Furthermore, for TDS there is approximately a 98% reduction in TDS in Lake Banook
Dalhousie Univ.
Dept. of Mechanical Eng.
Page 49 of 102
MECH 4020
Team #15
Human Powered Water Purification System
Winter Term – Final Report
water, while only ~90% reduction in TDS for the Frog Pond and McIntosh samples. The large drop
in salt rejection between tests is attributed to the fact that in between testing sessions between
Lake Banook and the 2 other lakes, the team attempted passing through Halifax Harbour water
through the system which contained levels of 35,000 ppm. This temporarily clogged the reverse
osmosis membranes and evidently had an effect in decreasing the effectiveness of the membranes
to reduce TDS levels. This is expected though because as the RO membranes are utilized they slowly
foul until the flow rate they produce decreases and the pores within them clog up.
According to the Canadian drinking water guidelines, potable water cannot have any levels of E. coli
or coliform in it. This test confirms that microbiologically contaminated water has been cleaned to
levels that meet this guideline. Furthermore, potable water tends to be produced with levels of TDS
less than 500 ppm. Evidently, the reject of TDS levels in the system is capable of reducing TDS levels
to below this threshold limit of 500 ppm.
The last set of results that will be discussed are the TOC/DOC results. Due to the time constraints,
this test was only performed on water samples obtained from Lake Banook. Table 12 displays the
results that were gathered.
Table 12
Water quality bacterial test results for Frog Pond
TOC [mg/L] DOC [mg/L]
Influent
2.4685
2.411
Pre-RO
2.6065
2.518
Permeate
0.21485
0.25735
From the results of the TOC/DOC test, a 90% reduction is observed in both levels of TOC and DOC.
Interestingly though, an initial increase in TOC and DOC is observed at the Pre-RO stage. This
suggests that there is actually an increase in organic material as the water passes through the pretreatment stage of the system. This makes sense, because it is possible that organic material in the
activated carbon filter is leaching into the water thereby increasing the levels of TOC/DOC.
However, after the reverse osmosis membranes, the permeate appears to have levels of organic
compounds below 0.3 mg/L. According to the Environmental Protection Division of the Ministry of
Environment of British Columbia “the water quality criteria for total organic carbon are 2 mg/L for
treated water and 4 mg/L for source water”. In this test, the system was proven to be capable of
reducing TOC/DOC levels below the 2 mg/L guideline.
Dalhousie Univ.
Dept. of Mechanical Eng.
Page 50 of 102
MECH 4020
6.
Team #15
Human Powered Water Purification System
Winter Term – Final Report
Budget
The allocated budget provided to Team 15 by the Mechanical Engineering Department was $1200.
The total cost of this project was $1112.30 .
A general breakdown of the budget is summarized in Table 13 categorized by major components of
the system. A detailed itemized budget is provided in Table 14.
Table 13
Summarized budget categorized by major components
Major Components
Drive train
(Sprockets, hubs, chain, etc.)
Frame
(Metal, fasteners, etc.)
Hydraulic Components
(Compression fittings, tubes, valves, etc.)
Membranes and Filters
Pump
Total
Dalhousie Univ.
Dept. of Mechanical Eng.
Price
$ 185
$ 230
$ 285
$ 285
$ 135
$ 1110
Page 51 of 102
MECH 4020
Table 14
Team #15
Human Powered Water Purification System
Winter Term – Final Report
Detailed budget
Qty
Drive Train
Item
Price
Subtotal
Supplier
1
Pedals
15.00
15.00
Ideal Bikes
1
45 Tooth Sprocket
10.49
10.49
Mcmaster Carr
1
hub-w 5/8" bore
5.49
5.49
Mcmaster Carr
1
35 tooth sprocket (#35, 5/8"bore)
29.07
29.07
McMaster Carr
1
10 tooth sprocket (#35, 5/8"bore)
9.47
9.47
McMaster Carr
2
3/16 x 12" key stock
2.29
4.58
Princess Auto
1
chain roller #35 10ft
15.99
15.99
Princess Auto
6
bearings
3.99
23.94
Princess Auto
1
sprocket weld-on 35v16
2.99
2.99
Princess Auto
1
sprocket weld-on 35w60
15.49
15.49
Princess Auto
1
hub-w 5/8" bore
5.49
5.49
Princess Auto
1
hub-v 5/8" bore
4.49
4.49
Princess Auto
1
connecting link
1.99
1.99
Princess Auto
1
L075 x 5/8 Jaw Coupling
4.07
4.07
Wajax
1
jaw coupling spider
1.15
1.15
Wajax
1
L075 x 7/16 Jaw Coupling
12.33
12.33
Wajax
1
Fastners
12.35
12.35
Canadian Tire
1
Metal
16.29
16.29
Kent Building Supplies
1
Metal
83.55
83.55
Metals-R-Us
1
Metal
17.00
17.00
Metals-R-Us
1
Metal
18.50
18.50
Metals-R-Us
4
2.5" clamp exhausts
2.79
11.16
Princess Auto
1
Fastners
3.74
3.74
Princess Auto
2
1/4" nut
0.05
0.10
Princess Auto
2
1/4" x 1.5" bolt
0.15
0.30
Princess Auto
2
hose clamps 2"
1.19
2.38
Princess Auto
2
2.5" clamp exhausts
2.79
5.58
Princess Auto
1
Zinc assortment of fastners
20.09
20.09
Trans-World Distributing
Ltd.
Frame
Hydraulic Components
1
3/8 Tubing
8.39
8.39
Canadian Tire
1
Compression Sleeves (pkg)
6.58
6.58
Canadian Tire
1
Miniature PVC Suction Strainer Fits 3/8 NPT
Male, 304 Stainless Steel Screen, Mesh Size 80
Nylon Check Valve
2.1
2.1
Mcmaster Carr
15.00
15.00
Mcmaster Carr
0.85
21.25
McMaster Carr
1
25
Choose-A-Color Flexible Nylon Tubing .275" ID,
3/8" OD, .050" Wall Thickness, White
Dalhousie Univ.
Dept. of Mechanical Eng.
Page 52 of 102
MECH 4020
Qty
6
Team #15
Human Powered Water Purification System
Winter Term – Final Report
1
Item
Durable White Nylon Compression Tube Fitting
Tee for 3/8" Tube OD
Tube Fitting Adapter for 3/8" Tube OD X 1/4"
NPTF Male Pipe
Tube Fitting Adapter for 3/8" Tube OD X 3/8"
NPT Male Pipe
Tube Fitting Adapter for 3/8" Tube OD X 3/8"
NPT Female Pipe
Tube Fitting Adapter for 3/8" Tube OD X 1/4"
NPTF Female Pipe
Self-Aligning Brass Compression Tube Fitting
Adapter for 3/8" Tube OD X 1/2" NPTF Female
Pipe
Self-Aligning Brass Compression Tube Fitting
Adapter for 3/8" Tube OD X 1/2" NPTF Male
Pipe
Self-Aligning Brass Compression Tube Fitting
Adapter for 3/8" Tube OD X 1/8" NPTF Male
Pipe
Miniature PVC Ball Valve 3-Port, NPT Female X
Female X Female, 1/4" Pipe Sz
Compact Plastic Needle Valve 1/4" Female NPT
X 1/4" Female NPT
Adjustable Bronze Relief Valve Precision, 1/2
NPT Inlet, 1/2 NPT Outlet, 25-175 PSI
Multipurpose Gauge Plastic Case, 2" Dial, 1/4
NPT Bottom, 0-200psi
Breather Vent 1/2 NPT Male, 17 Max SCFM,
7/8" Height
Teflon Tape
2
3/4" x 1/2" sch40 bushing
1.38
2.76
Northeast Equipment Ltd
2
3/8" comp x 1/2" MPT brass fitting
2.52
5.04
Northeast Equipment Ltd
2
3/4" x 1/2" sch40 bushing
1.38
2.76
Northeast Equipment Ltd
2
3/8" comp x 1/2" MPT brass fitting
2.52
5.04
Northeast Equipment Ltd
2
18.9L empty bottles
14.79
29.58
Sobeys
4
4
1
2
1
1
6
0
2
1
2
1
Price
4.14
Subtotal
24.84
Supplier
McMaster Carr
1.48
5.92
McMaster Carr
1.48
5.92
McMaster Carr
2.50
2.50
McMaster Carr
2.22
4.44
McMaster Carr
6.23
6.23
McMaster Carr
4.06
4.06
McMaster Carr
2.36
14.16
McMaster Carr
16.14
0.00
McMaster Carr
20.24
40.48
McMaster Carr
25.42
25.42
McMaster Carr
9.66
19.32
McMaster Carr
2.74
2.74
McMaster Carr
0.59
0.59
Northeast Equipment Ltd
Membranes and filters
1
RO Membrane housing
13.95
13.95
1
Ultra filter
18.90
18.90
Atlantic Purification
Systems Ltd
EMS Water Systems
1
Ultra filter casing
22.03
22.03
EMS Water Systems
2
100 GPD RO Membrane
76.00
152.00
EMS Water Systems
1
carbon block cartridge
3.00
3.00
EMS Water Systems
1
carbon block casing
17.00
17.00
EMS Water Systems
1
Water Filter w/ Blue Bowl, for Particles, 3/8
NPT, 5 GPM
23.17
23.17
McMaster Carr
Pump
Dalhousie Univ.
Dept. of Mechanical Eng.
Page 53 of 102
MECH 4020
Qty
1
Team #15
Human Powered Water Purification System
Item
70 GPH Rotary Vane Pump
Subtotal
Shipping
Price
98
Subtotal
98
Winter Term – Final Report
Supplier
Simgo
$ 956.24
1
2
$ 70.18
Taxes
$ 85.88
Total
$ 1112.30
1The taxes from the shipped orders
2This
(McMaster Carr and Simgo) have been absorbed into this amount
is a summation of all taxes spent from items purchased locally (all suppliers except McMaster Carr and Simgo)
Dalhousie Univ.
Dept. of Mechanical Eng.
Page 54 of 102
MECH 4020
7.
Team #15
Human Powered Water Purification System
Winter Term – Final Report
Implementation
This section will present analyses on the economics and sustainability of the Human Power Water
Purification System, as well as how it compares to similar designs.
7.1.
Economic Analysis
Some research was done into the economics of the human powered water purification system. This
section includes financial viability and sustainability of the value of the project to the current
economy. The economic analysis compares the cost of the human powered water purification
system to the cost of purchasing drinking water in 18.5 L jugs, and cases of 500 ml water bottles.
Assumptions to Economic Analysis:
No discount rate is considered
The water consumption rate is 10 liters per day (family of 5) for 10 years
The RO membranes have to be replaced once a year, whereas cartridge filters have to be
replaced twice a year (Total replacement cost = $225/year)
The cost of refilling 18.5 L water tank is $3 and the cost of a 500 ml water bottle is $1.50
Transportation costs were neglected
Table 15
Economic analysis summary
Water Sourcing Option
Human Powered Water Purification System
18.5 L jugs
500 ml bottles
Dalhousie Univ.
Dept. of Mechanical Eng.
10 Year Cost (Present Day Dollars)
$3300
$6000
$13,000
Page 55 of 102
MECH 4020
7.2.
Team #15
Human Powered Water Purification System
Winter Term – Final Report
Environmental sustainability
Having done the economic analysis, the design of the system turned out to be also good for the
environment. Assuming it is being used by a family living in a cottage in North Preston, Nova Scotia
where access to clean water may not be easy, the design can avoid more than 7 tons of greenhouse
gas emissions in ten years. The carbon dioxide emissions associated with the production of plastic
bottles amounts to 0.195 kg of CO2 per liter. The amount of water bottles consumed in 10 years by a
family of 5 would result in a total of 7000 kg of
Figure 35
7.3.
.
Location of case study
Design comparison
Initially, the design was inspired by two other human powered water purification systems which
are the Aquaduct (Inhabitat, Web.) and the Pedal Powered Human Ultrafiltration Unit (World Wide
Water, Web.). Our group succeeded to make the design more powerful than the aforementioned
designs in treating water.
The Aquaduct is a pedal-powered concept vehicle that transports, filters, and stores water for the
developing world. As the rider pedals, a pump attached to the pedal crank draws water from a large
holding tank, through a carbon filter, to a smaller, clean tank. This design cannot kill E.Coli bacteria.
It uses a carbon filter for the water treatment.
Dalhousie Univ.
Dept. of Mechanical Eng.
Page 56 of 102
MECH 4020
Team #15
Human Powered Water Purification System
Figure 36
Winter Term – Final Report
The Aquaduct
The Pedal Powered Human Ultrafiltration Unit is capable of delivering microbiologically pure water
from fresh water sources. The treated water may contain a wide range of pathogens and is treated
using an ultrafiltration membrane.
Figure 37
The Pedal Powered Human Ultrafiltration Unit
A comparison of the Human Powered Water Purification unit with the abovementioned designs is
summarized in Table 16 below.
Dalhousie Univ.
Dept. of Mechanical Eng.
Page 57 of 102
MECH 4020
Team #15
Human Powered Water Purification System
Table 16
Design
Dalhousie Univ.
Dept. of Mechanical Eng.
Winter Term – Final Report
Design comparison of different water purification systems
Microbacterial
removal?
TDS removal?
Flow rate (Lpm)
Price
No
No
?
?
Yes
No
14
?
Yes
Yes
0.50
$1100
Page 58 of 102
MECH 4020
8.
Team #15
Human Powered Water Purification System
Winter Term – Final Report
Conclusion
The Human Powered Water Purification System succeeded in meeting the design requirements,
with the exception of marginally meeting the flow rate requirement. The design requirements and
achievements are summarized in the table below.
Table 17
Category
Power
Capacity
Water Quality
Physical
Cost
Summary of achieved design requirements
Requirement
Essential
• Mechanically human powered
Optional
• Can be powered by only one person
Essential
• 10 L of water after 20 minutes of
operation
Essential
• Reduce bacteria, viruses to potable
level
Optional
• Reduce dissolved solids to potable
level
Essential
• Weight less than 40 kg
• Not to exceed 1 m3 envelope volume
Essential
• Prototype cost < $1200
Optional
• Projected product fabrication cost in
quantity should not exceed $200
Achieved
• Yes
• Yes
• 9.6 L in 20 min
• Coliform and E. Coli
completely removed
• 94% TDS rejection rate
• 31.4 kg
• 0.99 m3
• $1110
• Unexamined
With regards to the capacity requirement of 10L, the system was capable of producing 9.6 L of
water, 4% under the desired quantity of 10 L. The team believes that they were not able to surpass
the 10 L requirement because at an earlier testing session, one test was performed using water
from Halifax harbour. The team suspects that the reverse osmosis membranes were slightly fouled
because of the high salt concentration of the seawater (~35,000 ppm). Furthermore, earlier testing
sessions confirmed that the system can produce flow rates higher than 0.5 Lpm.
Dalhousie Univ.
Dept. of Mechanical Eng.
Page 59 of 102
MECH 4020
Team #15
Human Powered Water Purification System
Winter Term – Final Report
Future iterations of the design could improve in several areas:
The residential reverse osmosis membranes should be replaced with membranes
specifically designed for brackish water applications in order to reduce the possibility of
membrane fouling and increase the longevity of the system.
A third reverse osmosis membrane in parallel would increase the total flow that the system
can produce (up to 0.75 Lpm). With the increased capacity, the system would also require a
larger pump.
The water quality of the system permeate water should be tested for a broader variety of
contaminants. The levels of total coliforms and total dissolved solids could be supplemented
with measurements of the levels of specific heavy metals and chemicals.
Dalhousie Univ.
Dept. of Mechanical Eng.
Page 60 of 102
MECH 4020
Team #15
Human Powered Water Purification System
Winter Term – Final Report
References and Bibliography
Abedon, Stephen. "Bacteria Cell Shapes and Arrangements." Bacteria Cell Shapes and Arrangements.
N.p., 28 Mar. 1998. Web.
Agardy, Franklin J., and Patrick J. Sullivan. Environmental Engineering: Water, Wastewater, Soil and
Groundwater Treatment and Remediation. Hoboken, NJ: Wiley, 2009. Print.
AMI Membranes. Web. <http://www.appliedmembranes.com >. Last accessed December 1, 2012.
"Aquaduct Bike Purifies Water as You Pedal." Inhabitat. N.p., n.d. Web.
<http://inhabitat.com/aquaduct-bike-purifies-water-as-you-pedal/>.
Brown, L. Soboyejo, W. Soboyejo, A . Plappally, K & Yakub, I. (2011). Physical Properties of Porous
Clay Ceramic-Ware. Food Agricultural and Biological Engineering, The Ohio State University.
Buckley, Chris A., and Joseph G. Jacangelo. "Microfiltration." Water Treatment Membrane Processes.
New York: McGraw-Hill, 1996. 11.1-1.39. Print.
Chain Selection. Catalogue. Renold Jeffrey, n.d. Web. 1 Dec. 2012.
<http://www.renoldjeffrey.com/nmsruntime/saveasdialog.asp?lID=950&sID=2701>.
Dickenson, T. Christopher. Filters and Filtration Handbook. Oxford [u.a.: Elsevier Advanced
Technology, 1997. Print.
Fiore, J. V., and R. A. Babineau. "Effect of an Activated Carbon Filter on the Microbial Quality." Appl.
Environ. Microbiol. 34.5 (1977): 541-46. Web.
<http://aem.asm.org/content/34/5/541.full.pdf+html?sid=f2a7578a-ee7c-4dae-acb9518df343ee00>.
"Frequently Asked Questions." Halifax Regional Water Commission, 2013. Web.
Hanaki-Martin, Saori. THE EFFECTS OF SEAT POST ANGLE IN CYCLING PERFORMANCE. Thesis.
University of Kentucky, 2012. Lexington: University of Kentucky, 2012. Print.
Dalhousie Univ.
Dept. of Mechanical Eng.
Page 61 of 102
MECH 4020
Team #15
Human Powered Water Purification System
Winter Term – Final Report
Kucera, Jane. Reverse Osmosis: Design, Processes, and Applications for Engineers. Salem, MA:
Scrivener Pub., 2010. Print.
Lingireddy, Srinivasa. Control of Microorganisms in Drinking Water. Reston, VA: American Society
of Civil Engineers, 2002. Print.
Liquid Membrane Types. Renssealer Polytechnic Institute, n.d. Web. <http://www.rpi.edu/
dept/chem-eng/Biotech-Environ/patillo/membrane.biochem/mem.types.html>.
"McMaster-Carr." McMaster-Carr. N.p., n.d. Web. 01 Dec. 2012. <http://www.mcmaster.com/>.
Microbiological Quality of Drinking Water." Appl. Environ. Microbiol. 41.3 (1981): 646-51. Web.
<http://aem.asm.org/content/70/5/2848.full.pdf>.
PASCO. N.p., n.d. Web. <http://www.pascocanada.com/ProductTab.php?p=ME-6942>.
"Pedal Powered Water Bike." World Wide Water. N.p., n.d. Web.
<http://www.worldwidewater.biz/pedal-powered-water-bike/>.
"Solar Water Disinfection." Wikipedia. Wikimedia Foundation, 11 Feb. 2012. Web. 05 Nov. 2012.
<http://en.wikipedia.org/wiki/Solar_water_disinfection>.
The CO2 List. (2012, July). Co2 released when making & using products. Web.
<http://www.co2list.org/files/carbon.htm>.
Tobin, R. S., D. K. Smith, and J. A. Lindsay. "Effects of Activated Carbon and Bacteriostatic Filters on
Microbiological Quality of Drinking Water." Appl. Environ. Microbiol. 41.3 (1981): 646-51. Web.
<http://aem.asm.org/content/70/5/2848.full.pdf>.
"Water Quality." Environmental Protection Division. Government of British Columbia, n.d. Web.
<http://www.env.gov.bc.ca/wat/wq/BCguidelines/orgcarbon/drinking.html>.
Wilson, David Gordon., and Jim Papadopoulos. Bicycling Science. Cambridge, MIT, 2004. Print.
Dalhousie Univ.
Dept. of Mechanical Eng.
Page 62 of 102
MECH 4020
Team #15
Human Powered Water Purification System
Winter Term – Final Report
Appendix A Raw Data
Dalhousie Univ.
Dept. of Mechanical Eng.
Page 63 of 102
MECH 4020
Team #15
Human Powered Water Purification System
RPM
Pressure
(psi)
Concentrat
e
Initial
Mass (kg)
Permeate
Initial
Mass (g)
Voltage
(V)
Concentra
te
Final Mass
(kg)
Current
(Amp)
Permeate
Final Mass
(kg)
time interval
(sec)
Concentrate
Flow rate
(L/min)
1008
70
8.6
860
2.7
29.41
9.8
1100
34.8
2.07
1008
80
12.6
750
2.82
28.96
13.7
1000
31.4
1008
90
1.7
580
3.18
29.73
2.8
860
1008
100
9.6
812
3.45
30
10.6
1008
110
12.4
660
3.8
30.38
1134
70
9.1
490
2.72
1134
80
13.4
660
1134
90
17.9
1134
100
1134
1260
Winter Term – Final Report
Permeate
Flow rate
(L/min)
Recovery
Rate
TDS
Initial
TDS
Final
Batch
Temp (°C)
0.41
0.17
71.80
5.50
25.00
2.10
0.48
0.19
71.80
3.70
25.00
32.1
2.06
0.52
0.20
71.80
4.30
25.00
1140
32.4
1.85
0.61
0.25
71.80
4.70
25.00
13.7
1150
44.6
1.75
0.66
0.27
71.80
3.30
25.00
32.47
10.5
705
31.5
2.67
0.41
0.13
71.80
5.60
24.00
2.9
32.74
14.7
920
33.1
2.36
0.47
0.17
71.80
2.70
24.00
800
3.14
33.01
19.2
1100
33.2
2.35
0.54
0.19
71.80
2.50
24.00
3
850
3.38
33.04
4.2
1150
31.2
2.31
0.58
0.20
71.80
2.90
24.00
110
6.4
750
3.63
33.32
7.6
1102
33.2
2.17
0.64
0.23
71.80
2.60
24.00
70
5.6
560
2.85
36.3
7.2
753
32.2
2.98
0.36
0.11
71.80
5.60
22.00
1260
80
9.8
580
3.02
36.49
11.4
804
32.3
2.97
0.42
0.12
71.80
3.80
22.00
1260
90
13.94
594
3.24
36.5
15.4
853
33.2
2.64
0.47
0.15
71.80
2.40
22.00
1260
100
17.5
1048
3.41
36.8
19
1326
31.2
2.88
0.53
0.16
71.80
2.90
22.00
1260
110
2.7
718
3.74
37
4.1
1010
32.3
2.60
0.54
0.17
71.80
4.20
19.00
1386
70
7
587
2.79
39.2
8.7
750
31.3
3.26
0.31
0.09
71.80
2.30
19.00
1386
80
11.7
560
3.03
39.6
13.4
760
32.2
3.17
0.37
0.11
71.80
1.80
19.00
1386
90
16.5
569
3.23
39.8
18.2
820
32.2
3.17
0.47
0.13
71.80
5.20
22.00
1386
100
3
680
3.5
39.9
4.5
960
31.3
2.88
0.54
0.16
71.80
2.60
22.00
1386
110
7.7
807
3.7
40.1
9.4
1123
32.2
3.17
0.59
0.16
71.80
1.80
22.00
1008
70
2.9
609
2.72
29.16
4.1
768
34
2.12
0.28
0.12
1731
17.1
22.00
1008
80
6.6
524
2.88
29.36
7.7
679
31.2
2.12
0.30
0.12
1731
79
22.00
1008
90
10.4
522
3.11
29.75
11.5
702
31.4
2.10
0.34
0.14
1731
129.2
22.00
1008
100
13.5
575
3.4
29.86
14.6
779
31.3
2.11
0.39
0.16
1731
60.00
22.00
1008
110
8.5
584
3.64
30.17
9.6
824
31.2
2.12
0.46
0.18
1589
83.70
23.00
Dalhousie Univ.
Dept. of Mechanical Eng.
Page 64 of 102
MECH 4020
Team #15
Human Powered Water Purification System
Winter Term – Final Report
1134
70
11.6
1138
2.65
33.48
13.1
1303
34.1
2.64
0.29
0.10
1589
83.70
23.00
1134
80
2.5
442
2.92
32.87
3.8
621
32.4
2.41
0.33
0.12
1637
69.50
24.00
1134
90
5.4
841
3.13
32.94
6.6
1034
31.3
2.30
0.37
0.14
1637
69.50
24.00
1134
100
8
1268
3.36
32.94
9.3
1519
33.4
2.34
0.45
0.16
1637
69.50
24.00
1134
110
10.8
1833
3.66
33.35
12
2091
31.3
2.30
0.49
0.18
1637
69.50
24.00
1260
70
8.4
789
2.67
35.67
10.1
920
32.8
3.11
0.24
0.07
1617
64.60
22.00
1260
80
11.5
1060
2.84
35.6
13.1
1215
32.1
2.99
0.29
0.09
1617
64.60
22.00
1260
90
14.5
1368
3.03
36
16.1
1548
33.2
2.89
0.33
0.10
1617
64.60
22.00
1260
100
17.3
1700
3.3
36
18.7
1902
30.4
2.76
0.40
0.13
1617
64.60
22.00
1260
110
2.7
474
3.56
36.3
4.2
694
33.2
2.71
0.40
0.13
1470
61.20
21.00
1386
70
6.4
927
2.74
39.1
8.2
1066
31.3
3.45
0.27
0.07
1470
61.20
21.00
1386
80
6.7
1582
2.95
39.05
8.5
1750
32.2
3.35
0.31
0.09
1457
48.00
25.00
1386
90
13.3
1580
3.16
39.2
15
1785
32.4
3.15
0.38
0.11
1470
61.20
21.00
1386
100
9.9
1915
3.37
39.3
11.4
2150
31.3
2.88
0.45
0.14
1457
48.00
25.00
1386
110
13.1
2440
3.65
39.5
14.6
2720
32.3
2.79
0.52
0.16
1457
48.00
25.00
1134
70
2.7
188
2.68
32.64
4.1
298
31.4
2.68
0.21
0.07
3369
116.5
22.00
1134
80
5.2
395
2.89
32.7
6.6
519
32.2
2.61
0.23
0.08
3369
116.5
22.00
1134
90
7.7
633
3.11
32.9
9
775
31.3
2.49
0.27
0.10
3369
116.5
22.00
1134
100
10.2
928
3.36
33.05
11.5
1094
31.2
2.50
0.32
0.11
3369
116.5
22.00
1134
110
12.6
1255
3.65
33.3
13.8
1448
32.2
2.24
0.36
0.14
3369
116.5
22.00
1260
70
2.9
209
2.66
36
4.5
306
30.3
3.17
0.19
0.06
2974
127.9
23.00
1260
80
6.6
461
2.88
35.6
8.2
587
31.3
3.07
0.24
0.07
2974
127.9
23.00
1260
90
10.5
795
3.05
35.9
12.1
943
31.2
3.08
0.28
0.08
2974
127.9
23.00
1260
100
13.1
1066
3.33
36.2
14.8
1260
34.1
2.99
0.34
0.10
2974
127.9
23.00
1260
110
1.6
205
3.59
36.4
2.9
407
31.3
2.49
0.39
0.13
3300
172.9
23.00
1386
70
6.2
695
2.7
39
8.3
812
36
3.50
0.20
0.05
3300
172.9
23.00
1386
80
10.1
921
2.88
39.1
11.7
1044
30.4
3.16
0.24
0.07
3300
172.9
23.00
1386
90
2.9
258
3.11
38.9
4.7
413
32.3
3.34
0.29
0.08
3374
119.7
23.00
1386
100
6.5
614
3.34
39.3
8.2
788
32.2
3.17
0.32
0.09
3374
119.7
23.00
Dalhousie Univ.
Dept. of Mechanical Eng.
Page 65 of 102
MECH 4020
Team #15
Human Powered Water Purification System
Winter Term – Final Report
1386
110
10.3
1045
3.57
39.5
11.9
1253
32.3
2.97
0.39
0.12
3374
119.7
23.00
1134
70
1.6
154
2.73
32.73
3.4
250
40.47
2.67
0.14
0.05
4659
231
24.00
1134
80
5.5
371
2.92
32.5
7
466
32.14
2.80
0.18
0.06
4659
231
24.00
1134
90
9
620
3.15
33
10.5
740
32.6
2.76
0.22
0.07
4659
231
24.00
1134
100
12.3
920
3.34
33.19
13.9
1070
32.58
2.95
0.28
0.09
4659
231
24.00
1134
110
10.2
598
3.61
3.54
11.5
770
30.9
2.52
0.33
0.12
4103
192
24.00
1260
70
3.2
151
2.68
35.7
4.8
202
30.66
3.13
0.10
0.03
4685
295
24.00
1260
80
6.7
287
2.84
35.86
8.4
380
34.09
2.99
0.16
0.05
4685
295
24.00
1260
90
9.9
475
3.09
36
11.4
589
31.25
2.88
0.22
0.07
4685
295
24.00
1260
100
2.5
186
3.27
36.08
4.2
342
35.56
2.87
0.26
0.08
4330
203
24.00
1260
110
6.1
511
3.52
36.63
7.6
665
31.99
2.81
0.29
0.09
4330
203
24.00
1386
70
12.2
607
2.68
38.78
14
688
30.52
3.54
0.16
0.04
3427
322
24.00
1386
80
3
180
2.89
38.7
4.9
289
31.67
3.60
0.21
0.05
3762
172
25.00
1386
90
6.6
408
3.08
39.1
8.4
534
31.2
3.46
0.24
0.07
3762
172
25.00
1386
100
10.3
693
3.28
39.26
12
848
31.48
3.24
0.30
0.08
3762
172
25.00
1386
110
13.7
1007
3.5
39.46
15.3
1175
30.42
3.16
0.33
0.10
3762
172
25.00
1134
70
2.4
157
2.7
32.24
3.8
218
32.39
2.59
0.11
0.04
82.00
84.00
8.00
1134
80
5.9
388
2.93
32.41
7.3
504
32.05
2.62
0.22
0.08
82.00
84.00
8.00
1134
90
8.8
641
3.18
32.7
10.1
770
30.56
2.55
0.25
0.09
82.00
84.00
8.00
1134
100
11.5
914
3.41
33.04
12.9
1060
31.44
2.67
0.28
0.09
82.00
84.00
8.00
1134
110
14.1
1195
3.72
33.46
15.4
1350
30.14
2.59
0.31
0.11
82.00
84.00
8.00
1260
70
5.9
763
2.74
35.6
7.6
856
32.13
3.17
0.17
0.05
73.00
4.60
8.00
1260
80
9.3
965
2.94
35.9
10.9
1077
32.06
2.99
0.21
0.07
73.00
4.60
8.00
1260
90
13
1225
3.18
35.93
14.5
1345
30.76
2.93
0.23
0.07
73.00
4.60
8.00
1260
100
4.5
460
3.36
36
6.1
608
31.13
3.08
0.29
0.08
89.70
2.60
10.00
1260
110
7.7
765
3.6
36.53
9.3
920
32.01
3.00
0.29
0.09
89.70
2.60
10.00
1260
120
11.5
1198
3.84
36.47
13
1385
32.58
2.76
0.34
0.11
89.70
2.60
10.00
1386
70
1.8
206
2.69
38.59
3.6
307
31.35
3.44
0.19
0.05
88.30
3.00
10.00
1386
80
5.3
425
2.88
38.76
7
543
30.56
3.34
0.23
0.06
88.30
3.00
10.00
Dalhousie Univ.
Dept. of Mechanical Eng.
Page 66 of 102
MECH 4020
Team #15
Human Powered Water Purification System
Winter Term – Final Report
1386
90
9.5
723
3.1
38.93
11.3
857
31.83
3.39
0.25
0.07
88.30
3.00
10.00
1386
100
12.8
990
3.33
39.25
14.6
1142
31.89
3.39
0.29
0.08
88.30
3.00
10.00
1386
110
2.3
275
3.6
39.4
4.8
540
45.6
3.29
0.35
0.10
90.60
2.30
11.00
1386
120
6.4
740
3.8
39.4
8.1
937
31.33
3.26
0.38
0.10
90.60
2.30
11.00
Dalhousie Univ.
Dept. of Mechanical Eng.
Page 67 of 102
MECH 4020
Team #15
Human Powered Water Purification System
Winter Term – Final Report
Appendix B Design Calculations
Dalhousie University
Dept. of Mechanical Eng.
Page 68 of 102
MECH 4020
Dalhousie University
Dept. of Mechanical Eng.
Team #15
Human Powered Water Purification System
Winter Term – Final Report
Page 69 of 102
MECH 4020
Dalhousie University
Dept. of Mechanical Eng.
Team #15
Human Powered Water Purification System
Winter Term – Final Report
Page 70 of 102
MECH 4020
Dalhousie University
Dept. of Mechanical Eng.
Team #15
Human Powered Water Purification System
Winter Term – Final Report
Page 71 of 102
MECH 4020
Dalhousie University
Dept. of Mechanical Eng.
Team #15
Human Powered Water Purification System
Winter Term – Final Report
Page 72 of 102
MECH 4020
Dalhousie University
Dept. of Mechanical Eng.
Team #15
Human Powered Water Purification System
Winter Term – Final Report
Page 73 of 102
MECH 4020
Dalhousie University
Dept. of Mechanical Eng.
Team #15
Human Powered Water Purification System
Winter Term – Final Report
Page 74 of 102
MECH 4020
Dalhousie University
Dept. of Mechanical Eng.
Team #15
Human Powered Water Purification System
Winter Term – Final Report
Page 75 of 102
MECH 4020
Dalhousie University
Dept. of Mechanical Eng.
Team #15
Human Powered Water Purification System
Winter Term – Final Report
Page 76 of 102
MECH 4020
Dalhousie University
Dept. of Mechanical Eng.
Team #15
Human Powered Water Purification System
Winter Term – Final Report
Page 77 of 102
MECH 4020
Team #15
Human Powered Water Purification System
Winter Term – Final Report
Appendix C Matlab code for process flow simulation
%Simulate Flow Through Black Max TFC Membranes
close all; clear all; clc;
%RO Ratings for BME1812R100 BlackMax TFC Membrane
Rec_ro = 0.15;
%Rated recovery rate
Q_ro_r = 380/24/60;
%Lpm, from Lpd
P_ro = 65;
%psi
TDS_ro = 500;
%ppm
R_ro_tm = P_ro/Q_ro_r;
%Effective transmembrane
resistance at rated conditions
%Define Water Qualities
TDS = [100 1000 2000 4000];
%System Back Pressures (assume pressure drop across pretreatment is
%negligible)
P = [65:120];
%Calculate Permeate flow for different conditions (assume T = 25 degC,
therefore Ct = 1)
for i = 1:length(TDS)
Qro(i,:) = (P-TDS(i)/100).*Q_ro_r/(P_ro-TDS_ro/100);
end
%For two RO's in parallel:
Qp = Qro*2;
figure
plot(P, Qp(1,:));
title('Permeate Flow vs. Applied Pressure')
xlabel('Pressure, psi')
ylabel('Permeate Flowrate, Lpm')
grid on
hold on
plot(P, Qp(2,:), 'r'); plot(P, Qp(3,:), 'g'); plot(P, Qp(4,:), 'k');
legend('100 ppm', '1000 ppm', '2000 ppm', '4000 ppm', 'Location',
'NorthWest')
%Pedalling Power
eff_p = 0.35;
eff_dt = 0.85;
%Pump Efficiency
%Drivetrain efficiency
%Assume pedaling speed is kept at constant 90 RPM
GR = 13.5;
%Sprocket reduction ratio
w_pump = 13.5*90;
%RPM
%Pump is rated to produce 70 gph (4.4 Lpm) at 1750 RPM, and flow is
approximately
%proportional to rotation speed
Qfeed = 4.4*w_pump/1750;
Dalhousie University
Dept. of Mechanical Eng.
Page 78 of 102
MECH 4020
Team #15
Human Powered Water Purification System
Winter Term – Final Report
%Recovery Rate given by:
Rec = Qp/Qfeed;
P_fluid = Qfeed*P*0.117;
Watts
P_human = P_fluid/eff_p/eff_dt;
%Fluid power - 0.117 is conversion to
%Human Power, W
figure
plot(P_human, Qp(1,:));
title('Permeate Flow vs. Human Power Input')
xlabel('Power, W')
ylabel('Permeate Flowrate, Lpm')
grid on
hold on
plot(P_human, Qp(2,:), 'r'); plot(P_human, Qp(3,:), 'g'); plot(P_human,
Qp(4,:), 'k');
legend('100 ppm', '1000 ppm', '2000 ppm', '4000 ppm', 'Location',
'NorthWest')
Dalhousie University
Dept. of Mechanical Eng.
Page 79 of 102
MECH 4020
Team #15
Human Powered Water Purification System
Winter Term – Final Report
Appendix D Product Specification Sheets
Dalhousie University
Dept. of Mechanical Eng.
Page 80 of 102
MECH 4020
Dalhousie University
Dept. of Mechanical Eng.
Team #15
Human Powered Water Purification System
Winter Term – Final Report
Page 81 of 102
MECH 4020
Dalhousie University
Dept. of Mechanical Eng.
Team #15
Human Powered Water Purification System
Winter Term – Final Report
Page 82 of 102
MECH 4020
Dalhousie University
Dept. of Mechanical Eng.
Team #15
Human Powered Water Purification System
Winter Term – Final Report
Page 83 of 102
MECH 4020
Dalhousie University
Dept. of Mechanical Eng.
Team #15
Human Powered Water Purification System
Winter Term – Final Report
Page 84 of 102
MECH 4020
Team #15
Human Powered Water Purification System
Winter Term – Final Report
Appendix E Supervisor Meeting Minutes
Friday, September 14th , 2012
The team met with Dr. Ugursal for the second time, and he confirmed that he would supervise the
team. The project ideas that were originally proposed where the safer car seat design and the
human powered water purification system. After this meeting, the team decided to focus on the
human powered water filtration system instead of the safer car seat design. The car seat design was
considered too expensive to test without sponsorship, and possibly beyond the scope of the design
project.
Friday, September21st
The first tentative group design requirements were proposed. This included that the design should:
Cost effective
Durable
Human powered
Capable of providing water for a family of five
Should be easy to ship and assemble if manufactured
The group also stated that 1st official deliverable was due within a week and a half, and were well
underway, though still not focussed on what type of water the design should be capable of dealing
with.
Friday, September 28th, 2012
The team presented the design selection memo to Dr. Ugursal. The focus at this stage of the project
was a system for treating fresh water, and the different ways to do it. Some basic things that were
considered when selecting a system were as followed;
Cost analysis (is the design practical and cost efficient)
Dalhousie University
Dept. of Mechanical Eng.
Page 85 of 102
MECH 4020
Team #15
Human Powered Water Purification System
Winter Term – Final Report
Is it mass produced or produced on site
It was suggested by Dr. Ugursal that if the system was too be deployed in impoverished nations, it
should be possible to build it on site with basic materials available to the local people. Also, if parts
that were not available on site where needed, they should not cost more than 200 dollars.
Friday, October 5th, 2012
During this meeting, some more ideas were discussed briefly. On presented by Dr. Ugursal was that
the design be extrapolated to harness animal power instead of human power if the system was to
be scaled up. It was also discussed that it is possible to make certain components using simple
materials, such as a pressure vessel by burying a plastic container. It was also made clear that all
research and ideas pertaining to the project were to be recorded and dated in the project logbooks.
This way a complete story of how the design progressed was.
The following meeting was rescheduled for Monday, October 22nd because of a scheduling conflict.
Friday, October 12th, 2012
During this meeting, the team presented Dr. Ugursal with some of the research for components and
processes that could be employed at a minimal cost. These are listed below.
Ceramic filtration
Mechanical hand pumps for producing moderate water pressures
Solar UV (ultra-violet) disinfection via plastic bottle.
Bio-sand (slow sand) filtration
While a basic knowledge of these processes were attained, it was decided that to properly select a
design, each major type of water filtration had to be researched before one specific filtration could
be selected. Dr. Ugursal also recommended that the team speak to Dr. Graham Gagnon from civil
engineering because he is considered an expert on water filtration. It was also decided that the
Dalhousie University
Dept. of Mechanical Eng.
Page 86 of 102
MECH 4020
Team #15
Human Powered Water Purification System
Winter Term – Final Report
design selected would have to be site specific, because there was not one single design that was the
most practical in all different situations.
Monday, October 22nd, 2012
In this meeting, all of the water purification research by each group member was shared. The types
of filtration methods that were researched were listed below along with a brief description of their
effectiveness.
Ceramics:
Effective at reducing bacteria count
Not effective against water born viruses
Hairline cracks tend to form if over pressurized, compromising the filters effectiveness
Solar Disinfection:
Kills up to 98% of pathogenic bacteria
Only effective with full sunlight and type one plastic containers
Vacuum Distillation/Boiling
Effective for removing dissolved salts and larger particles
Inconclusive evidence that vacuum pressure has any effect on bacteria/viruses
Inconclusive evidence that bacteria/viruses are separated from water during evaporation
Too energy intensive to be viable for human power
Chlorine
Residual disinfection properties, unlike UV sterilization
Not instantly effective
Chlorine has to be dispensed properly, failure to do so can cause illness
Dalhousie University
Dept. of Mechanical Eng.
Page 87 of 102
MECH 4020
Team #15
Human Powered Water Purification System
Winter Term – Final Report
Activated Carbon
Good for organic compound and chlorine removal
Cannot be used for sterilization
Carbon filters must be flushed before use
Carbon filters permit bacterial growth
Slow-Sand Filtration
Removes up to 99% coliform from influent water
Found to remove certain viruses
Sand must be prewashed in a controlled process before it can be layered in the filter
Cannot filter highly turbid water
After discussing all of the above types of filtration that were researched, it was determined that
slow sand filtration would be the best solution was applicable. However, it was found that no one
method of filtration could handle highly turbid water. For the case where water is highly turbid,
some sort of pre-filter/coagulation method would need to be employed for each filtration method
considered.
Friday, October 26th, 2012
The possibility of designing a commercial filtration unit (one using commercially attained filters)
alongside the slow sand filtration system was discussed. It was found that the best method to treat
water was the slow-sand method. However the actual mechanical design component was somewhat
limited without adding unnecessary complicated systems to the slow-sand filtration.
Wednesday, October 31st, 2012
It was determined that the use of a chemical post/pre-treatment would be too expensive for the
situation being addressed, which is supplying water to impoverished people. It was also suggested
by Dr. Gagnon that the design be site specific to best serve the needs requirements of the situation.
Dalhousie University
Dept. of Mechanical Eng.
Page 88 of 102
MECH 4020
Team #15
Human Powered Water Purification System
Winter Term – Final Report
Friday, November 2nd, 2012
A site specific design was chosen utilizing the best method to address the sites requirements. A
rural northern community’s fresh water reservoir was contaminated by an influx of basin sea
water. This phenomenon was described to be a rare event, however, without a local freshwater
source, villagers were forced to travel over ten kilometers by snowmobile to haul water for daily
use. Because the reservoir was a large still body, it was considered low turbidity, brackish water.
For this site, it was calculated to be theoretically possible to meet the prescribed design
requirements using a human powered reverse osmosis system.
Friday, November 9th, 2012
Dr. Ugursal explained why using bound, dated, page numbered logbooks are so important, as they
may be used as evidence in a legal court case. Meeting was kept short, as there was a lot of system
design work to do.
November, 16th, 2012
Team updated the supervisor with the design progress, demonstrating that the direction chosen
was in fact feasible. The meeting was kept short because of the large amount of work yet to be
completed.
Friday, November 23rd, 2012
Team discussed the build report that was submitted earlier in the week. One suggestion made by
Dr. Ugursal was to consider building the frame out of wood, to further simplify the design for onsite construction. Also, the team discussed a potential testing schedule for the winter semester, and
seeking sponsorship from the membrane supplier to reduce the cost of the prototype. The following
weeks design presentation was also discussed, suggesting that it should be well rehearsed and not
last minute.
Dalhousie University
Dept. of Mechanical Eng.
Page 89 of 102
MECH 4020
Appendix F
Team #15
Human Powered Water Purification System
Winter Term – Final Report
Assembly/User Manual
Human Powered Water Purification System
Assembly/User Manual
Dalhousie University
Dept. of Mechanical Eng.
Page 90 of 102
MECH 4020
Team #15
Human Powered Water Purification System
Winter Term – Final Report
System Assembly
Before beginning assembly, ensure to lay out the components required to assemble the system by
checking with the following bill of materials. Before the assembly of the hydraulic system all male pipe
threads should be wound thrice clockwise using Teflon tape with the thread-end facing the user. This will
help speed assembly and ensure that all fittings seal properly when being threaded into place.
Part Name/Subgroup
Part Quantity
Fasteners
Main Hydraulic Components
3/8 OD Nylon hose
35”
Bolt – 3/8” X 3.5”
2
P.S.V.
1
Washer – 3/8” STD
4
Carbon/Ultra housing filter kit
2
Washer – 3/8” Fender
4
Sediment filter kit
1
Washer – 3/8” Locking
2
R.O. membrane housing
2
Nut – 3/8”
2
100 GPD R.O. membrane
2
Bolt - 1/4” X 1”
5
3/8’ Needle Valve
1
Bolt - 1/4” X 1.5” UNC
4
70 GPH Procon Pump
1
Bolt – 1/4” X 1.5” UNF
2
Check valve
3
Bolt – 1/4” X 2.5”
2
Pressure Gauge
2
Bolt – 1/4” X 4.5”
2
3/8 Comp. Tees
6
Bolt – 1/4” X 5”
4
Nylon Pump Fittings
2
Washer – 1/4” STD
38
Suction Strainer
1
Washer – 1/4” Lock
19
3/4" x 1/2" sch40 bushing
4
Nut 1/4”
19
1.5” U-Bolt Kit*
4
2
3/8" comp x 1/2" MPT brass
fitting
2.5” U-Bolt Kit
4
1/8" NPTF Brass Comp. Fitting
6
6” Wire Ties
4
1/4” Nylon Comp Fitting (Male)
1
1/4” Nylon Comp Fitting
(Female)
1
1/2" NPTF Brass Comp. Fitting
(Male)
1
1/2" NPTF Brass Comp. Fitting
(Female)
3/8” Nylon Comp Fitting (Male)
1
Frame Components
Main post
1
Base cross piece
1
Main frame
1
Pump mount
1
Bicycle seat
1
Dalhousie University
Dept. of Mechanical Eng.
1
Page 91 of 102
MECH 4020
3/8” Nylon Comp Fitting
(Female)
Team #15
Human Powered Water Purification System
Winter Term – Final Report
1
Drive Train Components
#35 – Roller chain
10’
#35 – Master link
2
#35 – 10 tooth sprocket (5/8”
Bore)
1
#35 – 21 tooth sprocket (5/8”
Bore)
1
#35 – 45 tooth sprocket (5/8”
Bore)
#35 – 60 tooth sprocket (5/8”
Bore)
1
Bearings (5/8” Bore)
6
3/16” Key stock
1’
5/8 Keyed Shaft**
3
Left/Right hand pedals
2
Left/right hand crank arm
2
Crank assist bar
2
5/8” to 7/16” lovejoy coupler
1
Dalhousie University
Dept. of Mechanical Eng.
1
Page 92 of 102
MECH 4020
Team #15
Human Powered Water Purification System
Winter Term – Final Report
Frame Assembly
The frame assembly is designed to be assembled by one person alone. It consists of three main
components, the main post, main frame and base cross-piece. These components are shown below
(not to scale) in figure (38).
Figure 38
Left to right: Main Post, base cross-piece, main frame
Step 1: Begin by lining up holes in the base cross piece with the holes in the base of the main post.
With one flat washer fit onto each bolt, slide each bolt through its hole. With bolts inserted fit
another flat washer, followed by lock washer and nut to exposed threaded end of each bolt (Note:
Every “bolted” connection hence forth shall be made using this method).
Step 2: Line up the two bolt holes in the main frame with those in the cross piece and main post. As
shown below in figure (39). These connections are made using the two 3/8” 3.5” bolts.
Dalhousie University
Dept. of Mechanical Eng.
Page 93 of 102
MECH 4020
Team #15
Human Powered Water Purification System
Figure 39
Winter Term – Final Report
Main post and base cross-piece
Step 3: Next the seat is slid into the seat post, adjusted to rider height. The seat is then clamped in
place using the two 1.5” U-bolt kit to force close the adjustment notch. Ensure one U-bolt clamp
placed at the top of the adjustment notch, and one is approximately halfway down the notch. The
frame should now look like figure (40) shown below (shown without fasteners).
Figure 40
Dalhousie University
Dept. of Mechanical Eng.
Assembled frame
Page 94 of 102
MECH 4020
Team #15
Human Powered Water Purification System
Winter Term – Final Report
Drivetrain Assembly
Step 1: To assemble the drivetrain, firstly the six bearing must be pushed flush into their
housings (two per housing) until the outside of the bearing is flush with the housing shown
below in figure (41).
Step 2: Insert each shaft individually label crank, intermediate and pump into its respected
housing shown below in figure (41).
Step 3: Fit the crank and crank assist arm and the 45 tooth sprocket to pedal crank shaft with
keys as shown below in figure (41). Ensure that that the left and right crank shafts correspond to
the riders left and right. With the crank arms fitted to the shaft, tighten the left and right pedals
into their corresponding crank arms (Note that right is turned CW to tighten and left is turned
CCW). After these components are aligned with proper clearance, the set screw in the sprocket
and pinch bolts (1/4” 1.5” UNF) in the crank arms can be tightened to lock the assembly in
place.
Figure 41
Shaft/bearing placement (left), Crank pedal assembly (right)
Step 4: Similar to step three, the 21 tooth sprocket is mounted on the intermediate shaft such that
is will be driven by the 45 tooth sprocket on the crank pedal assembly, with the 60 tooth sprocket
mounted to drive the ten tooth pump shaft sprocket as shown below in figure (40). Do not tighten
the set screws to lock the gears to the keyway at this point.
Dalhousie University
Dept. of Mechanical Eng.
Page 95 of 102
MECH 4020
Team #15
Human Powered Water Purification System
Figure 42
Winter Term – Final Report
Full drivetrain (shown without chain)
Step 5: With the sprockets installed, the two drive chains can be installed. The master links that
connect the two ends of the chain require the spring clip be inserted into the groves on the master
link with a flat head type screw driver.
Step 6: Align all chain/sprockets such the chain runs smoothly when the pedals are rotated
slowly. With chain and sprockets aligned, tighten all of the set screws.
Step 7: Install the lovejoy coupler to both pump shafts and bolt the pump to the pump mount
using the three 1/4”X1” bolts. Note that the set screw on the pump side of the coupler MUST be
tightened on the flat surface of the shaft else the shaft may become damaged upon operation.
Step 8: RECHECK all bolted connections to ensure everything is tight (without deforming
material) and will not loosen because of drivetrain vibration. With everything tightened the
hydraulic system is now ready to be installed.
WARNING: Do NOT run pump at this stage. Dry running the pump at high speed will cause
damage.
Hydraulic Assembly
Before the assembly of the hydraulic system all male pipe threads should be wound thrice clockwise
using Teflon tape with the thread-end facing the user. This will help speed assembly and ensure that all
fittings seal properly when being threaded into place.
Dalhousie University
Dept. of Mechanical Eng.
Page 96 of 102
MECH 4020
Team #15
Human Powered Water Purification System
Figure 43
Winter Term – Final Report
Hydraulic circuit
Step one: After taping all of the hydraulic fittings to ensure proper thread sealing, thread the two
nylon 3/8 compression fittings into the Procon pump. Secondly measure two pieces of hose, one
long enough to reach the source tank and connected to the IN side of the pump, and the other long
enough to reach the pressure safety valve (PSV) that is mounted on the hydraulic circuit plate
shown on the front of the bike connected to the OUT side of the pump as shown in figure (44)
below. During this time the suction strainer and check valve can be attached to the suction line
shown in figure (44).
Figure 44
Dalhousie University
Dept. of Mechanical Eng.
Procon pump connection (Down = IN, Up = OUT)
Page 97 of 102
MECH 4020
Team #15
Human Powered Water Purification System
Winter Term – Final Report
Step 2: With the pump installed, the filters brackets can be mounted as shown below in figure (45).
At this step only mount the sediment filter to the bracket using the four self-tapping screws
included in the kit. Note: It is easier to thread all fittings (without tightening the compression
fittings) and adapters as shown before mounting the filters to the hydraulic plate. Then one by one
mount the carbon and ultra-filters and tighten the compression fittings.
Figure 45
Filter mount assembly (Left to right: Sediment, Carbon, Ultra)
Step 3: With the filters mounted the PSV and pressure gauge located between the sediment filter
and pump can be installed. The pressure safety valve not shown is plumbed off a tee from the main
line with its return line plumbed back to the source tank in case of system pressure relief. The
approximate assembly is shown below in figure (46)
Figure 46
Dalhousie University
Dept. of Mechanical Eng.
Pressure valve (not shown is the PSV)
Page 98 of 102
MECH 4020
Team #15
Human Powered Water Purification System
Winter Term – Final Report
WARNING: DO NOT UNDER ANY CIRCUMSTANCES SET PRESSURE SAFETY RELIEF VALVE HIGHER
THAN RATED 125 PSI! CATASTROPHIC FAILURE MAY RESULT IN SERIOUS INJURY AND
PREMATURE SYSTEM FAILURE!
Step 4: The last stage in the circuit is the reverse osmosis (RO) membranes/housings. Please refer
to manufacturer literature regarding proper membrane handling and installation. The RO housings
are bolted to the hydraulic panel via two 2.5” U-bolt as shown below in figure (47). The RO
concentrate lines are located on the left of each housing, and the permeate lines are shown on the
right in figure (47). Not shown are the tee’s and check valves installed on these lines to ensure the
system stays “flooded” when not in use.
WARNING: REFER TO MANUFACTUROR LITERATURE TO ENSURE CONCENTRATE PERMEATES
LINES ARE AS DESCRIBED. FAILURE TO DO
SO COULD RESULT IN SERIOUS ILLNESS!
Figure 47
Left: Reverse osmosis membrane housings
(not shown is 2nd RO pressure gauge attached to second tee). Right: Shown are RO concentrate lines
(left and tied together) and permeate lines (right)
Step 5: Install needle valve (recovery valve) into RO concentrate line as shown in figure (48)
below. Ensure concentrate line out of the recovery valve is long enough to return to an adequate
drainage point.
Dalhousie University
Dept. of Mechanical Eng.
Page 99 of 102
MECH 4020
Team #15
Human Powered Water Purification System
Figure 48
Winter Term – Final Report
System recovery valve
Initial System Priming/Flushing
The first time water is pumped though the system it is important to have the recovery valve set to
its FULL OPEN setting (turned counter clockwise until dial hits stop). This ensures that pressurized
air bubbles are not being forced across the R.O. membranes upon initial start-up that will result in
premature membrane failure.
WARNING: FAILURE TO ENSURE RECOVERY VALVE IS SET TO ITS FULL OPEN SETTING WILL
CAUSE PREMATURE MEMBRANE FAILURE!
It is recommended that water be run through the system for at least ten minutes to ensure all air is
evacuated. Before this system can be used to produce safe drinking water it is VERY important to
read the data attained with the individual filters regarding required system flush time. The time
required to flush the system may vary depending on filter/membrane manufacture. Water filtered
across the reverse osmosis filters during the flushing period MUST not be used for human
consumption.
System Operation
To ensure the longevity of the system, the following set of steps MUST be followed during start-up
shut-down procedures.
NOTE: WATER GREATER THAN 5000 PPM AND COLDER THAN 20 DEGREES CELCIOUS WILL
RESULT IN POOR SYSTEM PERFORMANCE AND LOWER THAT DESIRED FILTRATION RATES.
Step 1: Ensure recovery valve is set to open position.
Step 2: Ensure strainer and pressure relief lines are located in source water container, with the
concentrate line being drained, and permeate line being collected as drinking water. Build pedal
speed slowly to between 90-110 RPM (90 RPM = 1.5 revolutions of the pedal crank per second).
Dalhousie University
Dept. of Mechanical Eng.
Page 100 of 102
MECH 4020
Team #15
Human Powered Water Purification System
Winter Term – Final Report
Step 3: Flood system with water for ten minutes or until air bubbles are no longer visible to the
rider in the concentrate line. (If system has been flooded skip to step 4)
Step 4: Slowly RO pressure to 110 PSI by closing the recovery valve mounted on the handle bars
and monitoring the 2nd pressure gauge (left of the rider). It is important to keep a constant pedal
speed while this is done because system pressure depends on pedal speed.
Step 5: Continue pedalling until desired amount of permeate water has been collected. Reduce
system pressure to 0 PSI and then stop pedalling.
The system is designed to
WARNING: FAILURE TO SUSTAIN MINUMUM PEDAL SPEED WILL RESULT IN PREMATURE PUMP
FAILURE!
Dalhousie University
Dept. of Mechanical Eng.
Page 101 of 102
MECH 4020
Team #15
Human Powered Water Purification System
Winter Term – Final Report
Appendix G CAD Drawings
Dalhousie University
Dept. of Mechanical Eng.
Page 102 of 102