1
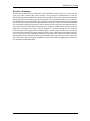
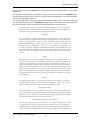
FP7-318225 D6.2 Implementation of Scenarios, Validation and Assessment Report Lead Partner: Fraunhofer, UoA Contributing Partners: IBM, TUD, Technion, DCC, BBK Status: Final Scheduled Delivery Date: 31/08/2015 INSIGHT FP7-318225 Executive Summary This document describes the evaluation of the INSIGHT system in the two real-word use cases (city-wide, nation-wide) and scenarios. Two prototypes (instantiations of the INSIGHT system) based on different requirements and data sources were launched and tested during real exercises at Dublin City Council (DCC) and at the Federal Office of Civil Protection and Disaster Assistance (BBK). The evaluation involved field professionals and training personnel and was operated as an implementation of the two scenarios. Extensive feedback was collected during the preparation of the evaluation and conclusively through a questionnaire and interviews with key participants (DCC employees, BBK officers). The evaluation helped the consortium not only to test the system in a realistic setting but also improve various aspects of the system and its methodologies. A wide range of criteria were recorded, discussed and considered for improving the system. Close collaboration throughout the process was necessary and supported many direct uptakes and continuous improvements. Functionality (how useful the system is) and Usability (how easy the system is to use) were the main points of this evaluation. INSIGHT in terms of the underlying Big Data architecture is evaluated in Deliverable D2.3. D7.2, Version 1.0, 31/08/2015 INSIGHT FP7-318225 Document Information Contract Number FP7-318225 Acronym INSIGHT Intelligent Synthesis and Real-time Response using Massive Streaming Full title of Heterogeneous Data Project URL http://www.insight-ict.eu/ EU Project officer Ms Alina Lupu Deliverable Num 6.2 Work package Num WP6 Date of delivery 31/08/2015 Status Final Nature Report Distribution Type Public Authoring Partner Fraunhofer, UoA QA Partner UoA Contact Person Name Implementation of Scenarios, Validation, and Assessment Report M36 Actual 16/09/2015 Hendrik Stange Ioannis Katakis Sylvia Steenhoek Stephen Lynch Email Dimitrios Gunopulos [email protected] Phone [email protected] [email protected] [email protected] [email protected] D7.2, Version 1.0, 31/08/2015 INSIGHT FP7-318225 D7.2, Version 1.0, 31/08/2015 INSIGHT FP7-318225 Table of Contents 1 Introduction and Objectives .................................................................................................................. 1 2 Part A - City Wide (Dublin City Council) ........................................................................................... 1 3 4 5 2.1 Evaluation Protocol ........................................................................................................................... 1 2.2 Functionality ........................................................................................................................................ 3 2.2.1 Overall INSIGHT benefits to DCC ..................................................................................... 3 2.2.2 Twitter Event Detection ...................................................................................................... 5 2.2.3 BUS Anomaly Detection ...................................................................................................... 5 2.2.4 SCATS Anomaly Detection ................................................................................................. 6 2.2.5 Round Table Events .............................................................................................................. 7 2.2.6 CrowdAlert ............................................................................................................................... 7 2.3 Usability ................................................................................................................................................. 9 2.4 Conclusions ......................................................................................................................................... 10 Part B - Nation Wide Use Case (BBK/AKNZ) ................................................................................ 11 3.1 The AKNZ............................................................................................................................................. 12 3.2 Testing Framework at the AKNZ ............................................................................................... 12 3.3 Evaluation Setup............................................................................................................................... 13 3.4 Scenario ................................................................................................................................................ 14 3.5 Scenario data...................................................................................................................................... 17 3.6 Implementation ................................................................................................................................ 18 3.7 Feedback collection and evaluation results .......................................................................... 20 3.7.1 Evaluation Results ............................................................................................................... 20 3.7.2 Usage and Usability Evaluation...................................................................................... 21 3.7.3 Feedback Collection ............................................................................................................ 22 3.8 Hypotheses Testing ......................................................................................................................... 23 3.9 Conclusions ......................................................................................................................................... 24 APPENDIX A – City Case Questionnaire ............................................................................................ 1 4.1 Goals of the Evaluation .................................................................................................................... 1 4.2 Evaluation Period ............................................................................................................................... 1 4.3 Evaluation of the Twitter ISA ........................................................................................................ 1 4.4 Evaluation of the BUS ISA ............................................................................................................... 1 4.5 Evaluation of the SCATS ISA .......................................................................................................... 3 4.6 Evaluation of the Crowdsourcing Component ....................................................................... 5 4.7 User Interface and Visualization .................................................................................................. 7 4.8 Overall Evaluation of the System ................................................................................................. 8 Appendix B – Nation Wide Case – Questionnaire ......................................................................... 9 D7.2, Version 1.0, 31/08/2015 INSIGHT FP7-318225 D7.2, Version 1.0, 31/08/2015 INSIGHT FP7-318225 1 Introduction and Objectives The goal of the INSIGHT project is to radically advance our ability of coping with emergency situations by developing innovative technologies, and systems that will put new capabilities in the hands on disaster planners and city personnel to improve emergency planning and response. During the three years of the project, the consortium developed a number of methodologies for anomaly detection, event identification, traffic estimation and prediction, etc. These applications involve the effective and efficient analysis of data streams coming from different sources: SCATS sensors, BUS GPS traces, and even social media (Twitter). All these techniques are presented in published papers that can be found in conference proceedings or as journal articles. For a full list of publications please see D7.2. We have provided summaries of those research efforts in deliverables D3.1, D3.2, D3.3, D4.1, D4.2 organized in Work Packages and Tasks. Some of the above methodologies were implemented in INSIGHT’s Intelligent Sensor Agents (ISAs). The ISAs have a data mining / machine learning core but had to be trained and tuned on real DCC data and for the tasks that DCC was interested in. For more details on the data and requirements of this use case please see Deliverable D5.1. D5.2 provides information on how these technologies were adopted into the INSIGHT ISAs. 2 Part A - City Wide (Dublin City Council) In the DCC use case, personnel in the Traffic Management Centre were requested to evaluate the INSIGHT system to ascertain if the system could assist them in their everyday tasks. The Traffic Management Centre (TMC) were eager to test the system as the opportunity to improve reaction times to events and to increase the amount of automated alerts was welcomed. The overall reaction to the INSIGHT system was a positive one. Objectives. The purpose of the evaluation is to test the INSIGHT system in real circumstances and evaluate all of its crucial elements: 1. The three ISAs (Twitter, Bus, SCATs) 2. The mobile application (CrowdAlert) 3. Event detection capabilities 4. Visualization / Interface 5. Other secondary features (e.g. plots of historical data). The evaluation was set up in such way that we evaluate the above features in terms of: a) functionality and b) usability. Simply put, functionality relates to how the INSIGHT system aids DCC employees achieving more than when using their conventional workflow. Usability relates to how easy to use and intuitive the system was. Note that the majority (95%) of participants were not familiar with the system. A Training Step preceded the evaluation by providing the participants a user guide and a set of video tutorials. 2.1 Evaluation Protocol Relevant DCC personnel were invited to participate in the evaluation of the INSIGHT system. Using the Traffic Management Centre and the adjoining Local Incident Room as a central hub allowed staff to evaluate the system all together, seeking clarification by asking questions and attending to concerns that may have arisen. The evaluation was operated in two 2 hour time windows steps and in two different days. The time windows were: ❏ Day 1; 08.00 - 10.00, 16.00 - 18.00 and D6.2, Version 1.0, 31/08/2015 1 INSIGHT FP7-318225 ❏ Day2; 09.00-11.00, 15.00 - 17.00. These are typically periods of high volume of traffic in Dublin. In those time windows people involved in the evaluation were invited to utilize the system and complete a number of tasks. In each time window, participants were organized in groups based on their role in the department and completed only a part of the evaluation. For example people from the Traffic Management Centre Team worked on SCATS related events. Participants from the Bus Priority Team evaluated the bus ISA and Live-Bus layer of the system while the radio station monitored social media. The following personnel were invited to participate in the evaluation of the system in the TMC: ❏ Traffic Management Personnel (12) ❏ LiveDrive Radio Station (5) ❏ Traffic ITS Officers (10) The following were invited to download and use the CrowdAlert application. ❏ General Environment & Transportation Personnel (229), via departmental e-mail group ❏ IT Department Personnel (100), via departmental e-mail group ❏ General Public, via LiveDrive radio program (LiveDrive traffic programme had an independent survey commissioned with over 81000 listeners tuned in the Dublin Metropolitan Area), Twitter (13.9K followers) & blog post ❏ DubLinked, via Twitter and and website ❏ Other - LinkedIn posts, tweets and re-tweets Figure 1. DCC participants during the INSIGHT evaluation Figure 2. The INSIGHT system during the evaluation D6.2, Version 1.0, 31/08/2015 2 INSIGHT FP7-318225 A user manual was created to assist users using the INSIGHT system. The manual can found here: http://insight-ict.eu/CrowdAlertApp.pdf The INSIGHT System has also its own manual: http://insight-ict.eu/user_guide.pdf Dublin City Council also produced a video series to assist the Traffic Management Centre in using the different features available in the INSIGHT system. These videos can be viewed on our INSIGHT Youtube Channel: https://www.youtube.com/channel/UCORvM9dn5fz6ZQoEtg-gIzg Figure 3. INSIGHT’S youtube channel We suggested the personnel involved in the evaluation to either watch the videos or read the INSIGHT user guide. Most users stated that they could understand the main features of INSIGHT faster by watching the video instead of reading the manual. The consortium intends to use the videos as a dissemination and an education tool. After the completion of the evaluation process, the participants were asked to answer the questionnaire presented in Appendix A. 2.2 Functionality In this section we provide the evaluation of INSIGHT main capabilities. More specifically we investigate how helpful and effective these features are in: a) DCC’s workflow, b) Dublin’s citizens. 2.2.1 Overall INSIGHT benefits to DCC The following table provides an overview of what the INSIGHT system offers to the personnel of Dublin City Council and the citizens of Dublin. More specifically, we provide information on how some certain tasks are being accomplished in DCC and then compare it with the corresponding INSIGHT functionality and what advantages this offers to the people of DCC. D6.2, Version 1.0, 31/08/2015 3 INSIGHT FP7-318225 Table 1. Advantages of INSIGHT integration into DCC's workflow Functionality Conventional Approach INSIGHT Approach INSIGHT advantage Identify Traffic Incidents in the Streets of Dublin Using primarily CCTV & SCATS, TMC operators actively seek areas requiring intervention. It is quite a manually intensive task DCC’s personnel are automatically notified through the INSIGHT interface. A ‘Traffic Alert’ is raised when INSIGHT identifies abnormal traffic behaviour in the area. Using INSIGHT DCC personnel identifies traffic incidents faster. In addition, DCC can identify events that could not identify with conventional means. Recognize individual congested sensors SCATS data needs to be manually checked at each junction INSIGHT detects congested detectors and automatically plots them on a map Automated visual alert on map, quickly showing operators where congestion is occurring Identify Buses Overall congestion is that are monitored on CCTV with delayed no specific focus on buses INSIGHT detects delayed buses and plots them on a map in near real time INSIGHT visually alerts the TMC to areas of congestion that are impacting public transport Be informed about floods The TMC use public information regarding weather alerts and have limited access to flood reports INSIGHT detects flood events using social media feeds and plots their location on a map INSIGHT visually alerts the TMC to flood related events that the would not normally have a view of Be informed about fires The TMC would not actively monitor alerts for fire events INSIGHT detects fire events using social media feeds and plots their location on a map INSIGHT visually alerts the TMC to fire related events that they would not normally have a view of Citizen inform the city about any type of emergency Citizens can call emergency services, TMC, AA Roadwatch, LiveDrive as well as tweeting and email Citizens can report an event directly from their phone by using the CrowdAlert app Incidents reported by citizens using the CrowdAlert app are displayed on a map in the TMC. Citizens are informed about any type of emergency DCC inform citizens about emergency events through Twitter, radio station, AA roadwatch & DCC website INSIGHT detects an emergency event and seeks further information through the CrowdAlert app This feature complements the existing methods as well as contributing to knowledge discovery by interacting directly with citizens D6.2, Version 1.0, 31/08/2015 4 INSIGHT FP7-318225 2.2.2 Twitter Event Detection The Twitter event detection has been an excellent feature to INSIGHT. With some additional negative keyword lists, such as counties outside of the Greater Dublin Area,(e.g. Cork, Limerick, Galway), the relevancy of the alerts will be more accurate. The partner responsible for the Twitter ISA for the DCC case implemented this ‘black-list’ feature as a filtering step. The DCC team examined independently a complete list of Tweets that the INSIGHT Twitter ISA identified as problematic (Traffic related or Flood or Fire related). Table 2. Information on the accuracy of the Twitter ISA. Number of Tweets identified as Relevant 179 % of Confirmed Tweets with Relevant Text 91% (163 tweets) % of Confirmed Tweets with Relevant Text and Useful Location (in or near Dublin) 63% (113 tweets) Examples. Some examples of Tweets that were identified correctly during the evaluation period are the following: ❖ 10:58 - Did you know y'all flooded Palmerston Road with ya shifty workmanship. ❖ 15:01 - It’s in the fast lane. Fire brigade & ambulance on the way towards it. Just passed incident. Condition are poor & wet” ❖ 15:12 - There is debris on the M11 Dublin/Wexford Rd southbound between J14 Coyne’s Cross and J15 Glendalough blocking the left pane.” ❖ 16:20 - Car smashed the barrier southbound n11. Large tailbacks, down to 1 lane only” ❖ 16:23 - Long delays on N5 between Wesport & Castlebar in Mayo. Car accident. Emergency services at scene. ❖ 16:27 - hugh I turned right just after St Peters church and then left and kept going straight and very little traffic. ❖ 16:34 - bad news, very very very very heavy traffic ❖ 16:42 - Sorry folks, I'm late to the #rosannadavison party. Held up in traffic. There was a gluten spillage at the Port Tunnel. ❖ 17:06 - Traffic is gridlocked on Howth Rd, Malahide Rd & Clontarf Rd - better off staying at work a bit longer #Dublin #traffic Of course there were cases that the Twitter ISA misclassified some tweets: 16:18 - Dad just told me to go and play with the traffic? :-) 2.2.3 BUS Anomaly Detection The Bus Anomaly Detection proved useful in giving users information related to bus anomalies. It proved more difficult to confirm anomalies using CCTV as by the time users tried to confirm the anomaly, the time may have lapsed in some cases, so verifying these anomalies was more difficult that the other anomalies. The information given with each bus anomaly was very useful in trying to isolate the location of the anomaly in particular the link view the bus stops, as this allows the user to know the direction of the bus and the current and next stop due. Generally users found using the Live-Bus layer to assist with the bus anomaly layer helped to understand if there was issues of congestion occurring in a certain area of the city. D6.2, Version 1.0, 31/08/2015 5 INSIGHT FP7-318225 Examples. An event occurred during the evaluation, is displayed in the following figure. The participants confirmed the correctness of information displayed by INSIGHT. In addition, they mentioned that INSIGHT is easier to operate, manage and can aid in combining information sources. Figure 4. Comparison of the Dublin Bus System (left) with INSIGHT (right). INSIGHT advantages are that: a) it displays information on an easy to use map, b) presents only relevant information (delayed buses), c) the user can easily investigate information related to the particular bus and print plots of bus history, c) users can adjust the system as needed by tuning parameters, d) it is able to present multiple layers of information, e) it can be accessed from multiple and remote locations. 2.2.4 SCATS Anomaly Detection The SCATS anomaly detection proved very useful in allowing users to detect singular anomalies related to a junction. The anomaly detection alerts from INSIGHT indicated individual lanes that had a high degree of saturation, which would not be immediately apparent using the SCATS system. Being able to use the INSIGHT map along with SCATS and CCTV proved useful to diagnose and confirm anomalies occurred at the location highlighted by the INSIGHT anomaly layer. Examples. A traffic incident occurred during the evaluation. The DublinService announced the incident as follows: Expect Delays & Diversions to routes 46A, 63 & 75 due to an incident on York Road, Dun Laoghaire. See www.dublinbus.ie for updates. INSIGHT identified the event on the Live Bus and the Live SCATS layer as seen in the following Figures. Once the notification was received from Dublin Bus, it was clear on INSIGHT that there was traffic issues experienced on York Road, with the Live-SCATS anomalies and then roads around York Road having alerts for Liver-Bus due to the diversions put in place. D6.2, Version 1.0, 31/08/2015 6 INSIGHT FP7-318225 Figure 5. Live SCATS and Live Bus reporting on the same incident. 2.2.5 Round Table Events The degree of saturation (DS) threshold for SCATS alerts may need to be raised. While events being raised by the system are correct and there is a higher than normal DS, the congestion is below the threshold that would require intervention by traffic control operators in the TMC. DCC talked to the responsible partners and decided to increase the corresponding threshold. 2.2.6 CrowdAlert The crowdsourcing application was very easy to use. The buttons make it very easy to report an event and view it immediately on the map display. With relation to users replying to alerts, it was felt that more clarity was needed over exact location of events or more clarity on the questions being asked of users. Due to the way the Insight system is designed, it aggregates several events in adjacent geographic locations to issue crowdsourcing tasks and as a result CrowdAlert receives the approximate location of the greater area where the events take place rather than their exact location. We are working toward supplying the exact location of the events when propagating questions to the users. CrowdAlert has been downloaded and is currently actively being utilized by 64 individual users since it has been uploaded on Google Play and by 46 users since it went public to Google Play. In the following figures we present several statistics about the number of users actively using the app as well as information related to the Android versions they use and their devices. As can be observed all users have an Android version higher than 4.0 (which is the minimum required version for the app) and the majority of the users (more than 55%) have Android 5.0 or higher. Figure 6. Active Devices D6.2, Version 1.0, 31/08/2015 7 INSIGHT FP7-318225 Figure 7. Installs by Android Version Figure 8. Installs by device Users had the chance to use, test and rate our application. Although only 4 users have provided feedback for the app they have given us a 5 star rating! Figure: App Ratings at Google Store We also present results related to the Crowdsourcing tasks that have been sent to the users. The following figures illustrate the location of the users that have provided responses to different tasks and we also present the corresponding answers. As can be observed users from all over Dublin are using CrowdAlert and have provided responses to tasks and as the figures illustrate users participate especially from suburbs where no other sensors exist. Moreover, 41.9% of the questions issued by CrowdAlert regarding an event have been validated and 47.4% have been rejected. Such a small difference is due to events that are difficult to be confidently captured without relying on the human factor. D6.2, Version 1.0, 31/08/2015 8 INSIGHT FP7-318225 Figure 9. Geographical distribution of responses and percentage of validated events Finally we present the location as well as the type of reports that have been retrieved from the users. Users mostly report either Traffic events or provide us with feedback that there is no ongoing event at that point. Figure 10. Users’ geographical distribution and type of reported events 2.3 Usability Overall users found the system and application user-friendly and easy to navigate. Refresh rate of the page was generally viewed as a smooth experience. Users did not find the map overloaded with icons, as the tabs are easy to turn on/off as per user requirements. The following figure presents a summary of the user answers to the questions related to the usability evaluation. The “yes” answer was always the positive answer. The questionnaire included 10 questions related to usability that the reader can find in Appendix A. Figure 11. 10 usability attributes were evaluated (V1-V10). Percentage of yeses is actually the percentage of users that were happy with that feature. For all attributes that the results were not good, the consortium took corrective actions. D6.2, Version 1.0, 31/08/2015 9 INSIGHT FP7-318225 Some indicative comments (positive and negative) are the following: ❖ Yes it’s easy to navigate inside the map the pan and zoom in and out is very useful and makes navigation easy. ❖ I find the refresh rate better in Chrome (44.0.2403.155 m) than in IE 11 ❖ No, i had to change to zoom level on the browser, to see the layers clearly so they don’t overlap, but then if i need to see something clearly I need to increase the zoom level again to read text ❖ Yes, but by default, it has a dash (-) on the ID fields, so, if you are searching, you would always have to delete this. 2.4 Conclusions In general this feedback loop was very useful since INSIGHT was tested in real circumstances. The participants were very happy with the system and the mobile application. They declared that INSIGHT is a very useful asset and that it would help improving their workflow. The consortium received many comments and took actions in order to fix all issues, inconsistencies, and bugs. D6.2, Version 1.0, 31/08/2015 10 INSIGHT FP7-318225 3 Part B - Nation Wide Use Case (BBK/AKNZ) The second part of the INSIGHT testing scheme aims to evaluate the nation-wide usability and demonstrate the scalability of the INSIGHT system towards nation-wide emergency situations. During the past 3 years the BBK as one of the two end users provided continuous input and valuable guidelines for adjusting the system for the needs of professionals in the case of large scale emergencies. This includes detection and data visualization as well as many usability features. The main challenges in testing the second use case are twofold: Plannability - it would require an emergency situation of nation-wide magnitude Liability – the staff of the BBK has to react upon risks and individual threats and public needs as soon as they become known. As this is possible for lower level events like accidents or traffic jams it is relatively hard to do for emergencies affecting more than 100.000 people at the same time. To account for these challenges and to broaden the scope of the testing under controlled conditions as well as to structure the evaluation of INSIGHT the decision was made to involve the central educational institution of the federal state (AKNZ) for disaster management in Germany. The INSIGHT project was granted to get evaluated during the international summer academy of the BBK. The summer academy is a world-wide renowned training event and expert exchange on international level. A key success measure is that all international professionals operate under most realistic circumstances. The BBK takes the greatest efforts to make the trainings and exercises as close to reality as possible. Objectives. The purpose of the implementation and evaluation phase is to put the INSIGHT system into operation and evaluate all of its crucial functionalities: 1. Data stream processing and analysis (ISA: Twitter, Mobile Phone) 2. Crowdsourcing functions (closed group approach) 3. Event recognition capabilities 4. Information provisioning 5. Operating the system The evaluation was set up in such way that we evaluate the objectives mentioned with respect to: a) functionality and b) usability and c) transferability. Functionality relates to the systems capabilities and that the system works as designed this includes the main goal of INSIGHT to put professionals during disasters on top of the situation. Usability refers to the fact that the system must be usable by professionals in order to unfold the benefits of the INSIGHT project. Transferability to other scenarios and adoption by professionals is a success measure of the project. The prototype was assessed by the target group in terms of testing three hypotheses: 1. Participants used the prototype during the entire exercise 2. Participants utilized the information given by INSIGHT 3. Participants became earlier aware of the situation because of INSIGHT The target group are professionals and participants who have not been familiar with the system and without prior knowledge on the system’s capabilities. Our intention is to simulate real world conditions under which the BBK operates. Here, the professionals working in the situation room are typically delegated from other positions to temporarily work for the GMLZ. This imposed additional challenges during the implementation phase of INSIGHT to make the system even more intuitively usable. D6.2, Version 1.0, 31/08/2015 11 INSIGHT FP7-318225 The following sections introduce the AKNZ and describe the testing scenario development and evaluation during the summer academy in detail. 3.1 The AKNZ The AKNZ is the central educational institution of the federal state regarding risk and crisis management, and civil protection. The Federal Ministry of the Interior has commissioned it to develop itself further into an educational institution for civil safety precaution with a national and international network, within the framework of a strategic educational alliance. The duties of the AKNZ include: Education and training for civil protection executives and teachers and for staff involved in matters of civil safety precaution Seminars, exercises and other events in the interest of the country’s overall crisis management and of civil-military cooperation Training events on behalf of the federal ministry Operation of a virtual learning platform Evaluation of mass casualty incidents at home and abroad Evaluation of national and international analyses, publications and documentations Making available scientific support for research projects as well as the evaluation and implementation thereof Conduction of studies and investigations Contributing towards the policy developments of the responsible top executive portfolio holders in the federal authorities; assistance in federal and regional government commissions, as well as in EU committees Topics of the education and training include: Civil safety precaution as an objective in the overall interest of the country Crisis management in the overall interest of the country (administration and economy in particular) Communication in the event of risk and crisis Leadership and staff training Risk analysis, risk management Disaster medicine, health care Self-protection, self-help Civil-military cooperation Provision and safeguarding in areas of critical infrastructure - Economy/business - Energy supply - Transport - Communications - Food - Water supply Crisis management/disaster relief on an international level (EU, NATO, UN) 3.2 Testing Framework at the AKNZ Learning how to manage emergency situations in digital societies requires special training facilities and experts with particular expertise. The AKNZ as Germany’s primary training and education center in civil protection and disaster management offers the facilities, staff and equipment for most realistic table-top exercises. This provides an ideal physical framework for the evaluation of the INSIGHT prototype. D6.2, Version 1.0, 31/08/2015 12 INSIGHT FP7-318225 Experienced scenario architects at the AKNZ supported the INSIGHT staff in designing and building a realistic test scenario. It was a novelty to design a fully data-driven table-top exercise that suit the requirements of the AKNZ: Operability = a scenario must be feasible and actable Consistency = a scenario must be logically linked and complete Flexibility = a scenario must allow individual adaptation during the exercise to reflect decisions taken Relevance = a scenario must be relevant in terms of the overall goal The unique setup needed for the evaluation of INSIGHT had to fulfill all these requirements. Therefore, the INSIGHT toolset had been greatly extended by an administration area that offered additional steering capabilities and monitoring functions. The AKNZ organizes the annual Summer Academy. During the summer academy highly experienced experts in the field of disaster management, recovery and safety meet at the AKNZ for expert exchange and international training seminars. Professionals and participants from around the world apply for participation in this two-week event. The attendees participating at the BBK Summer Academy have a background in civil protection and disaster management. Part of the summer academy are two main table-top exercises that last 1 to 2 days. The INSIGHT prototype was deployed at the second table-top exercise. The INSIGHT system was embedded into the control room as well as the situation room. The existing information technology and communication environment of the exercise rooms enabled a highly control testing environment. Passive feedback was received via camera observation and monitoring by experts. 3.3 Evaluation Setup The prototype was tested and evaluated on July 30th during the BBK Summer Academy at the Academy for Crisis Management, Emergency Planning and Civil Protection (AKNZ). The test took place during a table-top exercise as part of the international summer academy 2015. In close collaboration with the organizing experts of the academy and scenario experts the decision was made to run an extreme weather combined with a blackout scenario as the main emergency combined with lower level events (e.g. car accident). Our intention was that the participants would learn how to manage the consequences of a large scale blackout under severe conditions using novel information sources for situation awareness and decision support including mobile network sensor data as new source of overview data, social media and crowdsourced data. The target area was set to a large metropole in a densely populated area. A city that fulfilled the expert requirements was Duisburg. Prerequisite for selecting the blackout scenario in Duisburg has been the availability of real-world data. Therefore, Twitter as well as mobile network sensor data had been analyzed to record blackouts in Germany since the start of the project in 2012. To prepare the evaluation, the prototype was introduced during a lecture in advance of the exercise. The lecture included live demonstrations of the system as well as a thorough introduction to digitalization in disaster response. The general setup of the evaluation is depicted in Figure 12. The participants were split into two groups of 15 members. This parallel setup was chosen to ensure a maximum of reliability and significance of the evaluation results. Each group setup has been an instance of the general setup consisting of a control staff of experts, participants, and INSIGHT staff members. Each group selected one or more persons who would be responsible to operate D6.2, Version 1.0, 31/08/2015 13 INSIGHT FP7-318225 the system. All selected participants were given an in-depth explanation about the functionalities of the prototype in order to prepare the evaluation exercise. Figure 13. General concept setup of the evaluation exercise Sensor data from mobile networks and social media was available to the INSIGHT prototype. No crowdsourced data was available. During the evaluation exercise, field experts in the control room overlooked the scenario and steered particular information as a cloud of experts via the crowdsourcing capacities of the INSIGHT system. They also analyzed the real data stream and steered additional information from other organizations in the field (e.g. police, fire brigades, rescue services) using the administration area of the INSIGHT system designed to assist exercises and the evaluation phase. In the crisis situation room the information officers were in charge of the INSIGHT system to collect, distribute and refine information on the blackout situation. In total the INSIGHT system run on six computers: one for each control room, one for each exercise room, and one for an INSIGHT member accompanying the exercise. During the exercise a staff of INSIGHT members (Fraunhofer, BBK) assisted all participants and ensured a smooth process. Additionally they collected first feedbacks and recorded important information on usage, usability and issues by observation. At the end of the exercise all participants were asked to re-assess and evaluate the exercise in general and information and communication aspects in particular. The persons who worked with the prototype additionally filled out an evaluation form which was accompanied by an interview. The evaluation scenario is described in the following section in more details. 3.4 Scenario INSIGHT required a fully data-driven emergency evaluation scenario. This is the first time such a scenario had been developed. The INSIGHT scenario build around a massive blackout scenario affecting large areas of Western Europe due to extreme weather conditions over Europe. In order to demonstrate the scalability of INSIGHT from traffic to large scale events the scenario experts from the AKNZ and INSIGHT members decided to establish a crisis response and management scenario around the city of Duisburg. 0.5M citizens live in Duisburg (as of 2012). The city of Duisburg had been selected because of its geographical location in the center of the Rhine Metropole region with almost 10 Million citizens. This ensured operability of the scenario. The participants took the role of the operations staff of the city Duisburg and had the following tasks: (1) Coordination of the work of the two TEL (operational command post); (2) Creation of a situation report; (3) Advise to the Lord Mayor; (4) Ensuring information about the situation to KGS/crisis staff; and (5) Processing the damage situation. This task- D6.2, Version 1.0, 31/08/2015 14 INSIGHT FP7-318225 driven setup ensured relevance as it illuminates the overall objectives for the crisis managers. The scenario was steered by the experts in the control room to ensure flexibility. The experts influenced the course of action of each scenario individually to the reactions taken by the crisis management group. In order to embed the scenario and logically link all following events a scenario storyboard was produced. This ensured consistency of the scenario as well as a clear orientation on the real world data. This included the following introduction to the scenario: For days, the whole of north and central Germany has been under the influence of a low pressure area, which brings wet and cold weather with occasional heavy precipitation and high wind speeds. Morocco On 11 November 2008, meteorological institutes issue more and more reports about occasional storms west of North Africa and across Morocco, which are expected to move in the direction of Western Europe. Meteorologists hardly notice that the storm increases in speed and intensity. On 12 November, it arrives in the Moroccan mainland at 115km/h. The City of Meknès (500,000 inhabitants) is mainly affected and must look after about 30,000 directly affected people, who live in the city centre and the surrounding area. The airport of Meknès is temporarily closed. Spain Meanwhile, storm “Mary”, classified as a hurricane, has reached the southeast coast of Spain. Its intensity has increased to wind speeds of 140 km/h. “Mary” is accompanied by heavy rain-fall, the temperature drops to 5 °C. Due to the weather condition, smaller brooks and rivers overflow the banks, some streets are flooded. In some areas, telecommunication systems and power supply fail. Above all, the cities of Granada, Alicante, Valencia and Barcelona are affected. The airports of Almeria, Murcia, Alicante, Valencia, Reus and Barcelona stop their air traffic indefinitely. Hundreds of flights are cancelled. France Hurricane “Mary” gains in intensity. On the border to France, it reaches a maximum speed of 155 km/h. Besides the damage, which has affected Spain, the hurricane massively damages the infrastructure. Belgium/Germany Via Belgium and Germany, “Mary” reaches the maximum speed of 170 km/h. First offshoots of the hurricane have reached the west of the Federal Republic of Germany. In Baden-Württemberg, Rhineland-Palatinate, Saarland and Hesse, massive storm losses occur. Development of the special situation French and Spanish airports stop their air traffic indefinitely, public transportation collapses. Among others, railway lines are damaged or blocked by uprooted trees and pylon. Due to the heavy precipitation, many city quarters are flooded, numerous roofs are unroofed, entire wood-land D6.2, Version 1.0, 31/08/2015 15 INSIGHT FP7-318225 destroyed. The airports of Cologne/Bonn, Dortmund, Düsseldorf, Münster/Osnabruck, Bremen, Hannover and Hamburg are closed indefinitely. Arriving international fights are diverted to the airports in the south and east of the country. The exercise starts when a severe storm hits Duisburg. Within 30 minutes there is an announcement that there is a blackout throughout the entire city and the mobile phone network is only partially functioning. This announcement is followed by an announcement about a car accident at the BAB 40 (Rhine-bridge) which causes a massive traffic jam blocking a major highway from and to Duisburg. Aside the blackout and traffic jam, the participants need to solve problems caused by collapsed trees, blocked streets, flooded areas, and blocked railway and subway stations. The scenario storyboard also contained a logically linked and temporally ordered list of events. Social and mobile network data has been selected from previous event to reflect the emergency situation. It is the task of the INSIGHT system to detect and visualized events that correspond to the described situation. The following list of situation events are an excerpt of the complete list of events. Time Source Content 131600 Krisenstab AUFTRAG Übernehmen Sie die im Zuge des Unwetters nötigen Gefahrenabwehrmaßnahmen als Einsatzleitung (Führungsstab) in der kreisfreien Stadt Duisburg. 131610 SWDU INFORMATION Nach Meldung von den Stadtwerken Duisburg besteht seit 15:55 Uhr ein Stromausfall im Duisburger Stadtgebiet. Das komplette Duisburger Stadtgebiet ist vom Stromausfall betroffen. Wie es zu dem Ausfall kommen konnte, wird zur Zeit intern ermittelt. 131618 Leitstelle LAGEMELDUNG Unfall BAB A40 nach Sturmschäden im Gerüst in der Baustelle auf der RHEINBRÜCKE, Vollsperrung der BAB 40 in Fahrtrichtung MOERS in Vorbereitung, Rückstau bisher 2 km. 131645 Leitstelle INFORMATION Alle städtischen Krankenhäuser melden die Aufnahme des Notstrombetriebes. Eingeschränkte Patientenaufnahme möglich, lediglich Kernbereiche sind voll funktionstüchtig. 131710 Leitstelle LAGEFORTSCHREIBUNG STROMAUSFALL Nach Rücksprache mit den Stadtwerken Duisburg besteht seit 15:45 Uhr nach Ausfall beider 220kV-Zuleitungen der RWE ein Stromausfall im gesamten Duisburger Stadtgebiet 131715 EA Süd LAGEERSTMELDUNG BAHN Information durch DB Betriebszentrale WEST: Rund 1300 gestrandete Fahrgäste am HBF DUISBURG. Auch Busbahnhof vor dem Duisburger HBF überfüllt. Unter den Fahrgästen viele ältere Mitbürger. 131730 Leitstelle NOTRUFMELDUNG DIALYSEZENTRUM WALSUM, Poststraße 13 (Aldenrade), kann die Behandlung durch den Stromausfall nicht mehr D6.2, Version 1.0, 31/08/2015 16 INSIGHT FP7-318225 aufrechterhalten. Notstrom für 1,5 Stunden sichergestellt, 12 Patienten unmittelbar betroffen, Transport ins Krankenhaus dringend erforderlich. 131812 EA Süd ANFORDERUNG Lokale Überschwemmung durch Starkniederschläge (Kanalisation+U-Bahn-Schächte) im Bereich U-Bahnhof KÖNIG-HEINRICH-PLATZ und STEINSCHE GASSE (Altstadt). Benötigen weitere Pumpen! 131817 Leitstelle LAGEMELDUNG Mobilfunknetzbetreiber melden einen Teilausfall der Mobilfunknetze seit 16.30 Uhr. Nach Wiederanfahren des Stroms könnte das Mobilfunknetz innerhalb von 2 Stunden wieder mit voller Kapazität betrieben werden. 131915 Leitstelle NOTRUFMELDUNG Unfall am Containerterminal (Hafen): Absturz eines Containers während Anliftvorgang eines Containerentladungskrans (ALTE RUHRORTER STR.). 131940 EA Süd LAGEFORTSCHREIBUNG BAB 40 Die Bergung an der Unfallstelle wird sich voraussichtlich um zwei Stunden verzögern und um ca. 00.00 Uhr abgeschlossen sein. Verkehr muss auf der BAB zurückgeführt werden. 132100 Leitstelle NOTRUFMELDUNG Brand in Rheinhausenhalle, Beethovenstrasse (RheinhausenMitte), Charity-Gala "Dolphin Care" betroffen. Anscheinend ist auch Schirmherr Dr. Bertrand, Luxemburgischer Botschafter in Deutschland, anwesend. 132145 Leitstelle INFORMATION Der Direktor Wolfram Ullrich der Universität Duisburg-Essen meldet, dass sich 600 Participanten an der Fakultät für Maschinenbau und Energietechnik (Lotharstr. 1-21, 47057 Duisburg) als freiwillige Helfer eingefunden haben. Diese stünden zur Hilfeleistung bereit. Er fragt an, ob und wo diese eingesetzt werden könnten. 132245 Emscher Gesellschaft LAGEMELDUNG POLDERGEBIET Die Lage im Poldergebiet hat sich dramatisch verschlimmert. Durch den Anstieg des Grundwasserspiegels und den anhaltenden Regen kann das Wasser kaum abfließen, erste Keller im Bereich Duisburg-Beeckerwerth sind vollgelaufen. 3.5 Scenario data Blackout. The Duisburg blackout starts in the south and rolls over the city to the north of Duisburg. The mobile network ISA detects anomalies within the mobile network data stream to detect unexpected drop outs or abnormal low activities for a given location, time and contextual information such as neighboring cells. The blackout starts in the south of Duisburg and reached the north. Car accident. The car accident on the BAB40 caused a traffic jam in western direction. All mobile network data used originated from traffic jams on BAB 40 (Autobahn). For traffic D6.2, Version 1.0, 31/08/2015 17 INSIGHT FP7-318225 jams the Mobile Network ISA provides the event “abnormal high activity” along the BAB40. Twitter message contain information about an accident and massive traffic jam are collected. Crowdsourcing. During such a disaster scenario digitally linked emergency personnel becomes an important source of information. Via crowdsourcing they are connected to the INSIGHT system to provide real-time insights into local situations. 3.6 Implementation Figure 14. The INSIGHT user interface (dashboard) for the second use case In this use case, the INSIGHT interface was created to visualize a huge amount of events. INSIGHT assists the operator to focus on the relevant subsample of events. There are three different navigation filters to select the relevant events: Map – visualized the events on a map using a dynamic clustering method which uses the zoom level to organize and cluster events, a heat map function colorized the affected area based on number and severity of events (see Figure 15) Timeline – shows the stream of events and the occurrence of relevant events including event details (see Figure 16) Ontology – uses the INSIGHT ontology to allow special filtering and organization of events e.g. into car accident and natural disaster events or blackout events (see Figure 17) Event list – holds all event information to provide as much information as possible to the human experts without overloading, detected events marked as critical (semantically enriched) are loaded into a special section of the event list, this allows to focus on relevant events Event details – hold information on a particular event, such as duration, severity, message text for social data, context Navigation – to assist jumping between places or searching for locations Layers – are preset map layers for streets, traffic (using google traffic information), events D6.2, Version 1.0, 31/08/2015 18 INSIGHT FP7-318225 Figure 15. Map. Zooming and shifting the map reduced (or expanded) the selected events. Figure 16. Timeline. Only events with a starting time inside the selected time range are shown. Figure 17. Ontology. Provides all possible types of an event. Only events of selected (highlighted) types are shown. D6.2, Version 1.0, 31/08/2015 19 INSIGHT FP7-318225 3.7 Feedback collection and evaluation results In the following the results and findings of the evaluation scenario are described. 3.7.1 Evaluation Results The nation-wide scenario has been evaluated in two independent groups. Both groups used the same INSIGHT system and blackout scenario. The system automatically detected relevant events based on mobile network sensor data and Tweet streams. The events have been assigned to one event type based on the event ontology. Additionally, it was possible to also integrate crowd sourced information. This included information from the external trusted organizations such as the experts from the control room or members of emergency services, police, and firefighters. The results with respect to functionality are: The goal was to detect relevant events during crisis situations early in advance and thereby put crisis managers in the position to pro-actively manage a situation. The event detection features of the ISA are well developed and work as designed but there is room for optimization. Especially events during emergencies that are locally focused and contained such as information from within hospitals or other cultural facilities are hard to detect based on public data. Automated alerting also works based on the severity level of events or the number of events in an area. There multiple ways to inform the user: heat map, highlighting events, adding to list of critical events, special icons. The results with respect to scalability are: The goal was to scale from local events such as car accidents and traffic jams to emergency situations affecting >100.000 people at the same time. With the Duisburg scenario local events (traffic jam) had been successfully integrated with large scale situations (blackout). Apparently, combining events on different scales does not negatively affect readability nor usability of the system. Key findings are: 1st finding: If INSIGHT is fully integrated into the information distribution channels the acceptance level of the entire system is greatly enhanced. This became evident as one group also used the INSIGHT system to also integrate external information (from police, health or emergency organizations, local authorities) into the system. Although this information did not directly come from mobile network or Twitter it indicated that having one central system for key information from public data streams and official information strengthens the relevance of the system and thereby increases the attention paid to the system in general. Interestingly, Group B was using the system intensively at the beginning until they realized that they did not receive all information via INSIGHT. Other information via fax, email or phone was initially ignored. The attention dropped significantly after this had been noticed and the focus went towards internal information sources. 2nd finding: The information aggregation by system is ideally for gaining a quick overview of the situation. But it is important to have digital or classical means to share this information. Having only a laptop is hindering the uptake of information by the entire group as it is not visible. Only one group decided for themselves to define an INSIGHT Operator and present the INSIGHT dashboard using a projector. INSIGHT was more accepted than expected by group A. D6.2, Version 1.0, 31/08/2015 20 INSIGHT FP7-318225 3rd finding: The capabilities to retrieve information from data streams produced by the public also encourages to send information back to the public. One group used the system as a channel to send information to the public via Twitter. They also used the crowdsourcing capabilities to coordinate the voluntaries by sending them designated messages and task descriptions. 4th finding: Group A installed an INSIGHT officer. Continuously monitoring the INSIGHT event stream enabled them to become aware of certain situations way before officially recognized. This allowed this group to react upon this knowledge and gain a temporal advantage. At the end Group A was way ahead in treating the scenario. In general: Both groups described INSIGHT as a very helpful tool. The Twitter ISA could provide lot of valuable real-time information. The evaluation shows that the benefits of INSIGHT are actively visible. Below, a summary of how the two groups utilized the INSIGHT platform is presented: Group A The group decided to use a projector and share the INSIGHT output on a wall in their control center. The group decided to assign its own INSIGHT operator. His task was to collect all provided information of the Insight Dashboard and present the result during the team conferences. The group used INSIGHT as a communication platform and provided multiple Tweet messages to inform the public over Twitter. Group B Initially, relied entirely on INSIGHT, strong loss of relevance because of missing internal information from data sources such as police, local authorities, situation managers Did not digital adapt all possibilities (did not use a projector) INSIGHT became a source of relevant information during team conferences aside from other sources of official information Was not used for early detection, because not all events have been marked as potentially dangerous (improvement for INSIGHT possible) 3.7.2 Usage and Usability Evaluation Another goal of the evaluation within the BBK Use Case was to examine the usability and acceptance of the INSIGHT system and of the graphical user interface - the INSIGHT user frontend. Both groups had the same technical equipment and received the same introduction and no training on the system. The simplistic design of the frontend allowed an easy navigation through the software. Both groups had no issues to directly work with the system. No assistance had been given during the exercise. The following usage/usability impacts have been monitored during the exercise: Group A INSIGHT was fully integrated into the control center/ steering room Designated system operator in the controlling center Additional critical events and Tweets were embedded during the training D6.2, Version 1.0, 31/08/2015 21 INSIGHT FP7-318225 No introduction or explanation of the INSIGHT system was given on the day of the exercise Group B INSIGHT only presents the ISA output No designated INSIGHT operator No additional events or Tweets were generated No introduction or explanation of INSIGHT was given on the day of the exercise 3.7.3 Feedback Collection After the eight hour training, an open discussion with both groups was initiated. Figure 18 shows the result of the discussion after the evaluation was finished. INSIGHT plays a major role in information management. Figure 19. Feedback on Information Management after the evaluation scenario was finished Some original statement of the participants, organized in groups, are given below. Group A - Twitter information used more than cell phones events Tweets were useful to prepare on future situations Using Twitter to inform the public was very helpful The Dashboard was useful to verify the information given by the administration board The Dashboard should fill multiple monitors, map is to small Location of events helpful to get an orientation within an unknown city Not clear when is event defined as critical It is necessary to have one operator for the Dashboard To many tweets Need more time to get comfortable with the Dashboard, some functions are not found Sometime we get the information from Insight faster than from our administration center “Insight Dashboard could be very helpful for any kind of disaster scenario!” “We need Social Media! It already exist!” Group B - We used the dashboard only at starting time, later very rare To less information on this complex tool It was easy to locate the events Too much information Grouping the tweets on content could be helpful If we had use the Dashboard more, maybe we found the dam break faster Twitter was very helpful A blackout is an inconvenient scenario for the Dashboard Sometimes we didn’t know how reliable is the information All information on one map is very helpful D6.2, Version 1.0, 31/08/2015 22 INSIGHT FP7-318225 3.8 Hypotheses Testing With regards to the questions raised at the beginning of this section, following the answers based on a consolidation of all feedbacks and observations made by the professional experts of the BBK as the experienced end user. H1. Participants used the prototype during the entire exercise This hypothesis tested positively. Both groups used the prototype as an information source during the entire exercise. However, in Group B only one participant monitored the prototype, where in Group A the prototype was visible on the wall in a way the whole group was able to see it. Furthermore, Group A used the prototype more at the beginning of the exercise than at the end of the exercise, but Group B explored the features of the prototype more during the exercise and even started to use the crowdsourcing function of the prototype. H2. Participants implemented the information given by the prototype This hypothesis tested positively. In both groups the information was used to inform the rest of the group and the chief of staff about the current situation. However, halfway Group B did not value the information as much as they used to do at the beginning of the exercise. Group A valued the information even more during the exercise and started to feed the prototype with their information by using the crowdsourcing function. H3. Participants became earlier aware of the situation because of the prototype This hypothesis tested positively. Group B got aware of a flooded area because of a tweet that popped up in the prototype; this awareness came before the official announcement. Unfortunately, this was the only situation where Group B got aware of the situation before the official announcement. Group A had a couple of situations where they got aware of the situation be-fore the official announcement, also because they used it more intensively than Group B. Figure 20. INSIGHT exercise at AKNZ Figure 21. INSIGHT interface on the big screen of the exercise room D6.2, Version 1.0, 31/08/2015 23 INSIGHT FP7-318225 3.9 Conclusions The feedback of the professional experts as well as the participants was very positive. They thought the INSIGHT system was very useful. They also said that scenario was not perfectly fitting the goal. The INSIGHT system fitted in the blackout scenario and showed that even during a blackout, it was still possible to gain information from tweets and mobile phone usage. Furthermore, all the hypotheses tested positively which means that it was possible to use the INSIGHT system during the whole evaluation process. It was possible for the participants to utilize the provided information and that the situational awareness of the participants increased. Like any other tool, the INSIGHT system requires some affinity to computers or more time. Integration of more data sources is crucial. Especially, more official channels. The tweets, however, they thought were very useful and resulted in the feeling that they became faster aware of a situation. In addition, they thought Twitter was useful for the Public Relations Section. The INSIGHT system has proven its scalability, functionality and operation in a real-world scenario. There is room for optimization (mobile network events annotation, event detection on unstructured data, etc.). D6.2, Version 1.0, 31/08/2015 24 INSIGHT FP7-318225 D6.2, Version 1.0, 31/08/2015 1 INSIGHT FP7-318225 4 APPENDIX A – City Case Questionnaire INSIGHT URL: http://195.134.71.40:8000/html/visualization/ CrowdAlert App: play.google.com/store/apps/details?id=gr.aueb.boutsis.crowdalert.app Note: All users that are about to complete the following questionnaire or part of it should first be introduced to the INSIGHT platform and its features. 4.1 Goals of the Evaluation To assess the utility and usability of the INSIGHT platform for the people working in DCC. 4.2 Evaluation Period The INSIGHT evaluation will start at ………... and finish at ……….... (e.g. a two days period). 4.3 Evaluation of the Twitter ISA Functionality. The Twitter ISA identifies tweets with content relevant to traffic or flood events. The Goal is to check whether the Twitter ISA is able to return relevant content. Task. Offline evaluation. UoA will provide DCC with the set of identified tweets at the end of the evaluation period in an Excel file so that DCC can check their relevancy and compare with the Radio Station tweets of the same days. For each tweet the following information will be required (to be filled by DCC). - T1. Was this tweet relevant? (yes/no) - T2. Was this event captured by other conventional means from DCC (cameras, SCATS, etc)? (no/scats/cctv/etc) - T3. In case the tweet is relevant, did the incident appear in the LiveDrive stream? (UoA will provide the LiveDrive tweets as well) (yes/no) - T4. Other comments (free form text) Text of Tweet User T1. Relevancy to be provided to be provided ……………. T2. Novelty ……………. T3. LiveDrive T4. Comments ……………. 4.4 Evaluation of the BUS ISA Functionality: The Bus ISA identifies traffic events using the GPS data of the Dublin buses. The goal of this evaluation is the check if the alarms of the Bus-ISA correspond to real traffic congestion events. Evaluation windows: 30 minute windows D6.2, Version 1.0, 31/08/2015 1 INSIGHT FP7-318225 - 09:00-09:30, 13:00-13:30, and 22:00-22:30 (or the latest someone is in the traffic control room) For both evaluation days (DCC please define different and more appropriate evaluation windows). Instructions: In a new INSIGHT page or after reloading an existing page enable the Layer ISA-Anomalies and ensure the Icons option is enabled as show from the image bellow. Task. During the above evaluation windows, the DCC operators should look at the screen of INSIGHT and for every BUS anomaly (delay) marked by this icon: following information from the popup window that looks like this: D6.2, Version 1.0, 31/08/2015 2 , note down the INSIGHT FP7-318225 Please close the window by clicking the ‘x’ mark after you finish working with an anomaly. The “Approve” , “Reject” and “Don’t Know icons are used in order to send immediate feedback to the INSIGHT database about the event. Important notes: 1) The ‘x’ mark refers to the panel the bus information are presented and not to the browser ‘x’ mark. 2) Please evaluate only the red bus icons. If blue bus icons appear on the screen probably the Live-Bus layer is open too. In this case please disable the Live-bus layer. The required information is the following: ● B1. Anomaly ID (AID) ● B2. Is the delay reported by INSIGHT actually a delay? (Relevancy) Please provide the significance of the delay (1- No Delays, 5 - Heavy Delays). ● B3. Was the delay/anomaly captured by other conventional means from DCC (cameras, SCATS, etc) (Novelty) (no/scats/cctv/etc) ● B4. Was there also a traffic problem at that segment of the city? (it might be the case that a bus delays does not co-occur with traffic incidents). (Traffic) (no/yes) ● B5. Other comments B1. AID B2. Relevancy B3. Novelty B4. Traffic ……………. ……………. ……………. ……………. B5. Comments 4.5 Evaluation of the SCATS ISA Functionality: The Scats ISA identifies traffic congestion events using the static SCATS sensors of the Dublin city. The goal of its evaluation is the check if the alarms of the SCATS-ISA correspond to real traffic events. Evaluation windows: 30 minute windows - 09:00-09:30, 13:00-13:30, and 22:00-22:30 (or the latest someone is in the traffic control room) - For both evaluation days (DCC please define different and more appropriate evaluation windows). Instructions: In a new INSIGHT page or after reloading an existing page enable the Layer ISA-Anomalies and ensure that the Icons button is enabled as shown in the image bellow. D6.2, Version 1.0, 31/08/2015 3 INSIGHT FP7-318225 Task. During the above evaluation windows, the DCC operators should look at the screen of INSIGHT and for every SCATS anomaly (high degree of saturation) marked by this icon: , note down the following information from the popup window that looks like this: Please close the window by clicking the ‘x’ mark after you finish working with an anomaly. The “Approve”, “Reject” and “Don’t Know| icons are again used in order to send immediate feedback to the INSIGHT database about the event. Important notes: 1) The ‘x’ mark refers to the panel the scats information are presented and not to the browser ‘x’ mark. 2) )Please evaluate only the icons. If red scats icons appear on the screen probably the Live-SCATS layer is open too. In this case please disable the Live-SCATS layer. The required information is the following: ● S1. Anomaly ID (AID) D6.2, Version 1.0, 31/08/2015 4 INSIGHT FP7-318225 ● ● ● S2. Is the road congested? (Relevancy) Please provide the significance of the congestion (1- No Congestion, 5 - Heavy Congestion). S3. Was congestion/anomaly captured by other conventional means from DCC (cameras, SCATS, etc) (Novelty) (no/scats/cctv/etc) S4. Other comments S1. AID S2. Relevancy S3. Novelty S4. Comments ……………. ……………. ……………. ……………. 4.6 Evaluation of the Crowdsourcing Component Functionality: The Crowdsourcing component runs on mobile devices through the CrowdAlert application in order to display ongoing events found by INSIGHT to the end user and to extract information from the users. The goal of its evaluation is (i) to ensure the integrity of the app with the web interface of Insight, (ii) to ensure that it is fault-tolerant and easy to use, (iii) to evaluate the usefulness of the crowdsourcing tasks and (ix) to ensure that the app works according to the defined user settings. Evaluation windows: The traffic inspectors should interact with the INSIGHT mobile application using 30 minute windows and test its functionality. - 09:00-09:30, 13:00-13:30, and 22:00-22:30 (or the latest someone is in the traffic control room) - For both evaluation days (DCC please define different and more appropriate evaluation windows). Tasks: T1. The inspector at random times, should check the integrity of the events among components: ● C1 - Functionality. Are there any events showing in the map? (yes/no) ● C2 - Similarity. Are they the same with the ones illustrated in the Web Interface? (yes/no) ● C3 - Delay. Note that due to the refresh rate there might be a small delay among the appearances of the events. Is the delay acceptable?(yes/no) D6.2, Version 1.0, 31/08/2015 5 INSIGHT FP7-318225 C1. Functionality ……………. C2. Similarity ……………. C3. Delay ……………. T2. The inspector at random times, eg, every 30 minutes, should check the functionality of the application and report its behavior: ● C4 - Time. Date and time of the evaluation of the functionality ● C5 - Function. What was the evaluated function? (eg, Login, Report Information, Answer Task,etc.) ● C6 - Behavior. Was the behavior as expected? (yes/no) ● C7. Other comments (please include smartphone model as well) C4. Time C5. Function C6. Behavior C7. Comments ……………. ……………. ……………. ……………. T3. For each task that arrives at the crowdsourcing application, the inspector should evaluate the following: ● C8 - Relevancy. Was the question relevant to an ongoing event at the area? (1- Not Relevant, 5-Relevant) ● C9 - Novelty. Was the event already captured by other means in DCC or has the same task already been received? (yes/no) ● C10 - Importance. Was the question important for describing the event more accurately? (yes/no) ● C11. Other comments C8. Relevancy ……………. D6.2, Version 1.0, 31/08/2015 C9. Novelty ……………. 6 C10. Importance ……………. C11. Comments ……………. INSIGHT FP7-318225 T4. The inspector should adjust the values in the Settings menu and report the following for each incoming crowdsourcing task: ● C12 - Distance. Was the task located within the defined distance among the user and the task?(yes/no) ● C13 - Number of Tasks. Did the amount of received tasks exceeded the defined daily limit? (yes/no) ● C14 - Mute. Did you receive a task while being in mute mode? (yes/no) C12. Distance ……………. C13. Number of Tasks ……………. C14. Mute ……………. 4.7 User Interface and Visualization Functionality: The Interface component displays the events found by INSIGHT to the end user. The goal of its evaluation is to ensure that it provides a pleasant way to view the events in Dublin city even in a laptop display. Evaluation Windows: 30 minutes x 3 times during the x 2 days of the evaluation. Task: During the evaluation of the system, the traffic inspectors should interact with the INSIGHT interface. The main goal is to understand if the interface provides a pleasant user experience. Instructions: The interface provides 4-layers or visualization: 1. ISA-Anomalies 2. RT-Events (Events found from INSIGHT by considering aggregated information from the ISA-Anomalies) 3. Live-Bus (Real time location of delayed buses) 4. Live-Scats (SCATS sensors reporting high degree of saturation during their last measurement) It is recommended that at every time only one layer should be used. The interface has two options for displaying information on the map “Icons” and “Polygons”. At any time both the options could be used. The “Icons” option provides a visual representation of the event or anomaly type while the “Polygon” option depicts the affected area. IMPORTANT: Any change in settings is applied on the next screen update. This is usually every 15 seconds. D6.2, Version 1.0, 31/08/2015 7 INSIGHT FP7-318225 Task: System Description: Please provide the following details. 1. Screen Size: 2. Screen resolution: 3. CPU (i3, i5, i7 or AMD): 4. Available RAM (e.g. 4GB): Task: Usability Questions: V1. Do you find it easy to navigate inside the map? If No, please comment. (Yes/Comment) V2. Does the refresh rate provide a smooth experience on your browser? (Yes/No) V3. Do the default settings provide you a smooth and not overloaded with icons interface? (Yes/No) V4. Does the interface display correctly on your screen size? For example no overflows or overlapping buttons. (Yes/No) V5. Do you find the plot panel easy to use? If no please provide comments. (Yes/Comment) V6. Do you find the help panel useful? If no please comment on information you would like to have on this panel. (Yes/No) V7. Do you find the information presented when the user clicks to an icon enough for the description of an anomaly or an event? If no please comment about extra details you would like to have.(Yes/Comment) V8. Do you think that the data layers offered (RT-Events, ISA-Anomalies) are enough ? If not what is the layer you think the system is missing? (Yes/Comment) V9. Do you find the settings panel enough in order to customize your experience? If no please include any settings suggestions that you may have. (Yes/Comment) V10. Do you find the icons used in the visualization system exploratory for the event or the anomaly they depict (e.g. A bus icon for the Bus-ISA etc)? If no please provide alternatives. (Yes/Comment) 4.8 Overall Evaluation of the System Task: Please provide your overall assessment of the usability and utility of the INSIGHT platform. D6.2, Version 1.0, 31/08/2015 8 INSIGHT FP7-318225 5 Appendix B – Nation Wide Case – Questionnaire Evaluation AKNZ Please leave some time to answer the following questions. Thank you for your feedback! INSIGHT feedback collection You will help us to get some information about the use of the INSIGHT system fully Visualization and Usability agree mostly agree partially agree do not agree completely disagree All the functions are logically located O O O O O It was easy to understand the different functions O O O O O The size of the map was big enough O O O O O It was easy to zoom in on events on the map O O O O O I could understand the events on the timeline O O O O O It is easy to recognize the type of event O O O O O It was clear what the numbers on the vertical line O of the timeline indicated O O O O The visible timeframe was big enough O O O O O The timeline was easy to use O O O O O The layer function was clear O O O O O The layer function was easy to use O O O O O I could understand the function of the heat map O O O O O It was clear how to use the navigator function O O O O O It was easy to save locations with the navigator O function O O O O I could understand the events shown on the O events list O O O O It was easy to search for events O O O O D6.2, Version 1.0, 31/08/2015 O 9 INSIGHT FP7-318225 I could locate the events easily O O O O O I could quickly understand the type of event O O O O O Enough events were shown on one page O O O O O I could understand the function of event details O O O O O I could understand the weight of an event O O O O O I could understand the event details of the mobile O phone usage O O O O I could understand the event details of the tweets O O O O O I could understand the two different lists in the O event list O O O O I used the upper event list more than the lower O event list O O O O mostly agree partially do not agree completely disagree fully Visualization and Usability agree agree I could change the order of the events O O O O O The usability of the ontology was easy O O O O O The ontology was listed in a logical way O O O O O There were enough types of ontology O O O O O partially agree mostly agree agree do not agree completely disagree O O O O O I selected the area which was red on the heat O map first O O O O I often navigate to a specific area on the map O by using the map O O O O I often navigate to a specific area on the map O by using the navigator O O O O I often navigate to a specific area on the map O by using the column lat/lon in the event list O O O O I often navigate to a specific area on the map O by using the lat/lon in the event details O O O O The way I selected events was random O O O O O I often clicked on the peaks shown on the O timeline O O O O I often used the function to focus on a specific time O O O O fully Usage during the exercise I selected the area with the most events first D6.2, Version 1.0, 31/08/2015 10 O INSIGHT FP7-318225 The event marker function was turned on O during the entire exercise O O O O The heat map function was turned on during O the entire exercise O O O O The areas layer function was turned on during O the entire exercise O O O O The traffic layer function was turned on during O the entire exercise O O O O I often used the navigator function O O O O O I saved locations in the navigator function O O O O O I often used the search function in the events O list O O O O I clicked the refresh button regularly O O O O O I often changed the selection of the columns O O O O O I often used the lat/lon function to locate an O event O O O O I changed the number of events on one page O regularly O O O O I often scrolled down on the events list O O O O O I often created new events on the map O O O O O Usage during the exercise fully partially agree mostly agree agree do not agree completely disagree O O O O O I selected all the types of ontology during the O entire exercise O O O O I changed the types of ontology regularly O O O O I prioritised the events based on their weight O mostly agree partially agree do not agree completely disagree I had a good overview of the situation O shown on the map O O O O There was too much information on the O map O O O O The peaks and dots on the timeline were O useful O O O O The feature to adjust the time frame was O useful O O O O The event markers were useful O O O O Usage Assessment fully agree D6.2, Version 1.0, 31/08/2015 O 11 INSIGHT FP7-318225 The heat map was useful O O O O O The areas layer was useful O O O O O The traffic layer was useful O O O O O The navigator function was useful O O O O O It was useful to save locations O O O O O It was useful for the decision-making to O see the location of the event O O O O It was useful for the decision-making to O see the duration of the event O O O O It was useful for the decision-making to O see the source of the event O O O O It was useful for the decision-making to O see the type of the event O O O O The selection of the different ontologies O was useful O O O O Usage Assessment Event Markers Heat Map Areas Layer Traffic Layer I used the following layers O O O O Usage Assessment ID I used the following columns from the O events list Comments/ Questions D6.2, Version 1.0, 31/08/2015 12 Type Start Lat/Lon Details Source O O O O O INSIGHT FP7-318225 Statistics < 20 20-29 30-39 40-49 > 49 Age O O O O O Nationality Any questions? Contact [email protected] D6.2, Version 1.0, 31/08/2015 13