1
Picture Quality Analysis System
PQA500
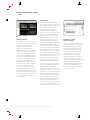
A model of the human vision system
has been developed to predict the
macro-behavioral response to light
stimulus with the following varying
parameters:
Contrast including supra-threshold
Mean Luminance
Spatial Frequency
A: Modulation Sensitivity vs. Temporal
Frequency.
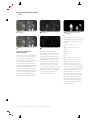
C: Reference Picture.
Temporal Frequency
Angular Extent
Temporal Extent
Surround
Eccentricity
Orientation
D: Perceptual Contrast Map.
Adaptation effects
This model has been calibrated, over
the appropriate combinations of ranges
for these parameters, with reference
stimulus-response data from vision
science research. As a result of this
calibration, the model provides a highly
accurate prediction.
B: Modulation Sensitivity vs. Spatial
Frequency.
The following graphs are examples of
scientific data regarding human vision
characteristics used to calibrate human
vision system modeling in the PQA500.
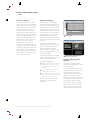
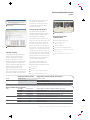
Graph (A) shows modulation sensitivity
vs. temporal frequency and graph (B)
shows modulation sensitivity vs. spatial
frequency. The use of over 1,400 calibration points supports high-accuracy
measurement results.
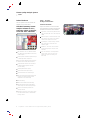
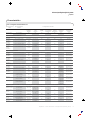
The following picture (C) is a single frame
from the reference sequence of a moving
sequence and picture (D) is the perceptual contrast map calculated by the
PQA500. The perceptual contrast map
shows how the viewer perceives the
reference sequence. The blurring on the
background is caused by temporal
masking due to camera panning and
the black area around the jogger shows
the masking effect by the high contrast
between the background and the
jogger. The PQA500 creates the
perceptual map for both reference and
test sequences, then makes a perceptual difference map from them.
PQA500 • www.tektronix.com/products/video_test/
3