1
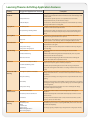
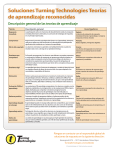
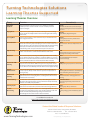
Learning Theories & Polling Application Features
Theory
Suggested Application Features
Immediate
Feedback
Chart with Correct Answer Indicator
By always providing a Chart and a Correct Answer Indicator, learners and the
instructor are provided with both the immediate results and knowledge of the
correct answer.
Participant Monitor
To view learner specific responses, use a split/dual screen to view the
Participant Monitor only on the instructor’s laptop.
Individual Reports
Provide learners with the “Results by Participants–Answer Detail” report using
the page break feature as a study guide.
Fastest Responder
Conduct a warm-up by having 2-3 questions related to previous materials in
combination with Fastest Responder slides.
Priority Ranking or Ranking Wizard
Involve learners in their own learning process. Use a Priority Ranking slide to
allow learners to identify several topics they are interested in learning more
about.
Continue Prior Session
Continue Prior Session can be used to collect the data from the various
questions being spaced between class periods.
Essay Slide
Provide learners with “think time” by either inserting a PowerPoint slide with
only the question or use the Essay Slide to a TurningPoint Question slide.
Repoll
Ask the question initially without discussion and then after discussion use the
Repoll function to ask again.
Comparative Linking/
Comparative Linking Reports
Copy the question to show a Comparative Link between the first polling and
second polling.
On the Fly Slides
On the Fly questions can be inserted enabling the instructor flexible
questioning.
Conditional Branching
Build Conditional Branching slides that will automatically move to specific
slides based on the learners’ responses.
Moment to Moment
Check for understanding using the Moment to Moment slide having the
learner self-evaluate their comprehension level.
Countdown Timer/Response Grids
Use a Countdown Timer to motivate learners to answer quickly and display
response/non-response grids to motivate participation.
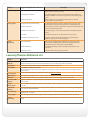
Engagement
Spacing Effect
Peer Instruction
Agile Teaching
Motivation
Leader Boards/Gaming Slides
Assessment FOR
Learning
Positive
Reinforcement
Game Based
Learning
Examples
Leader Boards spaced throughout a session will encourage competition.
Point Values
Use positive and negative Point Values to encourage motivation based on total
points.
TurningPoint AnyWhere–Live Charts
Opened TurningPoint AnyWhere’s Live Chart feature to allow learners to
change their answer from 1 to 10 based on their comprehension level during
instruction.
Anonymous Polling
Use Anonymous Polling to encourage learners to respond without the stress of
grading.
Review Only
Change the chart settings to “Review Only” especially when there is a potential
of a large percentage of incorrect responses during a pre-test which might lead
to discouragement.
Comparative Linking
Provide pre and post questions within one session and display the change
using the Comparative Linking slide.
Correct Answer Indicator
Use a Correct Answer Indicator in both TurningPoint and TurningPoint
AnyWhere.
Fastest Responders/Leader Boards
Display Fastest Responder and Leader Boards frequently to reinforce correct
answer choices.
Point Values
Use all positive Point Values for both correct and incorrect answers. (Set the
incorrect choices at a lower value.)
Team Slides
Fastest Responder
Wager
Leader Boards
Speed Scoring
TPAW with Digital Games
Team Scoring Reports
TurningPoint allows for the use of multiple gaming slides. An instructor could
simultaneously have learners competing individually and as teams. Show the
Leader Boards frequently.
Encourage ongoing competition by posting the team scoring reports weekly.