1
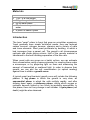
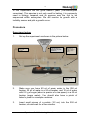
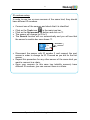
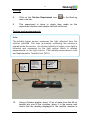
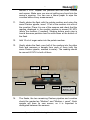
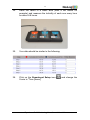
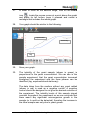
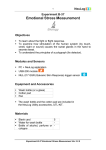
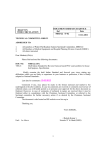
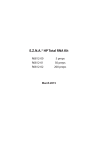
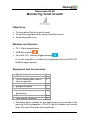
1 Experiment B-38 Monitoring Yeast Growth Objectives To learn about the life cycle of yeast. To monitor yeast growth by using a turbidity sensor. To plot a growth curve. Modules and Sensors PC + NeuLog application USB-200 module Two NUL-231 Turbidity logger sensors (It is also possible to conduct the experiment with one NUL-231 turbidity logger sensor) Equipment and Accessories 50 ml beaker 250 ml beaker 100 ml conical flask (one of them is optional) Funnel Sample container Pasteur pipette Plastic cuvette (included with the sensor) Black marker Heat source (optional) 2 1 2 1 1 3 2 1 1 The items above (except for the heat source) are included in the NeuLog Utility accessories, UTL-KIT (the kit includes one conical flask, the use of the other one is optional). Experiment B-38 Monitoring Yeast Growth Ver 3.0.3 2 Materials 10 cm of aluminum foil 1 cm3 of a raw potato 0.5 g of sugar in 10 ml water 60 ml warm water 20 ml room temperature water A pinch of baker's yeast Introduction The term "yeast" refers to fungi that grow as unicellular organisms. Yeast generally have simple nutritional needs, they use reduced carbon sources, nitrogen sources, vitamins and a variety of salts and trace elements. Most yeast proliferate by budding, in which a bud immerges from a parent cell. The parent's cell chromosomes replicate and divide during mitosis. Half of the genetic material is transferred to the bud following separation of the two cells. When yeast cells are grown as a batch culture, we can estimate their concentration using a haemocytometer for counting them under a microscope, or by projecting light on them and measuring the amount of transmitted or scattered light. In order to observe their growth, we can plot the cell concentration (or optical reading) against time to obtain a growth curve. A typical yeast (and bacteria) growth curve will include the following phases: A lag phase in which the growth is very slow, an exponential phase in which the cells multiply rapidly, and after slowing down again, a stationary phase, during which oxygen or nutrients become limited or too much by-products accumulate. In this phase, there isn't any change in cell number. A lysis phase (cell death) might be also observed. Experiment B-38 Monitoring Yeast Growth Ver 3.0.3 3 In this experiment we will grow Baker's yeast (Saccharomyces cerevisiae). This species is not only used for baking, it is commonly used in biology research and its genome was the first to be sequenced within eukaryotes. We will monitor its growth with a turbidity sensor and plot a growth curve. Procedure Experiment setup 1. Set up the experiment as shown in the picture below. Filter the medium into the conical flask (section 4) 20 ml of water in a 50 ml beaker. 60 ml of warm water in a 250 ml beaker. Add pieces of potato (section 3) 10 ml of water with 0.5 g of sugar in a 50 ml beaker (sugar water) A pinch of Baker's yeast in a sample container 2. Make sure you have 60 ml of warm water in the 250 ml beaker, 20 ml of water in a 50 ml beaker, and 10 ml of water with 0.5 g of sugar (about a quarter of a tea spoon) in a 50 ml beaker (sugar water). You should also have a pinch of baker's yeast in a sample container. 3. Insert small pieces of a potato (1/2 cm) into the 250 ml beaker, stir and wait for a few minutes. Experiment B-38 Monitoring Yeast Growth Ver 3.0.3 4 4. Filter the medium from the 250 ml beaker into one of the conical flasks through the funnel. Note: If you choose to use one flask and one turbidity sensor (without the control) use half of the quantities mentioned above. Sensor setup 5. Connect the USB-200 module to the PC. 6. Check that the two turbidity sensors the USB-200 module in a chain. are connected to Note: The following application functions are explained in short. It is recommended to practice the NeuLog application functions (as described in the user manual) beforehand. 7. Run the NeuLog application and check that the turbidity sensors are identified. Experiment B-38 Monitoring Yeast Growth Ver 3.0.3 5 ID numbers setup: In order to use two or more sensors of the same kind, they should have different ID numbers. Connect one of the sensors and check that it is identified. Click on the Tools icon in the main icon bar. Click on the Set sensors' ID button and click on '2'. The sensor will change its ID to 2. The Search function will run automatically and you will see that the sensor's module box now shows '2'. ID number Disconnect the sensor with ID number 2 and connect the next sensor in order to change its ID. Proceed as you did for the first sensor. Repeat this procedure for any other sensor of the same kind you want to connect in a chain. Once your sensors (in this case two turbidity sensors) have different ID numbers, you can connect them in a chain. Experiment B-38 Monitoring Yeast Growth Ver 3.0.3 6 Settings 8. Click on the On-line Experiment icon main icon bar. in the NeuLog 9. This experiment is done in single step mode so the experiment duration and sample rate will not be set. Testing and measurements Note: The turbidity logger sensor measures the light reflected from the solution particles. The tube (a cuvette) containing the solution is placed inside the sensor. As solution turbidity is higher, more light is reflected and measured by the light sensor which is located perpendicular to the light source. The turbidity measurement units are Nephelometric Turbidity Unit (NTU). 20 ml of water in a 50 ml beaker. measure the turbidity (section 10) 10. Pour half of the medium into the other flask and measure a sample of each of them (section 13) Potato medium measure the turbidity (section 11) Add the sugar water (section 12) Using a Pasteur pipette, insert 1.5 ml of water from the 50 ml beaker into one of the cuvettes, place it in the sensor and check that the reading displayed in the module window is Experiment B-38 Monitoring Yeast Growth Ver 3.0.3 7 around 0 NTU. Repeat this process with the other cuvette and sensor. Make sure you are not spilling any liquid into the sensor's opening. You can use a tissue paper to wipe the cuvettes before every measurement. 11. Gently shake the flask with the potato medium and using the same Pasteur pipette, insert 1.5 ml of the medium into one of the cuvettes. Place it in one of the sensors and check that the reading displayed in the module window is around 50 NTU (dilute the medium if needed). Shaking before each step is crucial because particles tend to settle down at the bottom of the flask. 12. Add 10 ml of sugar water into the potato medium. 13. Gently shake the flask, pour half of the medium into the other flask and measure a sample from each of them (with the same Pasteur pipette, washed in water). The reading should be around 40 NTU in both of them. Medium+yeast Medium Medium+yeast Medium Medium+yeast Medium+yeast 14. Medium Add a pinch of yeast into the "Medium + yeast" flask (section 16) The flasks, the two remaining Pasteur pipettes and cuvettes should be marked as "Medium" and "Medium + yeast". Each sample will have its own sensor, so it is important to distinguish between the sensors. Experiment B-38 Monitoring Yeast Growth Ver 3.0.3 8 15. Keep the medium inside the "Medium" cuvette. 16. Add a pinch of baker's yeast from the sample container into the "Medium + yeast" flask. 17. Gently shake the flask, and use the "Medium + yeast" Pasteur pipette to insert 1.5 ml of the culture into the corresponding cuvette. 18. Cover the two flasks with aluminum foil (not too tight). 19. Place the two cuvettes, each filled with a different sample into the turbidity sensor. If a liquid in the cuvette is there more than 2 seconds, gently mix it. 20. Click on the Single Step icon 21. Click on the Table icon on the bottom part of the screen. A table will be displayed for data record. 22. Change the "Manual values" column name to "Time [hours]" (clicking on the title of the column will allow you to do so). 23. Insert the time from the beginning of the measurement (0) in the "Time [hours]" column. . Experiment B-38 Monitoring Yeast Growth Ver 3.0.3 9 24. Place the flasks in a warm area (near a fan heater for example) and measure the turbidity of each one every hour for about 6-8 hours. 25. Your data should be similar to the following: 26. Click on the Experiment Setup icon X-axis to "Time [hours]" and change the Experiment B-38 Monitoring Yeast Growth Ver 3.0.3 10 27. In order to focus on the desired range, click on the Zoom icon , locate the mouse cursor at a point above the graph and press its left button; keep it pressed and create a rectangle that includes the whole graph. 28. Your graph should be similar to the following: Exponential Stationary Lag Time [hours] 29. Save your graph. 30. The turbidity of the yeast sample (shown in green) is proportional to the yeast concentration. We can see in the sample experiment, that the yeast concentration increased throughout the experiment and the three phases can be identified (lag, exponential and stationary). The data taken from the medium without any yeast added (shown in red) is used as a negative control. A negative control should be designed to not give the desired outcome of the experiment. The turbidity levels of this sample stayed constant throughout the experiment so we can conclude that there wasn't any significant microorganism growth in the sample (or it could not be detected), therefore the increase in the other sample was only due to yeast growth. Experiment B-38 Monitoring Yeast Growth Ver 3.0.3 11 Summary questions 1. Identify the different phases of growth in your graph. 2. What do you think will happen if we repeat the experiment (after adding yeast to the medium) changing the following conditions: a. The yeast is incubated at 15 ºC. b. The flask is shaken continuously throughout experiment. c. A teaspoon of salt is added to the medium. d. Sugar is not added. e. A larger flask with more medium is used. 3. Explain why we use yeast in baking. Experiment B-38 Monitoring Yeast Growth Ver 3.0.3 the