1
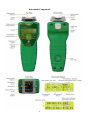
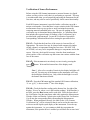
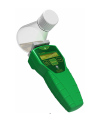
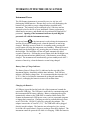
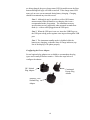
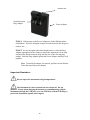
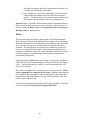
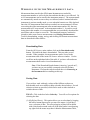
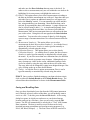
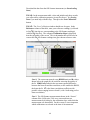
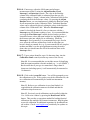
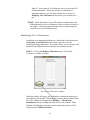
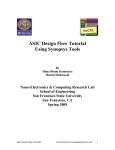
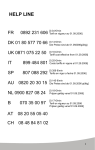
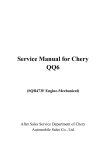
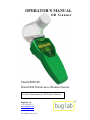
OPERATOR’S MANUAL OD Scanner Model BEH100 Hand-Held Noninvasive Biomass Sensor Includes Instructions for OD Scanner Software BugLab LLC (925) 208-1952 www.buglab.com [email protected] Last Updated: July 8, 2013 Notice This publication and its contents are proprietary to BugLab LLC (“BugLab”), and are intended solely for the contractual use of BugLab customers. While reasonable efforts have been made to assure the accuracy of this manual, BugLab shall not be liable for errors contained herein nor for incidental or consequential damage in connection with the furnishing, performance, or use of this material. BugLab reserves the right to revise this manual and make changes from time to time without obligation by BugLab to notify any person of such revisions or changes. BugLab does not assume any liability arising out of the application or use of any products, circuits, or software described herein. Neither does it convey a license under its patent rights nor the patent rights of others. This publication and its contents may not be reproduced, copied, transmitted, or distributed in any form, or by any means, radio, electronic, mechanical, photocopying, scanning, facsimile, or otherwise, or for any other purpose, without the prior permission of BugLab. BugLab provides no warranties whatsoever used in connection with any BugLab device, express or implied. Neither does it guarantee software compatibility with any off-the-shelf software package or any software program that has not been written by BugLab. Intended use of this system must be followed within the guidelines of this manual. In no event will BugLab be liable for any damages caused, in whole or in part, by any customer, or for any economic loss, physical injury, lost revenue, lost profits, lost savings or other indirect, incidental, special or consequential damages incurred by any person, even if BugLab has been advised of the possibility of such damages or claims. The optical designs and circuit board designs in the OD Scanner are proprietary to BugLab. The user may not copy any of the designs, either in whole or in part without written permission from BugLab. Windows is a registered trademark of Microsoft Corporation. The OD Scanner software is written in the LabVIEWTM development environment. Copyright © 2013 National Instruments Corporation. All Rights Reserved. Copyright © BugLab LLC 2013 All Rights Reserved 2 Cautions CLASS 1 LASER PRODUCT Complies with 21 CFR 1040.10 and 1043.11 except for deviations pursuant to last Notice No. 50 dated 6/2007. The low-voltage OD Scanner is water-resistant, but it is not waterproof. Keep the instrument clean and dry. Keep the USB Plug in place when performing measurements. Do not immerse the instrument. Do not drop or shake the instrument. Do not expose the instrument to direct sunlight or high temperatures. There are no user-serviceable parts inside the instrument. Do not leave fingerprints or dirt on the optical sensor surface. The sensor is a precision optical device. It may be cleaned with a light application of commercial window cleaner, ethanol, or isopropanol and gentle wiping with paper or cloth towels. Optical grade lens cleaning tissue is preferred. (Do not use acetone to clean the sensor. Some of the materials used in the sensor will rapidly degrade if exposed to acetone.) Important note to OD Scanner software users: Before plugging the OD Scanner into your computer, make sure you have installed the software first! 3 Table of Contents Part I. OD Scanner Instrument A. Getting Started 1. Unpacking the Instrument 2. Instrument Components 3. Verification of Performance B. Determining Biomass 1. Calibration Selection 2. Setting the Baseline C. Working with the OD Scanner 1. Instrument Power a. Battery State of Charge Indicator b. Charging the Batteries c. Configuring the Power Adapter 2. Information and Error Messages 3. Principles of Operation 4. Factory Default Calibrations D. Compliance Testing 1. FCC 2. IC ICES-003 Annex 3. CE Part II. OD Scanner User Interface Software A. Minimum System Requirements B. Conventions and Shortcuts C. Software Installation D. Connecting to the Instrument E. Configuring the Instrument 1. Setting the Instrument Date and Time 2. Turning On/Off Audio 3. Deleting Measurements 4. Reset 5. Reboot F. Working with the Measurement Data 1. Downloading Data 2. Sorting Data 3. Saving and Recalling Data G. User Calibration 1. Generating New Calibrations 2. Modifying Calibrations H. Help and Tips I. Trouble-Shooting End-User License Agreement Appendix I. OD Scanner Specifications Appendix II. Communication Trouble-Shooting 4 5 6 7 11 12 14 14 14 15 17 19 22 23 23 23 24 24 25 26 28 28 29 29 29 30 31 31 32 33 37 38 39 42 43 45 GETTING STARTED Unpacking the Instrument The standard OD Scanner instrument consists of: OD Scanner Instrument Verification Cup USB cable (2 m) USB port plug Power Adapter Virtual Instrument Software User Manual Instrument Calibration Sheet Optional accessories: Extended (5 m) USB cable Power Plug Adapters (International version) Unpack and inspect all of the components to assure that they have not been damaged in shipping. Note: The OD Scanner is an optical instrument and will only operate on transparent glass or plastic vessels that have at least 3 cm depth of fluid within the measurement area (directly in front of the sensor window). The instrument is specifically designed for use on small vessels, such as shake flasks, with a wall thickness of 5 mm, or less. The instrument is not designed for use with and may not measure accurate biomass measurement on vessels such as bioreactors with walls or site glasses having thickness greater than 5 mm. 5 Instrument Components 6 Verification of Sensor Performance Before using the OD Scanner instrument to measure biomass in a liquid culture you may wish to verify that it is performing as expected. This step is recommended when you are unpacking and using the instrument for the first time, and may also be used to periodically check sensor functionality. Each OD Scanner instrument is provided with a verification cup with a unique serial number. Note that there is some variation in the OD Scanner measurements from cup-to-cup due to small variations between the scattering material embedded in the cup. The specific reading of the verification cup is determined during manufacture. A Calibration Sheet that includes the expected range of readings of the Verification Cup is provided with each instrument. Locate the Verification Cup and the corresponding Calibration Sheet before starting the procedure below. STEP 1: Check that the front face of the sensor is clean and free of fingerprints. The sensor face may be cleaned with commercial window cleaner, ethanol, or isopropanol using lint-free tissue. DO NOT USE ACETONE, as it may cause irreparable damage to components used in the sensor. Likewise, check and if necessary clean the front (translucent white) surface of the verification cup that comes into contact with the front face of the sensor. STEP 2: If the instrument is not already on, turn it on by pressing the power button. Wait until the bottom line of the display reads “Ready…”. Note 1: After a few seconds of inactivity the display backlight will turn off. Pressing any of the buttons on the instrument will cause the backlight to turn back on. Only while the backlight is on will the buttons function as labeled. STEP 3: Press the Cal button until the standard OD Scanner calibration, “S. cer. (g/L)”, is shown on the 2nd line of the display. STEP 4: Check the baseline reading on the bottom line, far right of the display (“B:x.xx”m, where x.xx is the baseline reading). If the baseline is not 0.00, press the Base button until it reads 0.00. Place the front side of the Verification Cup (the translucent white side) against the Measurement Window. Make sure that the 2 plastic pins on the front of the Verification Cup fit into the corresponding holes surrounding the Measurement Window. When positioned correctly, the label on the “O.D. Scanner Verification Cup” will be oriented so that it can be read at the same time as the text on the liquid crystal display of the instrument. Press the cup against the instrument. As you continue to hold the cup against the instrument, if the speaker driver is enabled you will hear one or more brief 7 tones, each followed by a pause, and then a more rapid series of 3 ascending tones. The final 3 ascending tones are an indication of a complete measurement. Also, as the measurement is being performed, the Measurement Status Indicator LED on the top of the instrument (just above the display) will flash green, and turn to steady green when the measurement has been successfully completed. Note 2: If the Verification Cup is not kept in constant contact with the Measurement Window for the full measurement period (a maximum of 6 seconds), the speaker will play 3 low tones (if the speaker driver is enabled), and the Measurement Status Indicator LED will briefly turn red. The bottom line of the display will briefly read “unstable contact”. This means that the measurement was unsuccessful. Repeat Step 4 until a successful measurement has been completed. Note 3: If constant contact is maintained between the Verification Cup and instrument, but the signal varies excessively during the measurement period, the bottom line of the display will indicate “unstable reading”. If the readings are stable, but the reading is not uniform across the Measurement Window, the bottom line of the display will indicate “Insuff. Fluid?”. In either of these cases, the measurement will need to be repeated. If the Verification Cup is correctly positioned and the Verification Cup and Measurement Window are clean, but you are unable to collect a successful measurement after several tries, please contact BugLab technical support. STEP 5: Compare the measurement result to the allowed range of values on the Instrument Calibration Sheet that was provided with the instrument. If the measurement falls within the allowed range, you have successfully verified the instrument performance. Note 4: If the measurement value is outside of the allowed range, try cleaning the sensor face and the verification cup, and repeat steps 1-5. Repeated failure of the instrument may indicate the need for repair or re-calibration at BugLab. In this case, contact BugLab technical support. 8 9 10 DETERMINING BIOMASS STEP 1: If the instrument is not already on, turn it on by pressing the power button. Wait until the bottom line of the display reads “Ready…”. STEP 2 (CALIBRATION SELECTION): If the calibration shown on the second line of the display (e.g. “S. cer. (g/L)”) is not appropriate for your culture, press the Cal button until the correct calibration is shown. Note 1: The instrument is provided pre-calibrated for dry cell weight (DCW, g/L) and cell counts (Mcells/mL or Gcells/mL) for Saccharomyces cerevisiae (“S. cer.”) and Escherichia coli (“E. coli”), and for Nephelometric Turbidity Units (“NTU”). For further details on these calibrations, see Factory Default Calibrations (Section I.C.4) below. You may generate and upload additional calibrations using the user-interface software. See User Calibration (Section II.G) below for step-by-step instructions. STEP 3A (BASELINE): Position the front face (Measurement Window) of the OD Scanner against the side of a vessel containing only media (no cells). Look for an area of the vessel that is free of printing and markings (e.g. volume indications) and gross optical imperfections. When working with shake flasks it is generally not recommended to measure through the bottom of the flask, because the bottom surface is frequently non-uniform. Instead, choose an area on the side of the vessel that is flat in one dimension. The Vessel Adapter will help you guide the vessel into the right position against the Measurement Window. For accurate reading, at least 3 cm depth of fluid needs to be present in the area directly in front of the Measurement Window. As illustrated on the opposite page, in order to ensure that sufficient fluid is present in front of the sensor, position the sensor so that the bottom Position Sensor is located near the bottom of the vessel, at the point of transition from a curved to flat surface in the vertical dimension. When working with low volumes in shake flasks, it may be necessary to tilt the flask to bring sufficient fluid into the instrument’s field of view. Tilt the vessel only enough to bring the fluid level up to the top of the Sensor Face. Press the instrument against the side of the vessel until both Position Sensors (the 2 small metal pins located above and below the sensor window) are engaged (when engaged you may be able to hear or feel the Position Sensors click as they are pushed back and become flush with the Measurement Window). Engagement of the Position Sensors automatically initiates a new measurement. Continue holding the vessel against the instrument. If the speaker driver is enabled, you will hear one or more short tones, each followed by a pause, and finally a more rapid series of 3 ascending tones. The final sounding of the 3 ascending tones is an indication of a complete measurement. Also, as the measurement is being performed, the measurement indicator LED on the 11 top of the instrument (just above the display) will flash green, briefly turn off, and then turn to steady green when the measurement has been successfully completed. The measurement result is shown on the bottom line of the display. Note 2: Please visit our web site for a video demonstration of the OD Scanner: http://www.buglab.com/. Note 3: For accurate measurement, the vessel wall thickness should not be greater than 5 mm. The same vessel type should be used for the baseline measurement as for the subsequent biomass measurement (step 4 below). This is particularly critical when measuring low biomass (0-1 g/L) in clear media within thickwalled (3-5 mm) vessels. STEP 3B (BASELINE): Press the Base button. This stores the new measurement as the “Baseline” value. This baseline value will be subtracted from this and all subsequent biomass measurements. This is analogous to “zeroing” a spectrophotometer with a blank media sample prior to measuring OD in a cuvette. Note 4: In order for a measurement to be saved as a new baseline reading the “Base” button must be pressed within 5 seconds of the end of a successful measurement. Pressing the “Base” button outside of this 5 second window will only have the effect of toggling the baseline between the On and Off (no baseline subtraction; the baseline will be shown as “0.00”) states. Note 5: If the vessel is not kept in constant contact with the sensor for the full measurement period (2-6 seconds), the speaker (if enabled) will play a series of 3 low tones, and the measurement indicator LED will turn red. The bottom line of the display will read “unstable contact”. This means that the measurement was unsuccessful. Repeat Steps 3A and 3B until a successful measurement has been completed. Note 6: If constant contact is maintained between the vessel and sensor, but the signal varies excessively during the measurement period, the bottom line of the display will indicate “unstable reading”. This message may be seen if fluid is moving in and out of or excessive bubbles are present in front of the field of view of the sensor during the measurement period. Wait for the fluid and bubbles to settle, and repeat the measurement. If you are unable to get a stable reading, check the instrument using the Verification Cup (see Verification of Sensor Performance). Note 7: If the readings are stable, but not sufficiently uniform across the sensor face, “Insuff. Fluid?” will be displayed. This message may be seen if there is not at least 3 cm of fluid across the 12 area directly in front of the sensor face. Try repositioning the vessel and repeating the measurement. The OD Scanner has been tested with vessel sizes from 250 mL to 2000 mL with media volumes of 20% or more of the vessel capacity. In smaller vessels and fluid volumes (e.g. 25 mL media in a 125 mL shake flask) it may not be possible to get a valid reading, if it is not possible to find an orientation in which 3 cm of fluid is present in front of the entire measurement window. Note 8: It may be possible to get the instrument to accept a reading on small fluid volumes by tilting the vessel at a steep enough angle that only a thin (< 3 cm) film of fluid is present in front of the entire measurement window. However, readings collected under such conditions are likely to be inaccurate, and should not be relied on. Note 9: After pressing the Base button, the measurement result will read zero. This is because the new Baseline value is being subtracted from the measurement. STEP 4 (BIOMASS): In the same manner in which the Baseline reading was collected (Step 3A), position the Measurement Window of the OD Scanner against the side of the vessel containing your cell culture, and collect a measurement. Note 10: Particularly while first learning to use the instrument, it is recommended to make 3-5 separate measurements around the perimeter of each vessel (while still avoiding markings and other optical imperfections, always positioning the sensor as close to the bottom of the vessel as possible, and tilting the vessel as little as possible while still ensuring fluid is present over the entire area in front of the Sensor Face). Take the median of the measurements by ordering them from the lowest to the highest value and selecting the value in the middle of the ordering. Use of the median is generally more accurate than computing the mean of the measurements because the errors are generally not normally distributed (errors tend to be skewed towards high values). Note 11: After a measurement has been successfully completed, the calibration can be changed and the baseline switched on or off by toggling the Cal and Base buttons. The displayed results will be updated accordingly; however, the measurement result that is stored in memory (and that will be downloaded when using the software) remains as recorded at the time of the measurement. 13 WORKING WITH THE OD SCANNER Instrument Power The OD Scanner instrument is powered by two size AA low selfdischarging NiMH batteries. Because they are low self-discharging, the batteries are provided to you pre-charged and pre-installed in the instrument. The batteries can be recharged up to 1500 times and are expected to last for the life of your instrument. Battery replacement should not be necessary, and should only be performed by BugLab LLC personnel. Opening of the instrument enclosure by non-BugLab personnel will void the instrument warranty. The power button on the instrument is used to bring the instrument in and out of low-power standby mode, when the batteries are not being charged. When the screen is blank it is in standby mode; pressing the power button will bring the instrument out of standby. When the screen is not blank but the backlight is off, pressing the power button will turn on the backlight. The backlight will turn off again automatically after 5 seconds of inactivity. Pressing the power button while the backlight is on, will put the instrument into standby mode, if the batteries are not being charged. The instrument will automatically go into standby mode after 3 minutes of inactivity, when the batteries are not being charged. Battery State of Charge Indicator The battery State of Charge (SoC) is indicated on the top right of the instrument display, alternating with the time indicator. Four full bars indicate a full battery charge state. It is recommended that when the SoC is 25% (1 bar) or less that the instrument be recharged immediately. However, recharging the batteries sooner will not harm them. Charging the Batteries A USB port is provided on the back side of the instrument, beneath the removable USB plug. The USB port is used both for communicating with the instrument and for battery charging. Battery recharging takes place automatically whenever the USB cable is connected between the OD Scanner instrument and a USB power source, such as a personal computer or laptop that is turned on. Charging can also be performed directly from an AC (50/60 Hz, 120/240 V) source by using the plug adapter. The adapter converts the AC into DC (5 V). The USB cable can be plugged directly into this adapter. The batteries are recharged at a low current level and will require about 14 hours to recharge when fully depleted. The instrument cannot be powered Off while it is charging. While the batteries 14 are being charged, the green charge status LED (located between the Base button and BugLab logo) will blink on and off. If the charge status LED turns red, an error was encountered during battery charging. Charging should be terminated any time this occurs. Note 1: Although it may be possible to collect OD Scanner measurements while the batteries are charging, this is not a recommended mode of operation. The instrument accuracy specifications are only applicable when operated in stand-alone mode (i.e. with no cable plugged into the USB port). Note 2: When the USB port is not use, insert the USB Plug over the USB port to help protect against water ingress through the USB port. Note 3: The instrument standby mode is disabled while the batteries are charging, so that the State of Charge indicator (top line of the display) will update properly. Configuring the Power Adapter Several optional plug adapters are available to accommodate the plug types used in many different countries. Follow the steps below to configure the adapter. UK / Ireland Plug Adapter Continental Europe Plug Adapter Australia / New Zealand Plug Adapter 15 Release tab North American Plug Adapter Power Adapter STEP 1: If the prongs on the Power Adapter are in the folded position, unfold them. If you are using the charger in North America, the charger is ready to use. STEP 2: For use in regions other than North America, select the Plug Adapter appropriate for the country in which the instrument is to be used and insert the North American plugs into the rear of the selected plug adapter. Push the Plug Adapter against the Power Adapter until they lock together. Note: To unlock the adapter for removal, pull back on the Release Tab at the top of the power adapter. Important Reminders: Do not expose the instrument to high temperatures. The instrument is water-resistant but not waterproof. Do not immerse. Except when charging the batteries or communicating with the instrument through the USB port, cover the USB Port with the USB Plug to protect the instrument against water ingress. 16 INFORMATION AND ERROR MESSAGES The following informational messages may be displayed on the bottom line of the OD Scanner display. Elaboration of each message and potential remedies for errors are also described here. “Insuffic. Fluid?” This error message indicates that the optical readings were not uniform across the Measurement Window. This could occur if at least 3 cm of fluid was not in front of the Measurement Window during the measurement. Try repositioning the vessel and/or instrument so that more fluid is in the area directly in front of the Measurement Window. This error could also occur if the vessel surface has optical imperfections in the area being measured. Make sure to avoid areas of the vessel surface that have marking or printing (such as volume marks). Also avoid measuring through the bottom of shake flasks, because these are often optically non-uniform. If the error message still persists, check the instrument using the Verification Cup (see Verification of Sensor Performance). “Laser Cal Failed” Prior to each OD Scanner measurement, the laser output is calibrated using an internal monitoring diode. If the calibration is unsuccessful after 3 attempts, the “Laser Cal Failed” error message will be displayed, and no result will be reported. If the error message persists across multiple measurement attempts, resetting the laser calibration to the factory default values may help (see Resetting to Factory Default State). “Laser Unstable” During each OD Scanner measurement, the stability of the laser source in the OD Scanner is monitored. If the laser is not sufficiently stable to allow accurate biomass measurements to be made, the “Laser Unstable” error message will be displayed, and no result will be reported. This could occur if the instrument is operated outside of the specified temperature range (see Specifications) or if the instrument is not in equilibrium with the ambient temperature. Allow the instrument to equilibrate to an ambient temperature that is within the specified range (e.g. 1 hour if the temperature change was extreme). If the error message persists across multiple measurement attempts, check the instrument using the Verification Cup (see Verification of Sensor Performance). “Over Range” If the detected reflectance signal is beyond the allowed range of the instrument the “Over Range” error message will be displayed, and no result will be reported. If the error message persists across multiple measurement attempts, check the instrument using the Verification Cup (see Verification of Sensor Performance). “Ready…” This message indicates that the instrument is ready to start a new measurement. 17 “Unstable Contact” If the position sensors surrounding the front window of the instrument are simultaneously depressed but then released before a full measurement has been completed (between about 2 and 6 seconds), this error message will be displayed. Both position sensors must remain engaged during the full measurement period in order for a measurement to be successfully completed. A new measurement can be started by again pressing the instrument against a vessel, thereby engaging the position sensors. “Unstable Reading” If the optical signal fluctuates excessively during the measurement, this error message will be displayed. It may help to stabilize the flask position and let the fluid settle for a few seconds, before restarting the next measurement. Less commonly, this message may indicate the presence of a strong light source in the vicinity of the measurement area. For example, it is possible that very bright lights used to illuminate a photosynthetic culture could overwhelm the OD Scanner photodetectors. If the error message persists, try temporarily reducing the intensity of the ambient light source, for the duration of the OD Scanner measurement. If the error message still persists, check the instrument using the Verification Cup (see section “Verification of Sensor Performance”). “Wait…” When the instrument is rebooted (see Reboot), this message may be displayed for several seconds as the microcomputer brings all systems back into full operation. 18 PRINCIPLES OF OPERATION When the OD Scanner is pressed against the side of a liquid culture vessel and the two Position Sensors on the front face of the instrument are activated, an infrared laser behind the Measurement Window is directed into the liquid culture. The laser light is scattered by the cells or microorganisms, creating a “glow ball” of monochromatic light. The intensity and size of the glow ball is dependent on the biomass within the liquid culture. At early stages of growth, when the biomass is low, the glow ball will be large in size and weak in intensity. As the cells or microorganisms grow and divide, the concentration will increase and the glow ball will reduce in size and increase in intensity. The detectors behind the Measurement Window, surrounding the laser, are sensitive to the intensity of light back-scattered from within the glow balls. The measured intensity is combined in a manner that is linear with biomass over a very wide range of response. Although classical Optical Density (OD) measurements in a spectrophotometer require dilution in order to accurately determine biomass greater than about 0.5 g/L, the OD Scanner is able to determine biomass from 0.05 to 10 g/L or more, without dilution, or any liquid handling. One of the advantages of using an infrared laser source for measuring biomass is the avoidance of light absorbance by colored media components (and colored vessel materials). This allows for the measurement of true scattering rather than a combination of absorbance and scattering. As a result, a highly linear relationship is maintained between biomass concentration and the measured optical reflectance. However, it is also important to realize that for biomass containing strongly visible-light-absorbing chromophores (e.g. photosynthetic algae), the chromophore absorbance may affect the agreement between a conventional OD measurement and the result reported by the OD Scanner. The OD measured in the visible range by a spectrophotometer will be influenced by both chromophore absorbance and cell scattering, whereas the OD reported by the OD Scanner will be based only on cell scattering. In such situations, if the relationship between chromophore concentration and biomass is relatively fixed, it still may be possible to generate a strong correlation between OD measured by conventional methods and that reported by the OD Scanner. However, it is important to be aware that changes in chromophore concentration that are not accompanied by biomass change would not affect the result reported by the OD Scanner, but would skew the results determined by conventional visible spectrophotometry. Another important consideration when comparing OD Scanner results with conventional spectrophotometry, is the optical design of the spectrophotometer. Most spectrophotometers are designed to make accurate measurements of absorbance, but not scattering. A determination of chromophore absorbance requires only a comparison of how much light is extinguished within a sample when the chromophore is present at different concentration levels (e.g. zero and a known concentration). By contrast, in a scattering measurement, light is deviated from its path, rather than being extinguished. As a result, the measured amount of scattering will be dependent on the area and angle of scattered light that is captured by the detection system. Since the detector size and geometric arrangement is not standardized between different commercial 19 spectrophotometers, the Optical Density determined for biomass samples can vary significantly (e.g. 50% or more variation between different spectrophotometer models!). For this reason, the standard (default) calibrations provided on the OD Scanner are referenced to dry cell weight or cell counts rather than OD. If you would like the OD Scanner to report results in OD units, it will be necessary to calibrate to the specific spectrophotometer that is used for the off-line OD measurement. A simple step-by-step guide for generating a custom calibration for the OD Scanner is described below (User Calibration, Section II.G). The relationship between back-scattered light intensity (as measured by the OD Scanner) and biomass (such as dry cell weight) is weakly dependent on the size of the scattering particles. For this reason, it is recommended that separate calibrations be used for organisms with grossly different cell sizes, such as Escherichia coli (typical cell diameter 0.5-1 m) and Saccharomyces cerevisiae (typical cell diameter: 5-10 m). For mono-disperse cell cultures, these cell size differences can be compensated using a single multiplicative factor (“calibration slope”). Note that the 10-fold difference in cell diameters of these two microorganisms only has about a 3-fold effect on the OD Scanner calibration to biomass. For this reason, minor variations in cell diameter, such as are observed between different strains of the same organism, will have a relatively minor effect on the OD Scanner accuracy. Note that correlation between biomass and OD measurements performed using conventional spectrophotometry are also cell-size dependent, and that this cell-size dependence is somewhat different than for the OD Scanner, due to the difference between the optical measurement geometries (e.g. transmission vs. reflectance). More serious consideration must be given to organisms that do not grow as monodisperse cells (e.g. filamentous growth). The relationship between OD (whether determined by conventional means or the OD Scanner) and biomass is non-linear for organisms that are not mono-disperse in a liquid culture. As a result, OD can only be expected to provide an accurate measure of biomass for mono-disperse liquid cultures. For organisms that grow in clusters, OD can only be expected to provide a qualitative estimate of biomass. Correlation between biomass and OD Scanner measurements will generally be highest during the logarithmic phase of cell growth. Cell lysis results in a dramatic change in the average particle size. Once significant cell lysis has begun, such as typically occurs during the stationary phase of cultures, there will no longer be a linear relationship between biomass and optical measurements of scattering (by either conventional spectrophotometry or by the OD Scanner). Attempts to apply a non-linear fit to accommodate more than one particles size at a time (such as happens due to cell lysis) is not likely to be reliable because there is insufficient information to distinguish between changes in particle size vs. changes in number of particles. For this reason, when generating new calibrations, we recommend only using data collected prior to the transition between logarithmic and stationary phases of cell growth. What about the effects on measurement accuracy of vessel size, shape, wall thickness, and material? The OD Scanner instrument is designed to provide 20 accurate results over a wide range of vessel types. This is accomplished by several methods: (1) limiting the optical measurement volume, (2) restricting the allowed geometry between the vessel and instrument, and (3) minimizing the effect of varying the distance between the Measurement Window and liquid culture. Through a combination of these methods, the OD Scanner instrument has been demonstrated to provide high accuracy (<15%) over a wide range of vessel sizes (250 to 2000 mL), materials (glass, PET, PC), and wall thicknesses (up to 5 mm). However, it is important to understand the limits related to each of the optical methods described above: (1) Optical measurement volume The optical measurement volume is limited to a depth of about 3 cm. If the fluid depth in front of the Measurement Window is reduced below this level, significant variations in the measured biomass would be observed, if the instrument was allowed to report the results. By measuring the biomass at multiple times at multiple locations across the Measurement Window and comparing the results, the OD Scanner is able to automatically predict whether sufficient fluid is present for an accurate measurement to be made. When insufficient fluid is present, no result is reported, and the user is prompted to increase the fluid volume in front of the Measurement Window. However, if a uniformly thin (< 3 cm) film of fluid is present in front of the Measurement Window, it may be possible to “trick” the instrument into accepting an inaccurate reading, particularly in the low biomass (< 3 g/L) range. Such conditions can be generated by steeply tilting a small volume of fluid in a shake flask, or by use of a small diameter (< 3 cm) vessel with parallel sides (e.g. a test tube). Measurements collected under such conditions should not be relied on. (2) Restricting the vessel/sensor geometry The optical components and Position Sensors within the OD Scanner are all arranged along a single line. The Position Sensors can only be activated when the instrument meets a flat surface of the vessel and is also restricted to a narrow angular range. The Vessel Adapter provided on the OD Scanner helps guide the vessel into the correct position. Measurements made from within this welldefined geometric arrangement are highly reproducible (<15% error). (3) Minimizing the effect of measurement distance The optical arrangement within the OD Scanner is designed to have low sensitivity to small variations in the distance between the Measurement Window and the liquid culture to be measured. As a result, variations in vessel wall thickness, up to a thickness of 5 mm, will not affect the accuracy of the reported OD result. However, beyond a wall thickness of about 5 mm, the accuracy cannot be guaranteed, and for this reason, the OD Scanner is not recommended for use on bioreactors or other vessels having wall thickness in excess of 5 mm. 21 FACTORY DEFAULT CALIBRATIONS During manufacture, your OD Scanner instrument is programed with several built-in calibrations, summarized in Table 1. Adding custom calibrations is described later in the manual (User Calibration, Section II.G). The derivation of the built-in calibrations is next described. Table 1. OD Scanner Factory Default Calibrations Cal. # Slope Cal. Name Description 1 1.000 “S. cer. (g/L)” Saccharomyces cerevisiae, dry cell weight (grams/liter). 2 0.288 “E. coli (g/L)” Escherichia coli, dry cell weight (grams/liter). 3 298. “NTU” Nephelometric turbidity units, determined using Formazin standards. 4 1.32 “S. cer. (Mc/mL)” Saccharomyces cerevisiae, millions of cells per milliliter. 5 0.95 “E. coli (Gc/mL)” Escherichia coli, billions of cells per milliliter. (1) “S. cer. (g/L)” The raw units reported by your OD Scanner instrument are determined by a linear calibration of analytically determined dry cell weight (DCW) of Saccharomyces cerevisiae (dry active yeast, Red Star product number 2751, dissolved in 0.9% NaCl), in grams/liter (g/L), to the measured optical reflectance intensity. This calibration has been demonstrated to be highly linear (R2 = 0.9994) over a range of 0 to 10 g/L. (2) “E. coli (g/L)” A freeze-dried strain of Escherichia coli (E. coli) was purchased from American Type Culture Collection: Escherichia coli (Migula) Castellani and Chalmers (ATCC® 23724™). The freeze-dried pellet was re-suspended and grown in progressively larger volumes of media (20% filled vessels with 10 mL, 500 mL, and finally 2L capacity) with approximately 1/100 inoculations into Lysogeny Broth (LB) at 37C with progressive agitation (100, 200, and 400 rpm). Cells were harvested during the rapid growth phase, about 4 hours after inoculation, by filtration (Cellulose nitrate, 0.45 m pore size, Whatman part number 7184-009) at 4C, followed by drying at 100C to a stable weight. The dry cell weight (~0.6 g/L) was divided by raw OD Scanner readings (~2) made just before harvesting to obtain the “Slope” value. This determination was repeated 3 times. The estimated standard error of the slope determination was 0.005. (3) “NTU” Nephelometric Turbidity Units (NTU) are commonly used for reporting the cloudiness or turbidity of aqueous samples. Formazin is a primary calibration standard for determining NTU. A certified 4000 NTU Formazin turbidity standard was purchased (Hach Company catalog number 2461-49) and precisely diluted over a wide range. Dilutions of 200 NTUs and less were found to have a highly linear relationship (R2 = 0.994) with raw OD Scanner readings. The calibration slope reported in Table 1 was determined from a linear (least-squares method) fit to four dilutions spanning 4 to 200 NTUs. 22 (4) “S. cer. (Mc/mL)” Saccharomyces cerevisiae (dry active yeast, Red Star product number 2751) was dissolved into 0.9% NaCl at a concentration of 0.10 g/L. An Improved Neubauer Haemocytometer was used to count cells in a microscope (at 200x magnification). The results are reported in millions of cells per milliliter (“Mc/mL”). The estimated standard error of the slope determination was 0.1 Mc/mL. (5) “E. coli (Gc/mL)” A dry cell weight of 3.0x10⁻¹³ grams/cell (reference: http://ccdb.wishartlab.com/CCDB/cgi-bin/STAT_NEW.cgi) was used to convert the experimentally determined E. coli dry cell weight (see Factory Default Calibration #2) into billions of cells per milliliter (Gc/mL). Note that E. coli cell mass can vary substantially as a function of growth rate (for example see: G. Sezonov, D. Joseleau-Petit, and R. D'Ari, “Escherichia coli Physiology in Luria-Bertani Broth”, J Bacteriol. 2007; 189(23): 8746–8749). Therefore, the accuracy of the reported cell count can likewise be expected to vary as a function of growth rate. COMPLIANCE TESTING FCC The OD Scanner instrument has been tested and found to comply with the limits of a Class A digital device, pursuant to part 15 of the FCC Rules. These limits are designed to provide reasonable protection against harmful interference when the instrument is operated in a commercial environment. This equipment generates, uses, and can radiate radio frequency energy and, if not installed and used in accordance with the instruction manual, may cause harmful interference to radio communications. Operation of this equipment in a residential area is likely to cause harmful interference in which case the user will be required to correct the interference at his own expense. IC ICES-003 Annex This Class A digital apparatus complies with Canadian ICES-003. Cet appareil numérique de la classe A est conforme à la norme NMB-003 du Canada. CE Mark This product has been assessed and found to comply against the following standards; EN 61326-1: 2006 23 PART II. OD SCANNER USER INTERFACE SOFTWARE Minimum System requirements: 1. 2. 3. 4. 5. 6. Windows XP / Vista / 7 / 8 Operating System Minimum of 256 MB of RAM Minimum 200 MB free hard disk space. 1024 by 768 resolution (or higher) video adapter. Microsoft-compatible mouse. Available USB communications port. The OD Scanner software, written in the LabVIEWTM programming environment, gives you the ability to download data from the instrument, select subsets of the data, and save the data to a text file. The software also allows you to calibrate your OD Scanner to the reference units of your choice. This calibration can then be written into instrument memory, allowing the OD Scanner instrument to run in calibrated mode without being connected to a computer. For those users wishing to write their own software, the serial command protocol for communicating with the OD Scanner is available (inquire at [email protected]). Conventions and Shortcuts 1. Windows functions are described for the Windows 7 operating environment. Some variations may be seen in other operating environments (XP, Vista, 8). 2. Bold text is used to indicate menu items and buttons that you may select with your mouse, key combinations that you may execute on your keyboard, and names of control and indicators on the graphical user interface. 3. Italic text is used to indicate window names. 4. Bold italic text is used to indicate sections of this manual. 5. The » sign is used to indicate sub-levels of menu commands. For example: “Start » Control Panel » Programs » Uninstall a Program” means; select the Start menu, then select the Control Panel sub-menu, further select the Programs sub-menu, and then finally select the Uninstall a Program sub-menu. 24 SOFTWARE INSTALLATION STEP 1: Insert the OD Scanner Compact Disk (CD) into your computer. STEP 2: If a Windows AutoPlay message pops up, under “Install or run program from your media” choose “Run setup.exe”. If the installation does not start automatically, browse the CD for the “setup.exe” file and double-click on it. If Windows asks “Do you want to allow the following program (setup.exe)…to make changes to this computer”, click on the Yes button. STEP 3: You will be prompted to choose destination directories for both the OD Scanner software and the LabView (National Instruments) runtime engine used by the OD Scanner software. Click on the browse buttons if you want to install these programs somewhere other than the default directories shown. Otherwise, click on the Next button. STEP 4: Review the software license agreements. If you agree, then click on the “I accept…” buttons and then the Next button. STEP 5: A summary of the software components that are about to be installed is next displayed. Click on the Next button to begin installation. Installation may take several minutes. STEP 6: If the software has successfully been installed you should see an Installation Complete window. Click on the Next button. STEP 7: The driver for the USB virtual communication port device in the OD Scanner instrument is next installed. If a windows pop-up message asks whether you want to allow changes to your computer, select “Yes”. A window entitled “FTDI CDM drivers” should open. Select “Extract”. Once extraction is complete, the “Device Driver Installation Wizard” should automatically start. Select “Next” and wait for a confirmation that the driver was successfully installed. Select “Finish” to exit out of the Installation Wizard. 25 CONNECTING TO THE INSTRUMENT Note: Before plugging the OD Scanner into your computer, make sure you have installed the software first! STEP 1: Remove the USB Plug from the back of the instrument. Plug the USB cable into the OD Scanner instrument and into your computer. If this is the first time you are connecting the instrument to the computer you may see a Windows “Installing Device Driver Software” message pop up. If so, wait until a second message pops up saying “Your device is ready to use” before proceeding to the next step. STEP 2: Launch the OD Scanner program by selecting Start » All Programs » ODScanner » ODScanner.exe. A new window should open, similar to that shown (below): The OD Scanner Software Main window. STEP 3: Click on the Search for Instrument(s) button. A Find Hardware window should pop up: 26 The Find Hardware window. The program will automatically start searching all communication ports for OD Scanner Instruments. It may take several minutes, but once complete, a list of all OD Scanner Instruments connected to the computer will be shown: The software program is only capable of communicating with one OD Scanner instrument at a time. If multiple instruments are connected, use the Select button to determine which instrument to communicate with. Once you have made your selection, hit the OK button to establish communication with this device. Note: Once you are back in the main program window, the Serial Number of the instrument you selected is displayed in the upper right hand of the screen (along with the firmware version). The instrument serial number can also be found on the Instrument Label on the bottom side of the instrument. 27 CONFIGURING THE INSTRUMENT By selecting the Configure Instrument button, you will gain access to the following functions: Setting the Instrument Date/Time The OD Scanner Instrument has an internal clock that is used to track the date and time at which each measurement is collected. The clock will continue to run while the instrument is in standby power mode. However, if the batteries are fully drained, the clock may need to be reset, once the batteries have been recharged. Also, you may wish to synchronize the instrument clock to your computer clock (or some other clock). The user interface software provides a simple method for doing this. The following procedure assumes that you have already connected to an OD Scanner instrument (see Connecting to the Instrument, above). STEP 1: Within the Configure Instrument window select the Change date/time button. The Update Instrument Date and Time window. STEP 2: The Update Instrument Date and Time Window should now be displayed. Choose your preferred method of updating the date and time. By default, the updating method is Computer Clock. When this method is selected, the computer clock will be displayed (and updated once per second) in the “New Values” Date and Time control boxes. If you wish to update the OD Scanner instrument with some other date and time than that provided by your computer, select the Manual updating method, 28 and type the desired date and time into the New Values controls. When you are ready to write the new date and time settings into instrument memory select the Update button. STEP 3: Select the OK button to close the Update Instrument Date and Time window and return to the main program window. Note: If you select OK without first selecting the Update button, the Update Instrument Date and Time window will be closed, but the instrument date and time will not be updated. Turning On/Off Audio The OD Scanner instrument has an internal speaker that is used to provide audio feedback during measurements. The speaker driver can be turned On or Off using the provided buttons within the Configure Instrument window. Deleting Measurements Deletion of data from instrument memory is irreversible. Therefore, it is strongly advised that you download, save the data to file, and verify that it was properly saved before performing the following procedure. To delete all data from instrument memory press the Delete button within the Configure Instrument window. You will be asked to confirm that you really want to delete all data, before the data is actually deleted. Reset Selecting the Reset button will return the following instrument variables to their factory default states: (1) Stored Measurements: All measurements will be erased from memory. (2) Audio Indicator: The speaker driver (active during measurements) will be turned On. (3) Baseline: The baseline value will be reset to zero, and baseline correction will be turned off. (4) User Calibrations: The Modify Calibration and New Calibration buttons provide means of creating custom calibrations of the OD Scanner instrument to off-line reference measurements (such as Optical Density at a particular wavelength and for a particular organism). The Reset function 29 will erase the changes that have been made and return the User Calibrations to the factory default state. (5) Laser calibration: A new laser calibration is run at the start of each measurement and the results are stored in instrument memory. The Reset function will return the laser calibration to the original value determined at the time of manufacture. Important Note: If you have measurements stored in instrument memory that you want to keep, but have not yet saved to file, make sure to do so before selecting the Reset button (see Downloading Data and Saving and Recalling Data for further details). Reboot This function reboots the micro-computer that controls the instrument. This function is different from hitting the power button on the instrument. When the instrument is ON, pushing the power button puts the instrument into a low-power sleep mode, but does not fully shut down the microcomputer. The reboot button causes the micro-computer to restart as if power was switched off and on again. Rebooting the instrument is not normally recommended. However, if the firmware unexpectedly locks up or the front display is malfunctioning, rebooting the instrument may occasionally be necessary. Upon selecting the reboot button, the firmware version will be displayed on the 2nd line of the instrument display, and the bottom line will display "wait..." until the instrument is ready for a new measurement (this will take several seconds). If the reboot command fails, a hardware reboot may be necessary. This is only recommended as a measure of last resort. Hardware rebooting can be accomplished by inserting the end of a paperclip into the small round opening next to the USB adapter in the rear of the instrument (after first removing the USB port plug). Upon reboot, the instrument date/time will need to be updated. To do this, see the section entitled Setting the Instrument Date/Time. 30 WORKING WITH THE MEASUREMENT DATA Measurement data stored in the OD Scanner Instrument are tracked by measurement number as well as by the date and time that they were collected. Up to 999 measurements can be stored in the instrument memory. The measurements are automatically stored as soon as they are collected, and are retained when the instrument is put into standby mode, or even when the batteries are fully depleted. Once the 999 measurement limit has been reached, new measurements will start overwriting the oldest measurements (after measurement number 999, the next measurement will “wrap around” to measurement number 1). In order to avoid losing data in this manner, it is recommended that you periodically download the stored data, and save them to a text file. The instrument memory can then be cleared to make room for new measurements (see Deleting Measurements). Tools for downloading, sorting, saving, and recalling OD Scanner measurement data are described in what follows. Downloading Data From the OD Scanner main window click on the Download results button. Wait while the data is downloaded. This may take several seconds. When complete, the measurements can be viewed in the measurement table in the main OD Scanner software window. Use the scroll bar on the right-hand side of the table, if you have collected more measurements than can be viewed simultaneously. Note: If the Download Results button is inactive (“grayed out”), you have not yet successfully connected to the OD Scanner instrument. Perform the steps described above in Connecting to the Instrument before returning to this step. Sorting Data If you wish to work with only a subset of the full data set that was downloaded, tools are available to help select the desired subset. Several selection criteria are provided, which can be used to either include or exclude subsets of data. STEP 1: Click in the box below Select by:. You will see five options for selecting the data. (1) Highlighted Row(s): This option allows you to select data by keeping the mouse button depressed as you move the mouse (“click-drag”) over a selection of data. The selected region of data will be shown with a blue border around each cell (if the blue border is not showing up, right-click the mouse anywhere within the Measurement Table, 31 (2) (3) (4) (5) and make sure the Show Selection shortcut menu is checked). In order to select a measurement, only one cell within the row needs to be highlighted (it is not necessary to highlight the entire row). Date(s): This option allows you to select measurements according to the date on which the measurement was collected. Note that when you select the Date(s) option, an additional control box will appear just below the Select by control. You can manually type a date into this box, using month/day/year formatting. More than one date can be selected, by separating the dates with commas. A range of dates can also be selected using a dash (“-“). A simpler and frequently faster method of selecting the desired date, is to mouse-click within the Measurement Table on a measurement that was collected on the date you wish to select. Doing this will auto-populate the Date Selection control box. You can also select a range of dates by click-dragging across a range of measurements that were collected on more than one date. Measurement Number(s): This option allows you to select measurements by their Measurement Number(s). As with the Date(s) option, the Measurement Number(s) can be typed in manually or automatically selected using the mouse. Calibration Name(s): This option allows you to select data by Calibration Name(s). As with the Date(s) option, the Measurement Number(s) can be typed in manually or automatically selected using the mouse. If you select more than one calibration name, the different names will be stored as separate array elements. Although only two array elements are visible on the screen, additional elements can be viewed or edited by using the array index at the top left of the array. The array index can be changed by typing in an unsigned integer value or by clicking on the up or down arrow buttons. Time(s): As with the Date(s) option, measurement Time(s) can be typed in manually or automatically selected using the mouse. STEP 2: Once you have finished setting up your data selection criteria, click on either the Include Results or the Exclude Results button. The selected data subset should now be shown in the Measurement Table. Saving and Recalling Data Once you have downloaded your data from the OD Scanner instrument and, if desired, selected a subset of that data, you will probably want to save it as a file. To do this, press the Save to file button. A file-saving dialog box opens, in which you can browse to your desired storage location, and type in a file name. Once you are ready, press the OK button. The file will automatically be saved with a “*.osd” (OD Scanner Data) extension. The data is stored as a text file that can be easily imported into many spreadsheet and word-processing programs (e.g. Excel, MS Word, Notepad, …). The first 6 lines of the file consist of a 32 “header” that contains information regarding the instrument (including the Serial Number) that was used to collect the data, and when the data were downloaded. The measurement data begin on line 7. Previously saved data can be recalled by pressing the Open file button. Alternatively, to quickly import data directly into an excel file without a file header, click-drag across a range of measurements within the Measurement Table, then right-click the mouse, and select Export » Export Data to Excel from the shortcut menu. USER CALIBRATION Several standard calibrations are pre-installed in your OD Scanner instrument at the time of manufacture (for further details see Section I.C.4, Factory Default Calibrations). As discussed in the Principles of Operation section, each calibration consists of a single multiplicative factor (“calibration slope”) that accounts for gross differences in cell size. Minor differences in cell size, such as between different strains of the same organism, will have only a minor effect on the accuracy of the biomass reported by the instrument, and may not require further calibration. More commonly, you may wish to calibrate to additional species of organisms, or alternate reference methods (e.g. OD at 600 nm, cells/mL, etc.). Tools are provided for quickly adding to or modifying the calibrations stored in the instrument memory. Generating New Calibrations This section describes how to create a new calibration for your OD Scanner instrument. The following procedure requires that you collect at least one OD Scanner measurement and one corresponding reference measurement (using the reference method with which you would like the OD Scanner instrument to report future measurements). STEP 1A: Perform an OD Scanner measurement following the directions provided in the earlier section of this manual entitled Determining Biomass. Note 1: It is important that you baseline-correct the measurement collected by the OD Scanner (as described in Determining Biomass). This is particularly important for single-point calibrations. Note 2: The Cal setting used to collect the measurement result during this step is not important. The measurement result will automatically be converted into a raw (un-calibrated) result in the following steps. 33 Note 3: It may be helpful at this point to note the Measurement Number (and/or the date and time) that is displayed on the OD Scanner and use it to track the reference sample to be collected in the next step. Note 4: As discussed in the Principles of Operation section, the correlation between biomass and the reflected light intensity measured by the OD Scanner will generally be highest prior to the stationary phase of cell growth. Therefore, when determining new calibrations, we recommend excluding measurements collected after the logarithmic growth phase. STEP 1B: Collect a reference sample to be compared to the OD Scanner measurement. Note 5: The order of Steps 1A and 1B is not important, but they should be performed near enough in time so that the biomass content has not changed significantly between them. STEP 1C: Analyze the reference sample for biomass content (e.g. OD at 600 nm in a 1 cm cuvette). Note 6: When determining OD by conventional spectrophotometric methods, for best accuracy we recommend diluting the sample to an OD range between 0.2 and 0.5. Make sure to accurately determine the dilution factor, and multiply the measured absorbance by this dilution factor to get OD, before using it in the following steps. Just as you baseline-corrected the OD Scanner measurement, you should likewise baseline-correct your conventional spectrophotometric OD measurement using blank media. STEP 2: Repeat steps 1A though 1C as many times as desired. Note 7: The OD Scanner calibration consists of a single multiplication factor (slope), so only one OD Scanner measurement and one reference measurement (“single point calibration”) are required. However, if you want to assess the accuracy of the calibration, you will want to collect at least 3 points. When more than one point is included in the calibration, the slope is determined from a linear fit (least squares method) across all of the points. For best calibration accuracy, it is recommended that you collect readings that span the lowest and highest biomass values you expect to encounter for this culture. STEP 3: If you have not done so already, install the OD Scanner software onto your computer (see Software Installation) and then connect your OD Scanner instrument to your computer (see Connecting to the Instrument). 34 Download the data from the OD Scanner instrument (see Downloading Data). STEP 4: In the measurement table, select and include only those results you collected for calibration purposes (in step 1A above). See Sorting Data if you need help with this step. Then press the New Calibration button. STEP 5: The User Calibration window should now be open. In the Reference column of the table, enter your reference reading(s) (collected in Step 1C) into the row corresponding to the OD Scanner reading(s) (collected in Step 1A). The computed Calibration Slope is displayed near the top center of the screen. This is the number that will be used to convert the raw OD Scanner readings into your chosen reference units. Note 8: The root mean squared error (RMS Error) and R2 values shown below the graph may be useful in assessing the quality of the fit. RMS Error indicates the root mean squared difference between the linear fit and the actual data, so the smaller the RMSE, the better the fit. R2 is the linear correlation coefficient with possible values ranging between 0 and 1 (with 1 indicating perfect linear correlation). Note 9: The OD Scanner measurements shown in the “Sensor” column of the Calibration Table were converted into raw measurements by dividing by the calibration slope with which the measurement was determined. For this reason, it is not important which calibration was selected at the time of measurement. 35 STEP 6: If necessary, adjust the OD Scanner and reference measurement offsets by using the Adjust Baseline, Fixed Intercept?, and Intercept controls. The value in the Baseline column of the calibration table is subtracted from the raw OD Scanner readings (“Sensor” column in the Calibration Table) before correlating them to the Reference values. By pressing the Adjust Baseline button, you can simultaneously change the Baseline setting for all measurements in the Calibration Table. Individual Baseline values can be adjusted by directly editing the values in the Baseline column of the Calibration Table. When the Fixed Intercept? control is checked, the linear fit is force to intersect with the yIntercept at an OD Scanner reading of zero. It is recommended that you keep the Fixed Intercept? control checked, unless you have entered Reference values that span both the low and high range of the biomass units into which you are calibrating. When the Intercept is fixed, generally it is recommended to keep it fixed at zero, unless the reference method has a built-in offset that you haven’t already accounted for (e.g. if you measured OD in a complex medium and didn’t zero the spectrophotometer using the media alone, then you should enter the OD of the medium alone as the Intercept value). STEP 7: Type a unique identifier, up to 16 characters long, into the Calibration Name control (near the top center of the screen). Note 10: It is recommended that you include means of identifying both the organism and the reference method (e.g. “e. coli OD600”). But be aware that if you type in a name that is longer than 16 characters (including spaces), it will automatically be truncated to 16 characters. STEP 8: Click on the Accept Fit button. You will be prompted to save the calibration as a file. After you have saved the calibration file, the new calibration will automatically be loaded into instrument memory. Note 11: Before a new calibration is saved and loaded, it is required that the calibration name not be blank and that the calibration slope be non-zero. Note 12: Previously saved calibrations can be recalled within the User Calibration window by pressing the Read from Cal File button. This provides a convenient method for loading identical calibrations into multiple OD Scanner instruments. BugLab plans to provide calibration for additional organisms for download from our website. Check www.buglab.com periodically for updates on this topic. 36 Note 13: A maximum of 16 calibrations can be saved in the OD Scanner instrument. If there are already 16 calibrations in instrument memory, you will need to delete one or more (see Modifying User Calibrations below) before you can add a new one. STEP 9: On the front panel of your OD Scanner instrument press the Cal button until your new calibration is shown on the second line of the display. Subsequent measurements will now automatically be reported in your new calibration units. Modifying User Calibrations In addition to creating and uploading new calibrations as described above (Generating New Calibrations), the software provides a tool for modifying existing calibrations. This feature allows you to rearrange, edit, and delete the calibrations that are already in instrument memory. STEP 1: Click on the Modify Calibrations button. The Modify Calibrations window will open: The Modify Calibrations window. When the window first opens, the calibrations in instrument memory are automatically downloaded. Wait until the text in the button on the bottom left of the window has changed from Reading… to Read from Instrument before proceeding (this may take several seconds). When finished, all calibrations currently stored in instrument memory will be displayed in the Calibration Table. 37 STEP 2: Right-click the mouse anywhere inside the Calibration Table. Select options from the shortcut menu to rearrange, edit, or delete calibrations, as desired. STEP 3: When you have finished modifying the calibrations, click on the Write to Instrument button. Note 1: If you click on the OK button without clicking on the Write to Instrument button first, the changes you made to the Calibration Table are not saved into instrument memory. Note 2: The Write to Instrument button is inactive (greyed out) until you have made changes to the Calibration Table. Note 3: A maximum of 16 calibrations can be saved in the OD Scanner instrument. STEP 4: Click on the OK button to close the Modify Calibrations window and return to the OD Scanner main program window. HELP AND TIPS Hovering the mouse over most objects in the OD Scanner window and its popup sub-windows, will result in the appearance of a floating text box that contains a tip related to that object. Further information is available by right-mouse-clicking in the same area and selecting the shortcut menu item Description and Tip. Additional features are available when the mouse is right-clicked over some objects in the window. For example, in data tables, the Export option in the shortcut menu allows highlighted data to be quickly saved in various formats (as a clipboard object or an excel file). When working in the Modify Calibrations window, right-clicking within the Calibration Table, allows you to copy, cut, and paste data, and insert and delete rows in the table. When working in the User Calibration window, right-clicking over the graph allows you to create graph annotations, turn on and off auto-scaling, and save the graph. 38 TROUBLE-SHOOTING Observation Unable to initiate a measurement. Bottom line of display reads “Unstable Contact” after measurement. Bottom line of display reads “Insuffic. Fluid?” after measurement. Disagreement between OD Scanner and offline reference measurement Possible Causes (1) The instrument is in standby power mode. (2) The contact switches located above and below the Measurement Window must be simultaneously depressed against a vessel to initiate a measurement. Instrument was not held securely against vessel for the full duration of the measurement. (1) 3 cm (or more) depth of fluid not present in front of the Measurement Window. (2) Optical imperfections on the vessel surface make readings inconsistent across the Measurement Window. Suggested Remedies (1) Press the button. (2) Position the instrument against a vessel surface that is flat in at least one dimension. Align the contact switches along the flat dimension. If necessary, adjust your grip on the instrument and/or the vessel and retry. (1) Reposition the vessel so that more fluid is in front of the Measurement Window. See Determining Biomass, Step 3A. (2) Move to a more optically uniform area on the vessel (avoid labels and the bottom surface of vessels). (1) Incorrect calibration (1) Make sure the calibration selected. shown on the 2nd line of the (2) Incorrect baseline. display is correct. See (3) < 3 cm fluid in front of Determining Biomass, Step 2. measurement window. (2) Collect a baseline reading on (4) Vessel wall is nonthe media alone, using the same transparent or thickness vessel type as that used for the exceeds 5 mm. biomass measurement. See (5) Measurement was made Determining Biomass, Step 3A. while USB cable was attached (3) Place the sensor as close as to the instrument. possible to the bottom of the (6) Cell lysates are vessel and tilt the vessel only contributing significantly to enough to ensure there is fluid in the measured optical front of the entire sensor face. See reflectance. Determining Biomass, Step 3A. (4) Transfer to a different vessel, if possible. (5) Remove the USB cable and replace the USB Plug prior to measurement. 39 TROUBLE-SHOOTING, CONTINUED Observation Bottom line of display reads “Unstable Reading” after measurement. Possible Causes Excessive signal fluctuation was observed during the measurement. Verification test failed. (1) Incorrect User Calibration or Baseline was selected. (2) Dirt on window or verification cup. No instrument detected after pressing Search for Instruments in OD Scanner software window. (1) USB cable not connected. (2) USB driver was not correctly installed. (3) Firmware is locked up. Buttons in the OD Scanner software window are disabled. Instrument won’t accept new User Calibration Some buttons require a prior step to be performed before they become active. Instrument already has maximum number (16) of calibrations in memory. Laser fluctuation is too great for accurate measurement. Bottom line of display reads “Laser Unstable” after measurement. 40 Suggested Remedies (1) Stabilize the flask position and let settle for a few seconds before retrying. (2) Reduce ambient lighting conditions. (1) Make sure that the Baseline correction is off and the selected Calibration has a slope of 1. See Verification of Sensor Performance. (2) Clean the Sensor Window and/or Verification Cup. See Verification of Sensor Performance. (1) See Connecting to the Instrument. (2) See Software Installation and Appendix II. (3) See Reboot. Right-click on the button and select and read the “Description and Tip”. Delete one or more user calibrations. See Modifying Calibrations. Check the instrument using the Verification Cup (see Verification of Sensor Performance). TROUBLE-SHOOTING, CONTINUED Observation Bottom line of display reads “Laser Cal Failed”. Possible Causes The instrument is subjected to a dramatic change in ambient temperature or an ambient temperature that is beyond the allowed range. Instrument date or time is Fully draining the batteries, incorrect. changing time zones, daylight savings, clock drift, rebooting of the instrument firmware. Instrument won’t power Batteries are fully depleted. up. Instrument display is Firmware error. garbled or frozen. 41 Suggested Remedies (1) Place the instrument in an environment that meets the temperature requirements (see Specifications) and allow if to equilibrate for several minutes. (2) Reset the laser calibration to factory default values (see Reset). See Changing the Instrument Date and Time. See Charging the Batteries. See Reboot. End-User License Agreement IMPORTANT—READ CAREFULLY: This End-User License Agreement (“EULA”) is a legal agreement between you (either individually or a single entity) and BugLab LLC (“BugLab”). By installing, copying or otherwise using the OD Scanner software, you agree to be bound by the terms of this EULA. If you do not agree to the terms of this EULA, Buglab is unwilling to license the OD SCANNER software to you. In such an event, you may not use the OD SCANNER software and should contact BugLab for instructions on the return of the product for a full refund. Software Product License The OD SCANNER software is licensed, not sold. 1. GRANT OF LICENSE. This EULA grants you the following rights: Software Installation and Use. You may install and use two copies of the OD SCANNER software on two different computers. Back-up Copy. You may make one back-up copy solely for archival purposes. 2. DESCRIPTION OF OTHER RIGHTS AND LIMITATIONS: Limitations on Reverse Engineering, Decompilation and Disassembly. You may not reverse engineer, decompile or disassemble the OD SCANNER software. Rental. You may not rent, lease or lend the OD SCANNER software. Termination. Without prejudice to any other rights, BugLab may terminate your rights under this EULA if you fail to comply with the terms and conditions of this EULA. In such an event, you must destroy all copies of the OD SCANNER software. Trademarks. This EULA does not grant you any rights in connection with any trademarks or service marks of BugLab or its suppliers. 3. COPYRIGHT. All title and intellectual property rights in and to the OD SCANNER software are owned by BugLab. You may not copy the printed materials accompanying the OD SCANNER software. All rights not specifically granted under the EULA are reserved by BugLab. Do not make illegal copies of this software. 42 Appendix I. OD Scanner Specifications Performance Range of Biomass Sensitivity* Biomass Accuracy * (typical RMSE) Measurement Time Performance Verification Calibration to external reference standards Measurement storage Calibration storage Measurement Vessel Tested Materials Wall thickness Capacity (media filled to ≥20% of capacity) Required Fluid Volume * Determined for dry cell weight of 0.05 to >10 g/L <15% (biomass: 0.3-10 g/L) <0.05 g/L (biomass <0.3 g/L) <6 sec Verification cup Via user interface software up to 999 measurements up to 16 user calibrations Transparent Glass, PC, PET <5 mm 250-2000 mL ≥ 3 cm fluid depth in front of entire Measurement Window. Saccharomyces cerevisiae. Electrical Battery Properties Capacity Size Type Voltage Battery Charging DC Power In 2000 mAH 2 size AA Low self-discharging NiMH 2.4 V nominal 5V, <150 mA USB port on PC/laptop or wall plug adapter. <14 hours USB (also used for digital communication) Up to 1500 Serial digital via USB Charging source Charging time Connector Number of recharge cycles Digital Communication Communication/Charging Cable Connectors Length Standard Custom USB (A/B) 2m (~6’) up to 15m (~50’) 43 Environmental and Safety Operating Temperature Storage Temperature Operating and Storage Humidity Environmental Seals Laser Product Classification Certifications 15 to 40ºC (59 to 104ºF) -20 to 60ºC (-4 to 140ºF) 0 to 90% RH Yes – Splash Proof Class 1 CE marked. Tested for compliance to EMC standards EN613261:2006, ICES-003, and Part 15 of FCC Rules. Physical 8 mm (0.31”) 18 mm (0.71”) 186 mm (7.3”) 74 mm (2.9”) 50 mm (2.0”) 300 g (11 oz.) Measurement Window Width Measurement Window Height Overall Length Maximum Width Maximum Height Instrument Weight External Materials: Body Front face Keypad overlay Labels (main body, and ver. cup) Measurement window Pins, position sensing Screws, front face USB plug Verification cup Vessel Adapter Washers for Vessel Adapter 44 Green PC/PET blend Black hard-anodized Aluminum Polyester (top layer) Polyester (top layer) Vis-light-blocking Acrylic Brass with buna-N O-ring Stainless steel Aluminum with buna-N Orings Black Delrin with Kynar insert EASTAR 6763 resin PTFE Appendix II. Communication Trouble-Shooting If your OD Scanner instrument is not recognized by the User Interface software, the USB driver software may not have been installed correctly. The following procedure describes how to check and, if necessary, re-install the USB communication driver software. This procedures assumes that you have already installed the User Interface software (if not, first follow the steps in Software Installation). 1) 2) 3) Check to make sure that the driver was installed properly by checking the status in Device Manager: a. Make sure that your OD Scanner instrument is plugged into a USB port on your computer. b. Press the windows Start button and choose Control Panel. c. Locate and double-click on the “Device Manager” icon. d. Scroll down the devices to “Ports (COM & LPT)” and view the listed devices (by clicking on the windows expansion arrow). e. One of the listed ports should be “USB Serial Port (COMx)”, where x is an integer (e.g. “USB Serial Port (COM8)”). If no such device is listed, skip to step 3 below. f. Right-click on the USB Serial Port and select “Properties”. g. Click on the “General” tab. The “Device status” window should be displaying “This device is working properly”. If not, skip to step 2 below. h. Click on the “Driver” tab. The driver that is listed should be FTDI version 2.8.28.0. If it is not, proceed to step 2 below. If the device is not working properly or the wrong FTDI version is listed, uninstall the driver software: a. Disconnect the USB cable from the OD Scanner and the computer. b. Under the “Driver” tab, select “Uninstall”. c. In the Uninstall window that pops up, click on “Delete the driver software for this device” and hit “OK”. Install the driver: a. If you haven’t done so already, disconnect the USB cable from the OD Scanner and the computer. b. Go to the root directory where the OD Scanner software was installed. By default this is: “C:\Program Files\BugLab\OD Scanner” c. Within this folder double-click on the file named “CDM20828_Setup.exe”. d. In the pop-up window answer “Yes” to allow changes to your computer. e. A window entitled “FTDI CDM drivers” should open. Select “Extract”. f. The “Device Driver Installation Wizard” should automatically start. Select “Next” and wait for a confirmation that the driver was successfully installed. Select “Finish” to exit out of the Installation Wizard. 45 4) 5) Plug in the OD Scanner: a. Connect the USB cable to the OD Scanner and to the computer. b. You should see a windows message “Installing device driver”. c. Wait until a new message appears: “Device driver software installed successfully”. Start up the OD Scanner software and click on the “Search for Instrument(s)” button. END 46