1
Master's Thesis report 2010
d
Candidate: Ademu Victor Okpanachi
Title:Developing Advanced Control strategies for a 4-Tank Laboratory process
Faculty of Technology
Telemark University College
Address: Kjølnes Ring 56, N-3914 Porsgrunn, Norway, tel: +47 35 57 50 00, fax: +47 35 55 75 47
Lower Degree Programmes - M.Sc. Programmes - Ph.D. Programmes
d
TelemarkUniversityCollege
Faculty of Technology
M.Sc. Programme
MASTER'S THESIS, COURSE CODE FMH606
Student:
Thesis title:
Signature:
Number of pages:
Keywords:
Supervisor:
2nd Supervisor:
Censor:
External partners:
Availability:
Archive approval:
Ademu Victor Okpanachi
Developing Advanced Control strategies for a 4-Tank Laboratory process
............................................................................................................................
............71................................................................................................................
Multivariable system, four-tank process, estimation, Control strategies,
process interaction, multivariable transmission zeroes.
Hans-Petter Halvorsen, Telemark University College Norway.
............................................................................
............................................................................
............................................................................
............................................................................
...........................................................................
(supervisor signature):
sign.:...............................
sign.
sign.
sign.
sign.
sign.
date:
:
:
:
:
:
.....................
.....................
.....................
.....................
.....................
.....................
Abstract:
This thesis work is about developing and testing dierent control strategies for a four-tank
laboratory process. It aims at comparing the performances of the conventional Proportional
Integral controller with an advanced control strategy (Model Predictive Controller) on the
laboratory process. The four-tank laboratory process is a multivariable control system
consisting of four interconnected tanks, two pumps, two level sensors and two valves. A
simulator that is a prototype of the real process is designed based on the non-linear model
developed from physical data about the process. The linearized dynamics of the system has
a multivariable transmission zero that possibly moves along the real axis by changing the
valve position, giving it the minimum phase and non-phase operating points. The
Proportional Integral controller and Model-based Predictive Controller have been
implemented to control the system as well as the simulator respectively. A Kalman lter
estimator was implemented to estimate the levels of the tanks that were not measured, and
this estimates were satisfactory with the model measurements. It is then reliable to have the
estimator as a kind of back-up for situations of sensor failures.
The controllers are been compared with respect to their stability, inuence of process
interactions and time varying dynamics. And the model predictive controller is considered
more reliable regarding stability, in as much as it is dicult to tune. The changes in the
input variables are smoother in MPC. And it is able to detect, correct the eects as well as
inuences arising from process interaction. It is a good educational laboratory thesis written
to illustrate the eects of controllers on a multivariable process.
Telemark University College accepts no responsibility for results and conclusions presented in this report.
1
Contents
I Introduction and Theoritical studies
7
1 Introduction
8
1.1
Introduction . . . . . . . . . . . . . . . . . . . . . . . . . . . . . . . . . . . . . . . . . . . .
8
1.2
Objective
. . . . . . . . . . . . . . . . . . . . . . . . . . . . . . . . . . . . . . . . . . . . .
9
1.3
Background . . . . . . . . . . . . . . . . . . . . . . . . . . . . . . . . . . . . . . . . . . . .
9
2 Problem description
10
3 Theory
3.1
3.2
. . . . . . . . . . . . . . . . . . . . . . . . . . . . . . .
13
3.1.1
Bottom Reservoir . . . . . . . . . . . . . . . . . . . . . . . . . . . . . . . . . . . . .
14
3.1.2
Pumps . . . . . . . . . . . . . . . . . . . . . . . . . . . . . . . . . . . . . . . . . . .
15
3.1.3
Valves . . . . . . . . . . . . . . . . . . . . . . . . . . . . . . . . . . . . . . . . . . .
15
3.1.4
Level sensors
. . . . . . . . . . . . . . . . . . . . . . . . . . . . . . . . . . . . . . .
16
3.1.5
Data Acquisition-I/O device . . . . . . . . . . . . . . . . . . . . . . . . . . . . . . .
16
Physical Model . . . . . . . . . . . . . . . . . . . . . . . . . . . . . . . . . . . . . . . . . .
17
3.2.1
3.3
11
The Four-Tank laboratory Process
Linearization of non-linear models
. . . . . . . . . . . . . . . . . . . . . . . . . . .
18
Control System . . . . . . . . . . . . . . . . . . . . . . . . . . . . . . . . . . . . . . . . . .
20
3.3.1
20
Multivariable Control
. . . . . . . . . . . . . . . . . . . . . . . . . . . . . . . . . .
4 Control Strategies
4.1
4.2
4.3
22
Conventional PID Controller
. . . . . . . . . . . . . . . . . . . . . . . . . . . . . . . . . .
23
4.1.1
Control Modes of a PID Controller . . . . . . . . . . . . . . . . . . . . . . . . . . .
23
4.1.2
Tunning of the PID controller . . . . . . . . . . . . . . . . . . . . . . . . . . . . . .
24
4.1.3
Eect of Multivariable transmission zero . . . . . . . . . . . . . . . . . . . . . . . .
24
4.1.4
Right half-plane zeros of the four-tank process
. . . . . . . . . . . . . . . . . . . .
25
. . . . . . . . . . . . . . . . . . . . . . . . . . . . . . .
25
Model-based Predictive Controller
4.2.1
General Overview of the MPC
4.2.2
Calculation of the control actions . . . . . . . . . . . . . . . . . . . . . . . . . . . .
27
4.2.3
Optimization formulation
28
. . . . . . . . . . . . . . . . . . . . . . . . . . . . . . . .
26
4.2.3.1
Cost function . . . . . . . . . . . . . . . . . . . . . . . . . . . . . . . . . .
28
4.2.3.2
Constraints
29
4.2.3.3
Prediction Model
. . . . . . . . . . . . . . . . . . . . . . . . . . . . . . . . . .
. . . . . . . . . . . . . . . . . . . . . . . . . . . . . . .
29
. . . . . . . . . . . . . . . . . . . . . . . . . . . . . . . . . . . . . .
30
The Kalman Filter . . . . . . . . . . . . . . . . . . . . . . . . . . . . . . . . . . . .
30
4.3.1.1
32
Parameter Estimation
4.3.1
. . . . . . . . . . . . . . . . . . . . . . . . . . . . .
Implementation of the Kalman Filter
. . . . . . . . . . . . . . . . . . . .
II Implementation of control strategies
35
5 Implementation and results
36
6 Implementation of the PID Controller
38
6.1
Lowpass lter implementation . . . . . . . . . . . . . . . . . . . . . . . . . . . . . . . . . .
2
42
7 Implementation of the MPC
7.1
7.2
44
Selection of design and tuning parameters . . . . . . . . . . . . . . . . . . . . . . . . . . .
44
7.1.1
Sampling period and model horizon
. . . . . . . . . . . . . . . . . . . . . . . . . .
44
7.1.2
Control horizon . . . . . . . . . . . . . . . . . . . . . . . . . . . . . . . . . . . . . .
44
7.1.3
Prediction horizon
. . . . . . . . . . . . . . . . . . . . . . . . . . . . . . . . . . . .
44
7.1.4
Weighting matrices, Q and R . . . . . . . . . . . . . . . . . . . . . . . . . . . . . .
45
7.1.5
Reference trajectory
. . . . . . . . . . . . . . . . . . . . . . . . . . . . . . . . . . .
45
Creation of the MPC . . . . . . . . . . . . . . . . . . . . . . . . . . . . . . . . . . . . . . .
45
8 Discussions
8.1
51
Recommendation . . . . . . . . . . . . . . . . . . . . . . . . . . . . . . . . . . . . . . . . .
52
9 Conclusion
53
Bibliography
54
III Appendices
55
3
Preface
This thesis work is written as part of the requirements for the award of the Master's degree in Systems and
Control Engineering at the Telemark University College (Høgskolen i Telemark, Porsgrunn) in Norway.
The report is written based on the requirements for the development of Advanced Control strategies for
a 4-tank laboratory Process, that is meant to be used by undergraduate students' study of multivariable
process. The entire work has been carried out on the campus of Telemark University College (HiT). Some
of the necessary technical information and data's needed have been obtained from the previous bachelor
thesis report presented for the designed 4-tank laboratory Process . The entire implementation has been
done using LabVIEW 2009 and the labVIEW codes are attached in the Appendix (Part III) of the report.
I would like to thank my supervisor, Hans-Petter Halvorsen at the Department of Electrical, Information Technology and Cybernetics for his kinded advices and suggestions during my masters thesis. His
ideas have been a great motivation.
My special thanks to Associate Professor Finn Haugen and Associate Professor David Di Ruscio for
all the fruitful conversations, email correspondences, and their patience to answer my questions even on
very tight schedules.
Porsgrunn, June 2010.
Ademu, Victor Okpanachi.
4
List of Figures
3.1
Schematic of feedback control using a PID.
. . . . . . . . . . . . . . . . . . . . . . . . . .
12
3.2
Simplied block diagram of feedforward control. . . . . . . . . . . . . . . . . . . . . . . . .
12
3.3
Typical four-tank laboratory process.
3.4
P&ID schematic of the 4-Tank laboratory process (Gøthesen Dan-Krister and Semb, 2009)
3.5
Signal ow of the pumps.
. . . . . . . . . . . . . . . . . . . . . . . . . . . . . . . . . . . .
15
3.6
Signal ow of the valves. . . . . . . . . . . . . . . . . . . . . . . . . . . . . . . . . . . . . .
16
3.7
Signal ow of the Level sensors. . . . . . . . . . . . . . . . . . . . . . . . . . . . . . . . . .
16
3.8
USB-6008 I/O.
17
3.9
Block diagram illustrating data communication.
. . . . . . . . . . . . . . . . . . . . . . . . . . . . .
. . . . . . . . . . . . . . . . . . . . . . . . . . . . . . . . . . . . . . . . . .
. . . . . . . . . . . . . . . . . . . . . . .
13
14
17
3.10 Schematic diagram of the multivariable control system . . . . . . . . . . . . . . . . . . . .
21
3.11 MIMO system . . . . . . . . . . . . . . . . . . . . . . . . . . . . . . . . . . . . . . . . . . .
21
4.1
Block diagram of the model predictive control(Seborg E. Dale and Mellichamp, 2003).
26
4.2
Concepts of Prediction and Control horizon in MPC(Seborg E. Dale and Mellichamp, 2003). 27
4.3
Flow chart for MPC calculations
4.4
Kalman Gain block.
4.5
Kalman lter LabVIEW program.
4.6
Kalman lter Estimation of the 4 levels in the Real process
4.7
Simulator tank levels corresponding to the Estimated and Measured levels of real process
6.1
Minimum phase process and control signal (Model).
. . . . . . . . . . . . . . . . . . . . .
39
6.2
Non-minimum phase process (model) . . . . . . . . . . . . . . . . . . . . . . . . . . . . . .
40
6.3
Minimum- phase operating condition (Real process)
41
6.4
Non-minimum phase operating condition (Real process)
7.1
Prediction and control horizon
7.2
Specied MPC constraints.
7.3
Controller action in minimum phase operating condition
7.4
Second control loop adjusting for setpoint change in other loop
7.5
Controller action in non-minimum phase operating condition
7.6
Second control loop adjusting for setpoint change in non-minimum phase
. .
. . . . . . . . . . . . . . . . . . . . . . . . . . . . . . . .
28
. . . . . . . . . . . . . . . . . . . . . . . . . . . . . . . . . . . . . . .
33
. . . . . . . . . . . . . . . . . . . . . . . . . . . . . . .
. . . . . . . . . . . . . . . . .
. . . . . . . . . . . . . . . . . . . . .
. . . . . . . . . . . . . . . . . . .
33
34
34
42
. . . . . . . . . . . . . . . . . . . . . . . . . . . . . . . . .
45
. . . . . . . . . . . . . . . . . . . . . . . . . . . . . . . . . . .
46
5
. . . . . . . . . . . . . . . . . .
47
. . . . . . . . . . . . . . .
48
. . . . . . . . . . . . . . . .
49
. . . . . . . . .
50
List of Tables
3.1
Nominal Operating Conditions and Parameter values.
4.1
Controller parameters using Ziegler-Nichols' method.(Haugen, 2004b)
. . . . . . . . . . .
24
5.1
NI USB-6008 allocation. . . . . . . . . . . . . . . . . . . . . . . . . . . . . . . . . . . . . .
36
5.2
Devices and Scaling in Systems . . . . . . . . . . . . . . . . . . . . . . . . . . . . . . . . .
37
6.1
Parameter values for minimum and non-minimum phase operating points. . . . . . . . . .
38
6
. . . . . . . . . . . . . . . . . . . .
19
Part I
Introduction and Theoritical studies
7
Chapter 1
Introduction
1.1 Introduction
The application of controllers in the process industry has dated far back as before the
19400 s when John G.
Zeigler and Nathaniel Nichols started their pioneer research about the behaviours of controllers as well as
trying to develop good methods to be used in the tunning of the controller parameters. Afterwards, more
recent advances in the application of control theory emerged as a result of various problems that needed
to be resolved.
A good example of recent control advancement is the use of optimal control methods
that are formulated using the state-space models
1 , and other varying formulations that are based on
the process model (step and impulse responses), disturbance type (altered white noise, decaying and
constant) as well as adaptation to time varying models. There is usually an optimal balance between the
control error and the amount of control power used, and certain optimal criterion are being minimized
in this case of optimal solution.
As at the
1980's,
when the rst set of commercial adaptive PID controllers were introduced into the
market, they were made such that the process model is continually estimated and the PID parameters
been adjusted automatically from the model(Haugen, 2004b). And getting into the middle of
1980's, there
have been so much industry interest on the use of advanced control strategies. The requirements for these
advanced strategies are because of the various changes arising in the petrochemical industry, very strict
environmental regulations and the incorporation of intelligent safety systems. The industry, then pave its
way into acquiring reliable advanced control strategies with the ability to integrate the requirements to
reduce operating costs, use energy resources eectively whilst reducing environmental emissions as well.
Developing ecient control strategies that would be well suited for the control of multivariable systems
has been quite challenging in many areas of engineering due to the cost and large amount of time spent
on model identication. It is very important to have a prototype of the real process, so that the controller
will inherently have knowledge about the process it will control.
According to (Ogunnaike and Ray, 1994), model identication is clearly the Achilles heel of modelbased controller design. And the total time spent on identifying the model most times could be more than
half of the project time. Accurate dynamic models that will enhance the performance of a model-based
controller is so challenging and if not found, will so much inhibit the performance of the controller.
It is assumed that Model-based predictive controller (as MPC) would be preferred for most of the
dicult control problems in the process and petrochemical industries, since it has so much impact on most
industrial controls. The increased industries interest to use advanced control strategies which are robust
and capable of achieving improved performance of complex industrial processes that are multivariable in
nature, has made it an area of concern in the academia. And the engineering undergraduates and researchers, while in the quest for more understanding of the rigorous mathematics and modeling principles
studied with pen and paper, they seem to get more knowledge and understanding of the behaviors of the
complex industrial processes by performing experiments and at the same time making judgments with
their own prior ideas.
This report starts with some basic theoritical concepts of control system that are quite relevant
to designing control strategy in Chapter 3.
The development of non-linear models of the four-tank
laboratory process, its linearization were also carried out in Chapter 3. In chapter 4, the description of
control strategies to be implemented are discussed with regards to their eects and possible challenges
as applied to the this multivariable process. There is also the possible estimation of unmeasured levels
of the process in Chapter 4. In Chapter 5, a brief description of the interconnectivity of implemented
1 State-space
model: State-space model is a set of rst order dierential equations that are used in describing a system.
8
strategies with the physical process is described as well as allocation of the Input-Output device channels
respectively.
In Chapter 6, the implementation of the PI controller with focus on its performances at
varying operating points were done. At Chapter 7, the Model Predictive Controller is implemented and
the parameters required for its optimum performance been identied. In Chapter 8, the entire project
involvement, ndings from the implemented strategies as applied to the process and general evaluation of
these strategies are highlighted. And Chapter 9 is a concise description of the results and achievements
in this thesis work.
1.2 Objective
In this thesis work, the objective is to develop and test dierent control strategies on a four-tank laboratory
process in order to achieve good performance and stability in the system. It is required and expected that
the implemented control strategies be able to handle the multivariable system eectively not minding any
process limitation. The implemented strategies would be compared, that is the model predictive controller
(MPC) and the PID controller and their various performances would be analysed. And since the interests
is to analyse the implemented strategies and making it available for further studies such that would enrich
the users hands on experience, it is then important to make the implemented program more user friendly
as regards the user interfaces. Also, a simple and detailed User training Kit is provided as in Appendix
2, this is to give the users of the program good guidance on handling the strategies. On the long run,
using a training kit or manual would help in the teaching of the advanced control strategy and will also
improve the learning abilities of the users concerned.
1.3 Background
Alot of industries in the late 1980s suddenly developed so much interest in applying multivariable control
techniques which was due to the growing complexity in their plants, and the performance of conventional PID controller which has solely governed the control of the process industry was becoming limited.
The adoption of the advanced strategies is to enhance the achievement of improved performances in the
complex industrial process plants. Therefore, making it enough reason to include multivariable control
teaching in undergraduate and postgraduate study curricula in the 1990s.
It emphatically promoted
the research areas of linear and non-linear design methods. It was deemed very important that a good
automation and control engineering study be accompanied by some hands-on practical experiments. According to Johansson, et al.(2009) in 1990s, it became necessarily challenging to illustrate multivariable
performances in feedback systems that would describe the process industry. There are quite some examples of multivariable laboratory processes which are available on commercial purposes like; Educational
Control products in the US, Feedback Instruments and TecQuipment in U.K. Some of the product vendours have immensly made the awareness of the advanced strategies such that they have almost become
the standards in petrochemical, chemical, rening, food processing and pulp paper.
In Johansson, et
al. (2009), the development and design of the 4-tank laboratory process is described such that it is very
suitable for teaching the fundamentals of multivariable control. Also, in Dan-Krister et al. (2009), the
4-tank laboratory process is built by a group of undergraduate students as their bachelor project and is
the main start up point for this thesis work.
This laboratory process is a prototype of a real life process plant. It consists of two pumps which are
used in conveying water from the reservoir underneath to the four tanks in the overhead. There is drain
from the upper two tanks into the lower two tanks. The pipes in here are connected such that each pump
has an eect on the level of both measured tanks. The target here is to control the water levels in the two
lower tanks using the two pumps. The control of the water levels in the two lower tanks was achieved by
two (2) PID controllers. This thesis is focused on extending the control of these levels by more advanced
control strategy, evaluating the strategies for the most procient and to provide documented directives
and suggestions on the usage of the developed programs.
9
Chapter 2
Problem description
The concept of developing advanced control strategies for a 4-tank laboratory process that would be
used in undergraduate study to facilitate the knowledge of multivariable control system on a small-scale
process, is a prototype of a complex real life situation. Considering the importance of good understanding
of the interconnectivity between the connected process, how measurement techniques with the required
hardware components as well as the various control algorithms are developed. Regulation and ow levels
are quite familiar problems that attract much attention in the process industries, water supply systems
and the petrochemical industry. Mostly, in uid transport and storage scenarios that require level control,
there is a kind of interaction between the connected tanks and the level needs to be properly controlled.
The main idea of this work is to develop mathematical model and strategies for the 4-tank laboratory
process as well as controlling the water levels in the tanks. Although, the water levels in the upper tanks
seems to be disturbances to the measured level in the lower tanks.
This 4-tank laboratory process consists of two double-tank processes, with two pumps, two level
sensors on the lower tanks as well as two valves that are used in determining the ow ratios in the
apparatus.
Some of the goals of this thesis work are listed here but formal documentation is in Appendix 1;;
1. Designing and testing of control strategies to illustrate their performances and reliabilities.
2. Comparison of the prociencies of developed strategies.
3. Documentation of appropriate Training Kit that would be a study guide for further teaching and
use of the designed laboratory unit.
The laboratory process has greatly exhibited interesting characteristics within the process industry and
research of advanced control strategies, hence the use of a training kit or user manual alongside conventional computer-aids in teaching cannot be underestimated since it provides very much easier and
more users' friendly means of understanding the various control system strategies.
The incorporation
1 2009 enhances the
of training kit/ user manual and interactive graphical tools based on LabVIEW
learning abilities of the users.
It would be a forum for an easy way of comprehending some concepts as linearization, eects of time
delay and eects of nonlinearities, which have all been modeled to help the students or learners to have
ideas about the behavior of complex systems as this 4-tank laboratory process. Having a training kit for
the process, is a very good check on the students or learners as they always try to practice their ideas
while interacting with the process.
1 LabVIEW: Is an abbreviation for Laboratory Virtual Instrumentation Engineering Workbench;, which is a development system used for experimental, industrial, and educational measurement and automation applications solely based on
graphical programming. And it is produced by National Instrument.
10
Chapter 3
Theory
In the implementation of various control strategies ranging from the conventional PID controller to the
advanced control strategy (MPC) as applied in the multivariable systems of process control industries, it
is appreciated to have a very good approach for familiarizing the automation and control scholars with the
control structures commonly used in modern process control industries. Hence, dierent control concepts
is expected to be found on the nger tips of the control students and/or engineers.
According to (DiRuscio, 2008), if we want the output of say
to a setpoint value,
r,
y
of a steady state process to be close
then we may simply use a feedback control strategy with an Integral (I) controller
in the feedback loop. The real world processes usually are not static, but could be approximated as a
steady state (static) process. Hence, a PI controller is used instead of an Ideal Integral controller. An
example is this case of designing local or advanced controller for the control actuator itself. Consider a
u is the pump opening and y is the mass ow out of the
y as a function that describes the behaviour of the pump.
ow controller where
reasonable to model
pump. It would then be
Some useful concepts and terminologies used in this thesis work are as follows;
1.
Variables;
Manipulated variables: These are usually the ow rate that are entering or leaving a process
that is controlled in order to control a process. In this case, the manipulated variables are the
valve positioning and the pump ow rates.
Controlled variables: This is the level in the process that we are trying to control, which could
either be to keep it constant or make it follow a desired manner.
Load disturbances: This is usually the ow rate that is entering the 4-tank process. They are
usually set by the upstream or downstream parts of the process which is at the valve position.
And our control system should be designed in such a way as to keep the 4-tank process under
controlled not been inuenced by the disturbances.
2.
Dynamics; This is regarded as the time-dependent behavior of the process.
Although when there
is a controller in the process, the behavior would be regarded as a closed loop response. When
there is no controller in the system, it is termed open loop response(Luyben and Luyben, 1997)
3.
Feedback Control; This is regarded as the very common way of controlling a process by measuring
the variable meant to be controlled, comparing its value to a reference value (that is the set point
or reference of the controller) and the dierence (error) sent into a feedback controller which is
responsible for altering the manipulated variable that helps drives the controlled variable to the
specied value. Feedback controller always tries to correct the process value after a disturbance has
made utterances and a non-zero error signal has been generated. See Figure 3.1 for a schematic
illustration.
11
Figure 3.1: Schematic of feedback control using a PID.
4.
Feedforward Control;
This is mostly utilized in situations where the feedback control is not
satisfactory, so the feedforward control is meant to act as an additive to the feedback controller
in order to achieve a signicant improvement in the control system.The adjustment of the control
variable is not error-based, it is rather on the knowledge of the process in terms of its mathematical
model as well as the measurements obtained from the disturbances to the process.
Feedforward
control is made very eective by the addition of measured or estimated disturbances in the system,
for example the ows from the two upper tanks.
Hence, the main variables that could possibly
be used as feedforward control parameters are the ows from tanks
3
and
4.
See Figure 3.2 for
illustration of feedforward control.
Figure 3.2: Simplied block diagram of feedforward control.
It is a fundamental requirement that the disturbances be measured or estimated (i.e.
Kalman Filter, State observer etc).
In advanced control strategies as the MPC
using the
1 and LQC2 , the
feedforward control from the reference is very much involved. Some frequently associated challenges
with the Feedforward control technique are;
Diculty in measuring the disturbance variables on-line.
The availability of an approximate model of the process as the quality of the feedforward
control is dependent on the process model.
5.
Multi-loop control;
In this case, each of the manipulated variables depend on only a single
controlled variable. i.e. a set of conventional feedback controllers.
1 Model
2 Linear
Predictive Controller
Quadratic Controller
12
6.
Process Interactions and Control loop Interactions;
In MIMO
3 systems, the control prob-
4
lem is actually more complex than in SISO systems. This is a resulting eect from the process
interactions that occurs between the manipulated and the controlled variables. Thus, any change
in a manipulated variable like
u1 ,
will aect all the controlled variables in the process. Due to this
process interactions, the choice of the best pairing of the controlled and the manipulable variables
for a multiloop control scheme becomes dicult. So, for any control problem having
variables and
7.
n
manipulated variables, there is
Decoupling control;
n
n
controlled
multiloop control congurations.
This is one of the early approaches to multivariable control that is imple-
mented by having additional controllers called decouplers in a conventional multiloop conguration.
It is aimed at reducing control loop interactions. Other types of decoupling control methods are,
partial decoupling and static decoupling and there are dierent situations in which their implementations are benecial. Some of the important benets of implementing decoupling control schemes
are;
The change of set-point for one controlled variable do not aect other controlled variables.
It helps in eliminating control loop interactions. Hence, the stability of the closed-loop system is
determined solely by the stability characteristics of the individual feedback control loops.
3.1 The Four-Tank laboratory Process
The conceptualization of the 4-tank process as a multivariable control entity is originally proposed by
(Johansson, 2000) and it is made up of four interconnected tanks in two (2) pairs each, two (2) pumps,
two (2) valves and two (2) level sensors connected to the two (2) lower tanks, see Figures 3.3 and 3.4 for
clarications.
Figure 3.3: Typical four-tank laboratory process.
Pump 1 (LCP01) extracts water from the reservoir beneath the system and pours into tank 1 and
tank 4, while Pump 2 (LCP02) pours into tank 2 and tank 3. The voltages to the two (2) valves (LCV01
and LCV02) as in Figure 3.4 are manipulated such that they determine the proportion of the ow that
goes into any of the tanks pair. The output ow from the pumps (LCP01 and LCP02) are splitted into
two by using the three-way valve.
The proportion of the output ow into the tanks is determined or
controlled by the valves position, as any change in the valve position will alter the quantity or proportion
of ow into the tanks. The regulation of this process is designed using a PI controller, but it has been
concluded based on several researches that the splitting of water ow from the pump into all the four (4)
3 MIMO: Multiple input-Multiple
4 SISO: Single input-Single ouput
output
13
tanks causes process interactions and control loop interactions. In Figure 3.4, T1, T2, T3 and T4 are the
abbreviations for Tank 1, Tank 2, Tank 3 and Tank 4 respectively to suit the schematic diagram.
The selection of equipments and devices that makes up the complete four (4)-tank laboratory process
is based on its requirements for portability, ecient design robustness and functionality. It consists of a
bottom reservoir with a plant surface as described earlier. See Figures 3.8 and 3.4 for clarication and
the devices are further explained in the next sections.
Figure 3.4: P&ID schematic of the 4-Tank laboratory process (Gøthesen Dan-Krister and Semb, 2009)
3.1.1 Bottom Reservoir
The four-tank system has been built such away that the plant surface can be attached to the bottom
reservoir to form a briefcase giving it a high sense of portability. The reservoir and plant surfaces have
all been designed with Aluminium giving it very light weight and resistance to corrosion and rust that
could result from water reactions. The bottom reservoir consists of two compactments, a water reservoir
containing majority of water and a smaller room where two (2) pumps are positioned in the water adjacent
to themselves as in the lower part of Figure 3.4 and Figure 3.3 respectively. The small pump room has a
thick glass plate which serves as a lid for the room, and plant interface is a standing body with aluminium
disc on both front and back.
14
3.1.2 Pumps
The pumps used in this equipment are two Johnson impeller pumps labelled LCP01 and LCP02 in Figure
3.4 respectively.
They are
12[V ]
DC pumps being regulated from
0[V ]
to
12[V ]
using self-produced
ampliers. The pumps are positioned separately in the smaller compactment of the water reservoir, and
are beneath the water level in the reservoir.
Designing the process facility in this way helps to avoid
problems of air pumps, the impeller pumps has the disadvantage that they do not work while having
air in the system. Other challenge with this pumps is that they need to have a certain rotation speed
for lifting the water up to the desired height. The adjustment range of the pumps is in practice within
6.5[V ] − 12[V ].
Since the signal for controlling the pumps is
two ampliers to amplify the
0[V ] − 5[V ]
0[V ] − 12[V ],
(2) ampliers are built in , and these ampliers each needs voltage supply
necessary equipments for sucient signal conditioning are;
2 × 0 − 12[V ]
2×
2×
+15[V ]
and
two
The
DC pumps.
Ampliers for converting
−15[V ]
it is then required to use
0[V ] − 12[V ]. Hence,
of −15[V ] and +15[V ].
signals from the USB devices to
0 − 5[V ]
to
0 − 12[V ]
DC voltage supplies to ampliers.
Analogue outputs in the I/O devices.
The pumps are controlled from the LabVIEW program user interface by setting the controller output
within
0 − 100%
which corresponds to
illustrated in Figure 3.5.
0 − 12[V ]
signal to the pump. The signal ow of the pumps is
Figure 3.5: Signal ow of the pumps.
3.1.3 Valves
The water from the pumps is distributed to the four (4) tanks by the two three-way valves. The valves are
adjusted linearly from small opening to fully open positions, and they are controlled from the LabVIEW
user interface. Considering these properties, two Samson three-way valves with electrical actuators have
been chosen having labels of LCV01 and LCV02 as in Figure 3.4. The control signal controls the opening
0 − 5[V ]. The supply
0−24[V ] AC, and the response signals in the range of 0−5[V ] indicates the position
of the valve position between the two (2) tanks, and these signals to the valves are
voltage to the valves is
of the valves. They are monitored and controlled using the USB devices. The necessary requirements for
the valve signal conditioning are as follows;
2 × 0 − 5[V ]
control signal to valves.
2 × 0 − 5[V ]
feedback signal from the valves.
24[V ]
AC power supply to the valves.
2×
USB analogue inputs that monitors the valve positions.
2×
USB analogue outputs used for controlling the valves.
The signal ow of the valves is illustrated in Figure 3.6.
15
Figure 3.6: Signal ow of the valves.
3.1.4 Level sensors
The measurement of the levels in the two lower tanks (tank 1 and tank 2) are much of interest. Although
the size and transparency of the tanks puts requirement for the design of the sensors.
There are two
Screw type pressure transmitters from BD Sensors with labels of LCT01 and LCT02 in Figure 3.4. The
measurement range of these sensors is
0 − 40[mbar]
corresponding to
0 − 400[mmH2 o],
this is within
acceptable accuracy limits of the process. In the report by Gøthesen et al.(2009) , the pressure gauges
give out 4 − 20[mA] current signal, meaning that the signals from pressure gauges will only vary within
4 − 12[mA] . Also, considering the fact that the analogue input of the I/O device been used is to enable
the reading of the voltage signals, thus a 500Ω resistor is inserted in the circuit. The voltage across the
resistor will vary between 2 − 6[V ], hence the voltage level in LabVIEW is scaled between 0 − 20[cm]
of the tanks height. The level of the bottom two tanks are shown graphically in LabVIEW. The level
sensors require
12 − 36[V ]
2 × 0 − 40[mbar]
2 × 500Ω
24[V ]
DC supply. The signal conditioning requirements for the sensors are;
pressure sensors of
4 − 20[mA].
resistor.
DC supply.
The signal ow of the Level sensors is illustrated in Figure 3.7.
Figure 3.7: Signal ow of the Level sensors.
3.1.5 Data Acquisition-I/O device
The data communication with the four-tank laboratory process and the computer takes place through
the two NI USB-6008 devices. The USB-6008 devices have Analogue Inputs and Analogue Outputs and
5 and two A/Os6 , one
both are used as required, see Figure 3.8. Each of the USB devices has four A/Is
(1) A/I and two (2) A/Os are used from each of the USB devices. And they are congured using the
7 application.
MAX
5 A/Is: Analogue Inputs
6 A/Os: Analogue Outputs
7 MAX: Measurement and Automation
eXplorer
16
Figure 3.8: USB-6008 I/O.
For Analogue Inputs:
2 − 6[V ]
from the Level sensors 1 and 2 which indicates the levels in tank 1 and tank 2 respectively.
1.
0 − 5[V ]
which is for controlling ows from pumps 1 and 2.
2.
0 − 5[V ]
which is used for controlling position of valves 1 and 2.
1.
For Analogue Outputs:
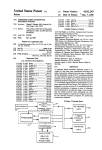
Figure 3.9: Block diagram illustrating data communication.
The block diagram illustrating the data communication between the computer and the process is
shown in Figure 3.9. In order for LabVIEW to access data from the USB-6008 devices, tasks are set in
National Instrument's Measurement and Automation Explorer (MAX).
3.2 Physical Model
In deriving the mathematical model for the four-tank process from physical data, while having on mind
that the target is the control of the levels in the two lower tanks. There is just one way of developing
the model of the liquid interaction in the 4-tank process, and the model would be simulated in order to
compare the simulation result with the real process result. The inputs to the process (input voltages to
the pumps) are designated as
as
y1
and
y2
v1
and
v2 ; while the outputs which are levels to be controlled are designated
respectively (the voltages from level measurement sensors). If we consider the mass balance
for just one of the tanks as reported by (Johansson, 2000), we have;
A
dh
= −qout + qin
dt
17
(3.1)
Where
A
is the cross-sectional area of the tank,
h≥0
cross-sectional area of the outlet hole and
g
qin√≥ 0 and qout ≥ 0
qout = a 2gh , where a is
is the water level,
the inow and outow of the tank respectively. Bernoulli's law yields;
are
the
is the acceleration due to gravity. The ow from each of the
pumps is splitted proportional to the valve position setting, see Figure 3.4. Assuming the ow generated
by any of the pumps is proportional to its applied voltage
qU be the ow into the upper tank.
qL = γkv, qU = (1 − γ)kv, γ ∈ [0, 1].
and
v,
and let
qL
be the ow into the lower tank
Therefore,
Now, the mass balace and the Bernoulli's law are extended to other tanks to obtain a non-linear model
which is described by the system dierential equations as follows;
a3 p
γ1 k1
−a1 p
dh1
2gh1 +
2gh3 +
=
v1
dt
A1
A1
A1
(3.2)
a4 p
γ2 k2
dh2
−a2 p
2gh2 +
2gh4 +
=
v2
dt
A2
A2
A2
(3.3)
dh3
−a3 p
(1 − γ2 )k2
=
2gh3 +
v2
dt
A3
A3
(3.4)
dh4
−a4 p
(1 − γ1 )k1
=
2gh4 +
v1
dt
A4
A4
(3.5)
Where the parameters used above are;
Ai
ai
hi
vi
k i vi
g
cross-sectional area of Tank
i
cross-sectional area of the outlet hole
the water level in Tank
voltage applied to pump
ow from pump
i
i
i
acceleration due to gravity
Usually, there is a structured way of writting dierential equations for a system which is known as
the state-space model.
It is mostly seen as an end to requirements for block diagram constructions,
linearization of non-linear models, calculating time-responses ranging from analytical to numerical methods (Haugen, 2004a). It is also regarded as a very important tool in Observability and Controllability
analysis, the design of control strategies as Optimal control, Model-based predictive control as well as
designing estimators as the Kalman lter. A general and compact form of the state-space model is;
Where
ẋ = Ax + Bu
(3.6)
y = Cx + Du
(3.7)
x is the state vector and u the input vector to the system. A is refered to as the system matrix,
and it is usually a square matrix. In this case of the 4-tank laboratory process, the system has four state
variables,
u
h1 , h2 , h3
and
h4 , which are denoted as x. The two input variables, v1 and v2 , are denoted as
D = 0 , Equations (3.2, 3.3, 3.4 and 3.5) can be written on a matrix-vector
correspondingly. Matrix
form that corresponds to Equations (3.6) and (3.7).
3.2.1 Linearization of non-linear models
In order to enhance procient stability analysis and controller design, it is necessary to linearize the model
such a way that approximates the original non-linear model.
Now, the non-linear model of Equations
(3.2, 3.3, 3.4 and 3.5) can be linearized around the chosen working point given by the level in the tanks
h01 , h02 , h03 and h04
as in 3.1. A deviation state-space model form of
control variables would be
ui = vi −
vi0 as well.
18
xi = hi − h0i
is considered, while the
Table 3.1: Nominal Operating Conditions and Parameter values.
Symbol
State/Parameters
Values
h01 , h02 , h03 , h04 [cm]
v10 , v20 [V ]
Ai [cm2 ]
ai [cm2 ]
γi
ki [cm3 /V s]
g[cm/s2 ]
Ti [s]
Nominal levels
11.8, 12.5, 5.5, 9.5
3.75, 3.75
28
0.16, 0.13, 0.16, 0.13
0.4, 0.4
0.67, 0.74
981
27.78, 35.56, 18.54, 30.94
Nominal pump settings
Areas of the tanks
Area of the drain in tank
i
Ratio of ows in the valves
Pump proportionality constant
Gravitational constant
Time constant in the linearized model
Thus, with the application of the Taylor series; a linearized state-space model for Equations (3.2, 3.3,
3.4 and 3.5) is presented in Equation (3.8) and (3.9) respectively:
− T11
0
ẋ =
0
0
a3
a 1 T3
0
− T12
0
0
0
a4
a2 T4
0
− T13
0
0
− T14
kc
0
y=
Where
x =
h1
h2
h3
h4
T
constant that is usually choosen to
x +
0
kc
γ1 k1
A1
0 0
0 0
0
0
(1−γ1 )k1
A4
0
γ2 k2
A2
(1−γ2 )k2
A3
u
(3.8)
0
x
(3.9)
T
T
h1 h2
u = v1 v2
and y =
, also kc is a calibration
be 1. And the time constants for the tanks Ti , are found by the
,
expression given in (3.10).
Ai
Ti =
ai
s
2h0i
, f ori = 1, ..4
g
(3.10)
γ1 , γ2 ∈ [0, 1] are determined from the valves setting before the startup of an experiment for tanks 2
3 and corresponding Tanks 1 and 4 respectively. Also, the measured level signals are y1 = kc h1 and
y2 = kc h2 . The level sensors are calibrated such that, kc = kc = 1 . The amount of ow that goes into
tank 1 is γ1 k1 v1 and the ow to tank 4 is (1 − γ1 )k1 v1 . Likewise the ow to Tank 2 is γ2 k2 v2 and the
ow to Tank 3 is (1 − γ2 )k2 v2 .
and
In the reports by (Numsomran A, 2008) and (Johansson, 2000), the linear transfer function matrix is
calculated for the four-tank process as follows;
y1 (s)
y2 (s)
= G(s) ×
u1 (s)
u2 (s)
(3.11)
G(s) = C(sI − A)−1 B
G(s) =
"
G(s) =
Where
and
Ti
c11 = (T1 k1 kc /A1 )
,
g11 (s) g12 (s)
g21 (s) g22 (s)
γ1 c11
(T1 s+1)
(1−γ1 )c21
(T2 s+1)(T4 s+1)
(3.12)
(1−γ2 )c12
(T1 s+1)(T3 s+1)
γ2 c22
(T2 s+1)
(3.13)
#
(3.14)
c12 = (a3 T1 k2 kc /a1 A3 ), c21 = (a4 T2 k1 kc /a2 A4 )and c22 = (T2 k2 kc /A2 )
is as dened in Equation (3.10).
The four (4) process transfer functions that comprises of the system transfer function as in (3.14), is a
complete characteristics of the dynamics of the system. For the fact that it is a two input by two output
control problem with four states, the transfer function is used to determine how any change in either
u1 (v1 )
or
u2 (v2 )
aects the system outputs
y1 (h1 )
or
y2 (h2 ).
According to the principle of superposition
as stated in (Seborg E. Dale and Mellichamp, 2003), simultaneous changes in
u1
and
u2
have a kind
of additive eect on each controlled variable. Thus, the input-output relations considering the transfer
function becomes as follows;
y1 (s) = g11 (s).u1 (s) + g12 (s).u2 (s)
19
(3.15)
y2 (2) = g21 (s).u1 (s) + g22 (s).u2 (s)
(3.16)
Also, the vector-matrix notation of these two (2) input-output relations is equivalent to (3.11). In this
control scheme of the four-tank process,
by the adjustment of
u2 .
y1 is
controlled by the adjustment of
u1 and y2
is also controlled
There is also an indication that process interactions can cause undersirable
interactions between the control loops. Assuming a disturbance moves
y1 from
its setpoint, the following
events would arise:
The controller for loop 1 adjusts
the transfer function
For the fact that
y2 back
g12 .
u1 in order to force y1
back to the setpoint, also
u1 aects y2
through
g21 .
y2 has
been altered, loop 2 controller would also adjust
to its setpoint. All thesame, any change in
u2
will aect
y1
u2
ensuring that it brings
through the transfer function
These controller actions continues simultaneously about when a steady state is attained..
3.3 Control System
The incorporation of Control system into already designed real plants or prototypes of chemical process
plants originally evolved from the basic fact that everything in the world is changing continuously. This
has given us the idea of the dynamic nature of the process plants. For large-scale; continuous plants like
the chemical process plants in which a lot of process variables are measured very frequently, in order to
have a guaranteed continual safe and optimized operation, it is very important that these many process
variables be eectively controlled. Hence, the fundamental reason for developing control system.
Choosing a Control strategy and how it is designed are mostly dependent on our knowledge of the
process, experience gained as well as insight. And for the control system to work eectively, some of the
settings on the controller need to be adjusted, and this is termed Controller tuning .
This tuning is
usually best achieved by a trial and error approach most times.
In this thesis, a model of the 4-tank process has been developed, and it is been used in a simulator to
evaluate control strategies and their comparative eciencies. An example, is a situation where important
measurement changes value erratically and continuously. Like the bubbling of water, overow of water
in the 4-tank laboratory process.
In this multivariable process, the most important reason for control, is to keep the level of the two lower
tanks at a desired level, although disturbances to this system is the ow from the two upper tanks in the
equipment. And these disturbances are actually undesirable, so there is very much need for the controller
to be adjusted in order to compensate for its inuence on the systems' output. These disturbances could
be determined by adjusting the two connected valves in the 4-tank process.
3.3.1 Multivariable Control
The existence of almost all complex chemical and industrial process plants are quit best described using
the multivariable system. Although these system variables could be interacting or non-interacting in some
cases, and the idea of using multiple single-loop controllers is one of the earliest methods that have been
employed in the industrial control systems. Its structure appears simple and easy to understand.
In the four-tank multivariable process, there are some control variables that are adjusted or manipulated to keep the dierent levels of the tank process at a setpoint of interest. The control variables in this
case are the pump
1
and pump
2
voltage values which are derived from the controller outputs, as well as
the two valve positions. There are sensor measurements from the tanks which enables us to evaluate the
system's performance.
In (Seborg E. Dale and Mellichamp, 2003) and reports by Johansson et al. (2009), there are good
descriptions of procient approaches for controlling such a multivariable process.
Control methods as
Decoupling and the Model Predictive Control were suggested as very good alternatives.
The correct
model of the 4-tank process should be utilized in order to improve the control system.
The two (2)
control variables, that is; the voltages of pump
four tanks
h1 , h2 , h3
and
1
and pump
2
are both inuencing the water levels in the
h4 .
In Multivariable systems, certain characteristics as a result of the interaction between the manipulating
variable with more than just one controlled variable results in the challenges of selecting the most preferred
pairing of the control and manipulated variables for a multiloop control scheme as discussed in (Seborg
E. Dale and Mellichamp, 2003) and (Luyben and Luyben, 1997). For convenience most times, the number
20
of manipulated variables are equal to the number of controlled variables. This is majorly to allow the
pairing of a single manipulated variable through a feedback controller.
In this case, there is process
interaction between controlled and the manipulated variables. For each controlled variable, it is expected
that a setpoint be given while the manipulated variables are achieved by the controller function, and
each process output variable has a single control loop for itself. Some typical examples of multivariable
processes are;
A distillation column where the top and bottom concentration shall be controlled.
A heated liquid tank where both the level and the temperature are to be controlled.
A chemical reactor that its concentration and temperature need be controlled.
Figure 3.10 is a schematic illustration of the input and output of a multivariable control system of the
4-tank laboratory process and Figure (3.11) illustrates a MIMO system.
Figure 3.10: Schematic diagram of the multivariable control system
Figure 3.11: MIMO system
In this thesis work, interest is on the level measurement of the two (2) lower tanks and which are fed
back to the controllers. Two dierent control approaches have been evaluated. They are the Conventional
PID Controller and the Model Predictive Controller.
21
Chapter 4
Control Strategies
The need for operating very complex plants like the chemical process plants, oil reneries and pulp mills
in a protable and safer form has really necessitated the development of various control strategies.
In order to develop procient control strategies, the designers really need to bear in mind that there
must be stated control objectives which should be based on the operational requirements of the plant
of interest. For various plants or process systems, there are varying control objectives and some of the
general objectives according to (Seborg E. Dale and Mellichamp, 2003) are as follows;
1. Stable Operation of the Plant: The control system should be capable of facilitating a stable operation
of the process plant without any signicant oscillation in the major process variables. Thus, it is
very much desirable to have fast recovery from process plant disturbances like changes in feed
composition.
2. Safety:
It is quite an obligation that industrial process plants be operated safely to ensure the
promotion of the well-being of the people/equipment in the neighborhood.
3. Environmental Regulations:
The Industrial Plants should adhere strictly to the environmental
regulations regarding discharges/wastes beyond the boundaries of the plant.
Haven stated the control objectives as above, the control system strategies can be designed and the steps
involved are as follows:
1. Select controlled, manipulated and measured variables.
2. Choose the control strategy and control structure.
3. Specify controller settings.
Usually, the control and manipulated variables can be measured on-line. In cases when controlled variable
cannot be measured, it could then be estimated from other process variables using the Soft sensor
approach.
The easiest and most common way for controlling a multivariable process is by using single loop
control with PID controllers. There is usually one control loop for each of the process output variable
meant to be controlled.
The most common process control strategy is the multi-loop control which
consists of a set of PI or PID controllers, usually one for each controlled variable. This multiloop PI
control is to an extent proven satisfactory for a couple of control problems. Although, some common
control problems in which advanced control strategy would be best option are stated as follows;
Process that is having very strong interactions between the process variables:
when
there is strong interaction between the process variables, multivariable control strategies would
be the most eective.
Process having slow dynamics and measurable disturbances:
This is the type of problem
that requires the addition of feedforward control to the multiloop control.
Processes that exhibit strongly nonlinear behavior:
These are the type of problems where
nonlinear control techniques like Fuzzy Logic are considered.
22
Processes in which constraints on the variables must be satised:
This is a situation
where certain limits are imposed on the controlled and manipulated variables for certain reasons.
Example is when the maximum ow rate is limited by the pump or control valve setting. Thus,
inequality constraints could be accommodated by using model predictive control (Seborg E. Dale
and Mellichamp, 2003).
4.1 Conventional PID Controller
The PID controller is a three-mode controller often times regarded as one of the feedback control algorithms that are predominantly used in commercial quantities dated back as in the early 1930s (Haugen,
2004b).
The controller output is used in adjusting the process variable, ensuring it to be in an acceptable
range. It typically means that the steady-state or static error is zero (Haugen, 2004b).
Since our utmost interest is to adjust the control variables ensuring that controller output, changes
sensitively to the deviations between the controlled variables and the set-point. Hence, the process would
be inuenced by a control signal thereby aecting the control variable. The control challenge here is to
compare the process variable with the set-point value, which will in-turn be used as a determinant factor
for the control signal. A simple block illustrating the PID control action is in Figure 3.1.
The two single control loops used for each of the levels in the tanks are each manipulating the ows
through the pumps respectively. The level sensors in the lower two tanks has been used to get the water
level of the tanks and these values are then used for adjusting the control signals, hence conrming it is
a feedback system.
4.1.1 Control Modes of a PID Controller
The PID Controller basically comprises of three operational modes namely; Proportional, Integral and
the Derivative modes respectively.
The combinational eect of these three modes is then used in the
control signal. And these modes have their specic output forms. It is represented mathematically in the
following form;
ˆt
kp
u = u0 + kp e +
Ti
edτ + kp Td
de
dt
(4.1)
0
And the parameters further dened as;
up = kp e
kp
ui =
Ti
ˆt
Where
kp
is the proportional term,
edτ
(4.3)
de
dt
(4.4)
0
ud = kp Td
norminal value of the control variable is
(4.2)
Ti [s] is the integral time, and Td [s] is the derivative time. The
u0 . Furthermore, up is the P-term, ui is the I-term and ud is the
D-term (Haugen, 2004b).
The three operational modes can be combined in the form of P-Proportional, PD-Proportional Derivative, PI-Proportional Integral and the general PID-Proportional Integral Derivative.
The P controller
usually changes the control signal in proportion to the error between the set point and the process variable. In this case, if the levels in the tanks
negative thereby making the controller gain
error
e
1 and 2 are more than the set
kp gives more control variable
point, the control error
adjustment,
kp e
e
is
for a given
and giving less error in turn. Instances where the proportional gain is very high, it results in the
system's instability. And when the proportional gain is low, it may result in very small control action
responding to the system disturbance.
For the I-controller, it is mostly used with a P-controller to yield PI-controller. And for PI-controller,
its integral part makes the process variable to move faster to the set point. The PI-controller is widely
accepted in industries as it does not pose any form of functionality challenge in its application. Finally,
the derivative part of the controller is mostly known for its ability to reduce the rate of change of the
23
controller output. Conclusively, the derivative control is used for reducing the magnitude of produced
overshoot due to integral action and hence improves the systems stability.
In precise, the P and the PI-controllers are obtained from the PID controllers as follows;
P controller is obtained by setting the
Ti = ∞ (or setting
Td = 0.
to a very large value), while setting
Td = 0
. Also, the PI controller is obtained by setting
4.1.2 Tunning of the PID controller
It is based on the requirements for using the PID controller to control the 4-tank process satisfactorily,
that the best values of
kp , Ti
Td
and
must be selected by controller tunning.
There are quite several
methods for tunning a PID controller, but the Ziegler-Nichols' closed loop method is used to adjust the
PID controller parameters. In using the Ziegler-Nichols' method, the controller parameters are rst set
by
Kp = 0
with
Ti = ∞
Td = 0
and
. The controller is then set in automatic mode and
until the control reaches the critical gain,
Kp
be the smallest
Kpu ,
Kp
is increased
where the output signal sustains oscillations.
Kpu
must
value that would drive the control loop into sustained oscillations. When the system
attains the critical gain, the critical period
Tu
of the sustained oscillations is measured. Ziegler-Nichols'
method gives the controller parameters based on just the two values
Kpu
and
Tu
as in Table 4.1.
Table 4.1: Controller parameters using Ziegler-Nichols' method.(Haugen, 2004b)
P controller
PI controller
PID controller
kp
0.5kpu
0.45kpu
0.6kpu
Ti
∞
Td
0
0
Tu
1.2
Tu
2
Tu
8
In this process, the level of water in the tanks account for the stability of the process.
When the
water levels in the tanks is lowered, there is little pressure forcing the pumps to keep the levels at the
setpoints, hence making the process to be unstable.
But when the level in the tanks are reasonably
high, there is much pressure given from the pumps to keep the levels at the setpoints and the process
becomes stable.
The controller is then tunned at low levels where the process is unstable.
Here, the
three-way valve is set to one (1) resulting in the water ow to the lower tanks (tank 1 and tank 2). But
the process involves two regulating systems, as it is a multi-loop control system. According to the reports
by (Gøthesen Dan-Krister and Semb, 2009), by applying Ziegler-Nichols tunning, the parameter values
results;
Kp = 0.9
and
Ti = 5
. And also applying thesame procedure for tunning the second controller,
Kp = 0.8
the parameter values then becomes;
and
Ti = 4.1
The controller parameters are dierent, and
it results from the variation in the outlet pipes causing outows. Although, the controllers takes some
time to turn on, but the performance is quit satisfactory.
4.1.3 Eect of Multivariable transmission zero
The two valves position are set prior to the experiment, these valves position are interpreted using the
parameters
γ1 , γ2 ∈ [0, 1].
go into the lower tanks.
If
γi = 0
the entire ow goes into the upper tanks and with
γi = 1 ,
the ows
The four-tank dynamics has an adjustable multivariable transition zero such
that its position can be in the Left Half-Plane (LHP) or Right Half-plane (RHP), and this depends on
the ratio of the ow rates between the tanks as determined by
γ1
and
γ2 .
Hence, the position of the
multivariable zero is a source of motivation for investigating the performance limitations arising from the
1
right-half plane transmission zeroes . It is also referred to as transmission zeros.
detG(s) =
T1 T2 k1 k2
Π4 (1 + sTi )−1 × [γ1 γ2 a1 a2 A3 A4 T3 T4 s2 + γ1 γ2 a1 a2 A3 A4 (T3 + T4 )s
a1 a2 A1 A2 A3 A4 i=1
The transfer matrix
G,
+a3 a4 A1 A2 (γ1 + γ2 − 1 − γ1 γ2 ) + a1 a2 A3 A4 γ1 γ2 ]
(4.5)
thus has two nite zeros. One of the zeros lies in the left half-plane, because
all the process parameters are positive.
The location of the other zero depends on the sign of;
a3 a4 A1 A2 (γ1 + γ2 − 1 − γ1 γ2 ) + a1 a2 A3 A4 γ1 γ2
η<0
a3 a4 A1 A2 = a1 a2 A3 A4 .
The multivariable zero is in the right half-plane if
For this four-tank process we have
η :=
(Johansson, 2000).
and would be in the left half-plane if
η > 0.
See Table 3.1, therefore the system is non-
minimum phase for the condition;
1 According to (Johansson, 2000), the multivariable zeros are the zeros of the numerator polynomial of the rational
function and are dependent on the transfer function matrix (4.5).
24
0 < γ1 + γ2 < 1
(4.6)
1 < γ1 + γ2 ≤ 2
(4.7)
And minimum phase for the condition;
4.1.4 Right half-plane zeros of the four-tank process
In MIMO systems, the undesirable process interactions and the location of the transmission zeros in the
right half-plane are very important. This is because they describe the stability as well as the controllability
of the entire system. The right half-plane zero impose limitations on the stability and controllability of
the system. A zero in the right half-plane also implies inverse transient response and larger response time
in the step response(Haugen, 2004a).
In this thesis work (4-tank process) in which the paramount interest is the development and comparison
of control strategies implemented ranging from the decentralized PI controller to the advanced controllers,
it is already observed that the right half-plane zero results in process instability and diculties in achieving
good control. In section 4.1.3, the condition for non-minimum phase is stated which results in this fourtank process having a right half-plane (RHP) zero. When the valves are adjusted such that,
slightly less than one i.e.
(γ1 + γ2 ≈ 1),
γ1 + γ2
is
the process would then have a RHP zero that is close to the
origin and the levels in the lower tanks would be dicult to control. All thesame, a little change in one
of the valves could result in
γ1 + γ2
to be greater than one and there would not be any limitations on the
system's achievable control performance. Although in practice, the diculty in the control of the levels
in the four-tank process is not changed unexpectedly sudden with a small variations in one of the valves.
The position of the multivariable transmission zero being either in the LHP or in the RHP is interpreted
i is represented by qi . And that,
q1 = q2 , then the sum of the ows going into the two upper tanks is (1−γ1 )q1 +(1−γ2 )q2 = [2−(γ1 +γ2 )]q1 .
The total sum of ow going into the two lower tanks is (γ1 + γ2 ). Therefore, if the system is in minimum
phase we have that 1 < γ1 + γ2 ≤ 2, that is the ow to the two lower tanks are more than the ows to
using physical illustrations as follows; Assuming the ow from the pump
the two upper tanks. On the other side, the ow to the two lower tanks is smaller than the ow to the
0 < γ1 + γ2 < 1. It is inherently easier
v2 respectively when most or all of the
two upper tanks if the system is in non-minimum phase such that
to control
y1
and
y2
(levels of tank 1 and tank 2) with
v1
and
ows from the pumps goes directly into the two lower tanks.
4.2 Model-based Predictive Controller
The Model-based Predictive Controller (MPC) is a more recent control strategy which has been a special
case of the optimal control theory developed in the
1960s
and later. The concept of Model Predictive
Control (MPC) obviously emanated from using process models as sources for developing new multivariable
controllers. Although it is not limited to the chemical and Petroleum process industries, but they are
widely characterized by being multivariate in nature with many constraints (Luyben and Luyben, 1997).
The technique that is employed by the Model-based Predictive Controller, focuses mainly on constructing controllers that is capable of adjusting the control action in a way before any change in the
output occurs. This inherent predictive nature or ability, in combination with the traditional feedback
operation enables the controller to make adjustments that are smoother and very close to the optimal
control action values.
The method in which the control action is calculated in the MPC diers from the other types of
control strategies.
instant.
Usually, a nite horizon optimal control problem is solved at each sampling time
And for the calculated control sequence, the rst step is then applied to the process (plant),
while the subsequent control sequences are discarded.
sampling time instant.
These calculations are performed at the next
It is a good idea to handle the MIMO plants and their constraints explicitly.
Although two important obstacles to be considered are the computation time that is required to solve the
optimal control problem at each sampling time instant and the model of the plant which is non-linear.
Model predictive controllers are applied to process plants that are having slow dynamics such that the
computation time is negligible when compared to the sampling intervals. An example of this application
is the control of petrochemical process plants.
Nevertheless, MPCs are been applied to systems with
faster dynamics like Aeroplanes and Combustion engines.
In recent times, MPC applications seem to be next to the PID control in the automation industry.
The process model to use, could be linear or non-linear in nding most appropriate changes in the
25
manipulated variables for obtaining desired control variables.
The controller function is based on a
continuous calculation of the optimal sequence or time series of the control variable,
uk
as in Figure
4.3. The calculation is based on predicting the future behaviour of the process to be controlled (Haugen,
2009).
There exist an optimization problem associated with MPC, which involves the computation of
control input vector,
uk ,
which is to be feed into the system while taking process constraints (System
input amplitude constraints) into consideration at the same time.
SOME OF THE ADVANTAGES OF THE MPC
1. The MPC is able to nd most economical set-points and operating points.
2. The MPC ensures process and utility system operations to be stable and respond appropriately to
changing requirements.
3. There is coordination in control calculation using the calculation of optimum setpoints.
4. The MPC is capable of providing timely warnings, notications and alarms of the possible future
problems in the plant.
5. It also ensures reduced maintenance and longer plant life.
4.2.1 General Overview of the MPC
The wide acceptance of the MPC by many industries is basically for its smart performances in dicult
multivariable control conditions.
It is designed such a way that it inherently ensures the control of
process variables as best possible in the absence of a sensor or actuator in the process. The MPC aims at
preventing the violations of input and output constraints, as well as preventing the excesses that could
arise in the movement of input variables. The model of the process is used in predicting current values of
the output variables. When the actual and predicted outputs are compared, their resulting dierence is
used as a feedback signal to the prediction block. And the predictions achieved, are used at each sampling
time instant for the calculation of the setpoint and the control signal calculations. A simple block that
illustrates the MPC is Figure 4.1.
Figure 4.1: Block diagram of the model predictive control(Seborg E. Dale and Mellichamp, 2003).
The inequality constraints on input and output variables, as the upper and lower limits respectively is
included in any of the calculations. According to (Seborg E. Dale and Mellichamp, 2003), the objective of
the MPC control calculations is for determining a sequence of the so called control moves (manipulated
input changes) such that the predicted response moves to the setpoint is in an optimal way. In Figure
4.2, the actual output
y
, the predicted output
ŷ
the current sampling instant which is denoted as
, and the manipulated input
k
u
are plotted. Considering
, the MPC strategy calculates a set of number of input
{u(k + i − 1), i = 1, 2, ......, M }. The calculated control inputs, consists of the current input u(k)
M − 1 future inputs. However, these inputs are calculated such that the set of P predicted outputs
{ŷ(k + i), i = 1, 2, ......., P } gets to the setpoint in an optimal way. P is the number of predictions which
is referred to as Prediction horizon, and M is the number of control moves also referred to as Control
values
and
26
horizon. In the sequence of control moves that is being calculated at each sampling time instant, it is the
rst move that is practically implemented. Another sequence is also calculated at the next sampling time
instant, which is based on the available measurements and only the rst control move is implemented as
well. See Figure 4.2.
Figure 4.2: Concepts of Prediction and Control horizon in MPC(Seborg E. Dale and Mellichamp, 2003).
4.2.2 Calculation of the control actions
Normally, at each control execution time, the control action which is required by the process is normally
calculated based on the available Controlled variables (CVs), inputs (Manipulable Variables, MVs) and
the disturbance variables (DVs).
These process data are all obtained through the regulatory control
system (DCS) that is interfaced to the process. The model of the process is then used to calculate new
output predictions in step 2 of Figure 4.3.
The structure of the control action could possibly change
with respect to the varying execution time instant, thereby making the subsequent control calculations
2
to become ill-conditioned . Although, the ill-conditioning can be removed by adjusting an MPC design
parameter such as the move suspension matrix, R. Further readings on this could be found in Seborg et
al. (2003). On a general note, applying the MPC give benets resulting from the determination of the
optimal operating condition and the movement of the process to these operation conditions.
2 Ill-condition:
Arises when available inputs have similar eects on two or more outputs
27
Figure 4.3: Flow chart for MPC calculations
Since the importance of the Model Predictive Controller is to calculate the input signal (which is
uk = v1 , v2
in this project) that most appropriately corresponds to a set of criterium predicting the
behaviour of the system on applying the signal. The problem has been made a mathematical programming
problem for a given state. The feedback strategy is developed by solving the problem at each sampling
time and only the present control action
uk
is used. It is often denoted as a Receding horizon problem.
It can be summarized in steps as follows:
k , model Equations (3.6) and (3.7) are used to compute
yk+1 , yk+2 , ........, yk+L as a function of future control inputs uk , ........., uk+L−1
1. At sampling time
2. Minimize the cost function,
3. Apply
uk as
Jk with
future outputs.
respect to unknown future and present controls in
i.e.
uk|L
feed to the process.
4. For next sampling time,
each new time instant
k = k+1
and back to step
1,
where the optimization problem is done at
k.
4.2.3 Optimization formulation
The central idea behind formulating an optimization criteria is because of the computation of the new
control input vector that is fed to the process, while taking the process constraints into consideration at
thesame time. Hence, the MPC optimization criteria consists of terms or components to be treated in
next section.
4.2.3.1 Cost function
The cost function which is also known as the control objective,
Jk , is a scalar criterion that helps in
L. The control objective is usually
measuring the process behaviour over a certain prediction horizon,
28
minimized with respect to the future control vectors,
uk+1|L , and afterall only the rst control vector, uk ,
is applied in the control implementation. The cost function (control objective) used in connection with
MPC is given by the function;
Jk =
L
X
((yk+i − rk+i )T Qi (yk+i − rk+i ) + uTk+i−1 Pi uk+i−1 + 4uTk+i−1 Ri 4uk+i−1 )
(4.8)
Qi ∈ Rm×m , Pi ∈ Rr×r and Ri ∈ Rr×r are
symmetric
i=1
Where
L
is dened as the prediction horizon,
and positive semi-denite weighting matrices that are specied by the user. The weighting matrices
and
R
are the parameters that is tunned until a desired performance is achieved.
Q
This adjustment is
a kind of tradeo between a fast system and a smooth signal. Usually, if a signal is desired, then the
Q
R should be kept minimal. And if on the other hand a faster system is of interest, then the ratio
should be increased gradually until the speed is achieved. Since only two (2) states are to be controlled in
ratio
this work, a more general choice is to specify
Qi , and Ri as diagonal weighting matrices having non zero
1 and 2. The weighting matrices are usually dependent
values on the positions coressponding to states
on the process and must usually be choosen by the trial and error method (DiRuscio, 2009).The control
objective is considered as a Quadratic Programming (QP) problem, and the matrix equivalent is given
by (4.9);
Jk = (yk+1|L − rk+1|L )T Q(yk+1|L − rk+1|L ) + uTk|L P uk + 4uTk|L R4uk
(4.9)
4.2.3.2 Constraints
In MPC implementation, there is good motivation in the sense that constraints like the input amplitude
constraints and input rate of change constraints are treated more eciently than in the conventional PIDcontroller. It leads to inequality constraints as,
problem.
Auk+1|L ≤ b,
which is an additive to the optimization
The input amplitude constraint is a lower and upper bound on the actuator (pump).
constraints are to a large extent seen as a means for limiting the resources (i.e.
The
water ow) from the
pumps in the case of input constraint. And the output constraints are set to limit the amount of water
retained in the tanks, as it is set by constraining the tanks height.
maximum is
20[cm]
The minimum is zero
0[cm]
and
for the four tanks.
The amplitude constraints on the input signal to practical control systems is formulated as follows;
umin ≤ uk|L ≤ umax
(4.10)
It could as well be conviniently formulated in a standard form for Quadratic programming problems as;
I
I
uk|L ≤
umax
−umin
(4.11)
The system output constraint is also dened mathematically as follows;
ymin ≤ yk+1|L ≤ ymax
(4.12)
Since it contains the term of the prediction model, a direct substitution is then made resulting in the
Equation (4.13). i.e.
yk+1|L = pL (k) + FL uk|L
FL
−FL
which nally yields
uk|L ≤
ymax − pL (k)
−ymin + pL (k)
(4.13)
4.2.3.3 Prediction Model
This is a model that is constructed from the process model and it is used in describing the relationship
existing between the future outputs and the future control inputs to be computed. Hence, making the
PM
3 a part of the optimization problem.
behaviour of the system in
L
The Prediction Model is the best tool for forecasting the
sampling times ahead into the future.
L
is the prediction horizon choosen.
Considering a discrete time state-space model as of Equations (4.14) and (4.15), the system dynamics
could be computed recursively. However, the states have to be measurable, otherwise a Kalman lter or
3 PM:
Prediction Model.
29
State observer would be needed.
But for the four-tank process in this thesis, the two lower tanks are
measurable and only the upper two tanks would need to be estimated.
With a horizon of
L,
xk+1 = Axk + Buk
(4.14)
yk = Cxk
(4.15)
the prediction would be:
xk+1|L =
xk+1
.
.
.
xk+L
=
Axk
Axk+1
.
.
Axk+L−1
Where
Buk
Buk+1
.
.
Buk+L−1
uk
uk+1
.
.
uk|L =
= ....F xk + Huk|L
(4.16)
(4.17)
uk+L−1
is the control input sequence for
xk+1|L
(DiRuscio, 2009).
The MPC is quit advantagous, as cross coupling in multiple input amd multiple output(MIMO)
systems are been taken into consideration in an optimal way.
uk|L .
in computing future optimal controls,
The MPC method can also be used
Hence, providing a methodology for computing control
suggestions that may be valuable for process operators.
4.3 Parameter Estimation
In attempt to have a stable and robust controlled multivariable system in the absence of some states of
the system, there is need for some soft-sensing methods for estimating these parameters or states. The
estimates are possibly used as feedforward control signals in the controllers.
4.3.1 The Kalman Filter
The Kalman lter algorithm was developed in the 1960s by Rudolf E. Kalman. It is usually used in the
estimation of state variables of dynamic systems that are excited by stochastic disturbances and stochastic
measurement noise. The Kalman lter is very much versatile and is used in so many applications. Some of
its applications are in fault detection systems, dynamic positioning of ships, soft sensor systems which are
used for supervisory and radar applications when someone is interested in target tracking. The Kalman
lter produces an optimal estimate such that the mean value of the sum of the estimation errors gets
a minimum value (DiRuscio, 2010). In (Haugen, 2009), it is suggested that a discrete Kalman lter be
used for implementation on a non-linear state space model. A discrete non-linear model can be written
as follows;
xk+1 = f (xk , uk ) + Gwk
(4.18)
yk = g(xk , uk ) + Hwk + vk
(4.19)
Where
xk
is the state vector, including all possible augmented states.
uk
is the vector of manipulable input.
wk
is the process noise vector.
w
has auto-covariance of the form;
Rw (L) = Qδ(L)
the unit pulse function. And a standard assumption is that;
Q11
0
Q=
0
0
0
Q22
0
0
0
0
..
.
0
0
0
0
Qnn
30
= diag(Q11 , Q22 , Q33 , .....Qnn )
in which
δ(L)
is
G
is process noise gain matrix relating the process noise to state variables. And it is commonly
assumed that
G
is a squared matrix. i.e.
G11
0
G=
0
0
Its elements are set to
1
0
G22
0
0
..
0
0
0
0
.
0
Gnn
0
thereby making it an identity matrix.
y
is the measurement vector of
g
is the measurement vector function, typically on the form;
r
variables.
g(x) = Cx.
And
C
is the measurement
gain matrix.
H
is a gain matrix relating the disturbances directly to the measurements , and it is commonly
assumed that
H
is a zero matrix of dimension
(r × q)
0 0
0 0
H=
0 0
0 0
v
is a random measurement noise vector.
which
R
is the auto-covariance of
R=
The variances
Q
and
v
measurement noise
R
v
R11
0
0
R22
0
0
0
0
at lag
0
0
..
.
0
in the form;
0
0
..
0
0
.
.
.
.
···
Hrq
v has auto-covariance of the form; Rv (L) = Rδ(L)
L = 0. And a standard assumption is that;
0
0
= diag(R11 , R22 , R33 , .....Rrr )
0
Rrr
are usually increased in situations when the strength of the process noise
w
in
and
are needed to be adjusted respectively. In (Haugen, 2009), the following steps have
been presented for calculating the Kalman lter state estimate and its labVIEW implementation is in
Figure 4.5;
Step 1 :
Initial step; Assume the initial guess of the the state to be
predicted state estimate
xp is
xinit .
The initial value
xp (0)
of the
set to the intial value.
Initial state estimate:
xp (0) = xinit
Step 2 :
(4.20)
Predicted measurement estimate; which is derived from the predicted state estimate.
Predicted measurement estimate:
yp (k) = g[xp (k)]
The noise terms
(4.21)
Hv(k) and w(k) are assumed to be unpredictable , thus they are not used in calculating
the predicted measurement estimate.
Step 3 :
Calculating the Innovation process or variable; This is the dierence between the
measurement
y(k)
and predicted measurement
yp (k).
Innovation variable:
e(k) = y(k) − yp (k)
31
(4.22)
Step 4 :
Ke(k)
Calculating the corrected state estimate,
to the predicted state estimate
xc (k);
This is achieved by adding the corrective term
xp (k).
The Corrected state estimate:
xc (k) = xp (k) + Ke(k)
Where
K
(4.23)
is denoted the Kalman Filter gain. The corrected state estimate is also known as aposteriori
estimate or measurement-updated estimate.
Step 5 :
Calculating the next predicted state estimate,
state estimate
xc (k)
and the unknown input
u(k)
xp (k + 1)
; This is achieved by using present
in the process.
Predicted state estimate:
xp (k + 1) = f [xc (k), u(k)]
(4.24)
In practical applications, 4.23 is used as the state estimate. The predicted state estimate is also known
as apriori estimate or time-updated estimate. The calculation of the Kalman Filter gain
K
as used in
(4.23) is further presented as follows;
Step 1 :
Initial step; The initial value
Step 2 :
Calculating the Kalman Gain;
Pp (0)
is set to a guessed matrix e.g the identity matrix.
The Kalman Filter gain:
K(k) = Pp (k)C T [CPp (k)C T + R]−1
Step 3 :
(4.25)
Calculating the auto-covariance of corrected state estimate error;
Auto-covariance of corrected state estimate error:
Pc (k) = [I − K(k)C]Pp (k)
Step 4 :
(4.26)
Calculating the auto-covariance of next time step of predicted state estimate error;
Auto-covariance of predicted state estimate error:
Pp (k + 1) = APc (k)AT + GQGT
(4.27)
4.3.1.1 Implementation of the Kalman Filter
Before implementing the Kalman lter estimator to work correctly, it is utmost necessary to test for the
observability of the system whose states are being estimated. In this work, the condition of observability
of the system is tested on the KG1.vi, KG2.vi, KG3.vi and KG4.vi respectively for the four tanks in the
system. And these observability tests are all indicated by a Light Emitting Diode (LED) turning on.
The Kalman lter state estimator 's behaviour is assessed by the observation of the physical process,
and the physical knowledge about the process. Usually, when there are noises in the estimate, the matrix
Q
which is a tunning parameter is adjusted inorder to avoid noisy estimates. If the value of
large, it results in larger Kalman Gain
K
and also stronger updating of the estimates.
Q
is made
According to
(Haugen, 2009), there would be addition of more measurement noise to the state estimates which is
because the measurement noise is a term in the innovation process
e
that is calculated by
K.
See Figure
4.4 for illustration. And the number of state estimates is a determining factor for the dimension of the
process disturbance (noise) auto-covariance matrix
Q.
32
Figure 4.4: Kalman Gain block.
Since the fundamental reason for applying the Kalman lter is for the estimation of the unmeasured
water levels in tank 3 and tank 4, dierent Kalman lters would hence be designed for estimation of the
water level and outow in all the tanks. See part of the program that implements the state estimation in
Figure 4.5.
Figure 4.5: Kalman lter LabVIEW program.
33
Figure 4.6: Kalman lter Estimation of the 4 levels in the Real process
Figure 4.7: Simulator tank levels corresponding to the Estimated and Measured levels of real process
Since the levels in the two upper tanks (tank 3 and tank 4) are not measured, implementing an
estimator as in Figure 4.5 is the best alternative to solve such problems of unmeasured states in a
multivariable process.
Having tested the estimator on the real process and the simulator, there is no
signicant dierence noticed.
Although, the system responses as in gure 4.6 is a little noisy; but is
surely reliable as substitute in sensor absence or failure. see Figures 4.6 and 4.7 for comparison.
34
Part II
Implementation of control strategies
35
Chapter 5
Implementation and results
In this section of the thesis task, a simulator of the model and the real process (Physical equipment of the
4-tank process) in a parallel form are implemented having them side by side to each other. This is aimed
at making good assessment, comparison and necessary criticisms based on the respective performances
of the processes.
The communication with the real process is achieved using two (2) NI USB-6008 devices, see Figure
3.8.
A simple schematic which indicates the data ow from the LabVIEW program to the process is
shown in Figure 3.9.
It is considered very useful to show the allocation of the two (2) NI USB-6008 devices amongs the
equipments of the process. i.e. the level sensor 1, level sensor 2, valve 1, valve 2, pump 1 and pump 2.
This will assist the users and students in conrming that appropriate channels are connected to each and
all of the measurement and control devices in the entire process, see Table 5.1 for clarications.
Table 5.1: NI USB-6008 allocation.
Measurement
NI USB-6008
Channel Number.
Name
Level sensor 1, LT01
Level sensor 2, LT02
Valve 1, LCV01
Valve 2, LCV02
Pump 1, LCP01
Pump 2, LCP02
h[cm]
h[cm]
y
y
y[V ]
y[V ]
Analogue Input- AI1
#1
#2
Analogue Input- AI1
#1
Analogue Output -AO0
#2
Analogue Output -AO0
#1
Analogue Output -AO1
#2
Analogue Output -AO1
The simulated model and the real system is controlled simultaneously with the USB-I/O devices. The
LabVIEW program is able to synchronize with the process through the sensors in the physical 4-tank
process. The sensors signal generated from tank 1 and tank 2 levels are transmitted to the NI USB-6008
devices, and these signals are further transmitted to LabVIEW through the MAX application. This
synchronization of the signals happens very fast, though it is not a real-time system. The sensors used
are pressure sensors; one at each bottom of tank 1 and tank 2, and also feedback signals from each of
the valves 1 and valve 2 respectively. The valve indicators as shown on the front panel of the main
labVIEW program are used to show the values of the two (2) valve positions. Tank level indicators are
also used to show the levels in the tanks. For the real process, only the levels in the lower two tanks are
being plotted. This is because there is no measurement of the levels in the upper tanks, the levels of the
top two tanks are considered as disturbances to the lower two tanks.
On the other side (the model), the levels of all the 4-tanks are plotted accordingly. When the process is
controlled (both model and real), only the levels of the two lower tanks (tank 1 and tank 2) are
compared except in the case when estimators are included.
The control of the process (real and model) can be chosen to be manual or automatic control of the
pumps depending on the interest of the user. In automatic control, the PI controller regulates the
pumps (pump 1 and pump 2) with respect to the level of water in the tanks. The user can force the
pump manually between
0
to
5V
(o and maximum ow rates), this is achieved by setting the controller
to Manual mode . The valves are being adjusted such that the pumps inuences respective tanks
connected to them. The user or student using this equipment is able to make selection of the type of
control from the front panel switch labelled Auto or Manual.
36
The signals to the pumps here are dependent on the corresponding PI controller's output values which
is between
0 − 100%.
The pump signal of
0 − 100%
has been scaled to
y=
Where
x = (0 − 100%)
and
y = (0 − 5)V . x
0 − 5V ,
using the relationship;
x
20
(5.1)
is the controller output signal ranging between
is the scaled controller output signal in voltage to the pump and ranges between
0 − 5V .
0 − 100%. y
The tank levels of the real system as indicated by the two tank indicators which is read from the USB
devices into the LabVIEW program is achieved with regards to the scaling relationship as follows;
h = (5 × u) − 10
Where
u = (2 − 6)[V ],
the voltage from the USB device. And
(5.2)
h = (0 − 20)[cm],
the level in the tanks.
The position of the valves as shown by the corresponding indicators ranges between
0 − 1.
These value
of valves is determined by the operator or student operating the system, and is feedback from the valve
through the USB device. The positional sizing of the valves in LabVIEW is calculted by the relationship
as follows;
y=
Where
u = (0 − 5)[V ],
u
5
(5.3)
is the voltage from the USB device. And
γ
y = (0 − 1),
which represents the
(0), all the water will ow
4). Also, when the value of γ is set to one (1), all the water will
ow into the lower tanks only. i.e.(tank 1 and tank 2). And if the operator decides to set the gamma
value (γ) between 0 and 1, the water will then ow proportionately into the four (4) tanks depending on
the set values. If the valve position (gamma, γ ) is set between 0 and 1, its corresponding voltage from
position of the valve to be set by the user. When the value of
into the upper tanks (tank
3
is set to zero
and tank
the USB device to the valves is calculated by the formular;
y =5×u
Where
x = (0 − 1)
in LabVIEW. And
respectively.
y = (0 − 5)[V ],
(5.4)
is the output from the USB device to the pumps
For the devices whose scaling properties have been discussed above, a tabular illustration showing the
devices and the type of system is as shown in Table 5.2.
Table 5.2: Devices and Scaling in Systems
Devices
System-LabVIEW
System-Real system
Pumps (P1 and P2)
(0 − 100)[%]
(0 − 1)
(2 − 6)[V ]
(0 − 5)[V ]
(0 − 5)[V ]
(0 − 20)[cm]
Valves (V1 and V2)
Level sensors (LT01 and LT02)
37
Chapter 6
Implementation of the PID Controller
The main focus in simulating the system (model and real system) using the centralized PI controller is to
enhance good observation of the system's behaviour in response to parameter changes such that would be
benchmarked for reference and comparison purposes for other strategy. The simulation of this system is
done using four (4) PI controllers in the LabVIEW program such that; two (2) PI controllers will control
the real process and the other two (2) PI controllers would be controlling the model simultaneously. Some
of the purposes of the simulation are;
1. To observe the behaviour of the system in response to changes in any control function such as, the
valve position that results in the minimum and the non-minimum phase operating conditions.
2. The control behaviour in response to set point changes.
RESULTS:
In experimenting the control and stability behaviour of the systsem using the PI controllers for the
simulator and the real process, parameter values are choosen to observe the response of the processes
both for the case of LHP zeroes and the RHP zeroes respectively. The choosen parameters are as shown
in Table 6.1. The parameter values corresponding to the minimum phase operating point,
PL
is the case
when the processes have minimum phase characteristics. i.e. The process only have LHP zero. Likewise,
the parameter values that corresponds to the non-minimum phase operating point ,
PR
is the case when
the processes (real and simulator) have non-minimum phase characteristics. i.e. The processes then
only have RHP zero.
Table 6.1: Parameter values for minimum and non-minimum phase operating points.
(h01 , h02 [cm]
(h03 , h04 ) [cm]
(v10 , v20 ) [V ]
(k1 , k2 ) [cm3 /V s]
(γ1 , γ2 )
PL
14.99, 14.99
0.24, 0.21
3.85, 2.96
0.67, 0.74
0.93, 0.9
PR
14.99, 14.97
3.37, 9.05
4.34, 1.33
0.67, 0.74
0.5, 0.5
The results of the minimum phase and non-minimum phase of the real process and the model as well as
their controller actions are shown in Figures 6.1, 6.2, 6.3 and 6.4 respectively.
38
Figure 6.1: Minimum phase process and control signal (Model).
For the non-minimum phase operating condition, set point changes are made and the controller action
as well as the process output (level of tanks) signals are plotted in Figure 6.2.
39
Figure 6.2: Non-minimum phase process (model)
Likewise, the minimum and non-minimum phase operating conditions have been applied to the real
process and its responses as well as the controller behaviour is as shown in Figure 6.3 and Figure 6.4
respectively.
40
Figure 6.3: Minimum- phase operating condition (Real process)
41
Figure 6.4: Non-minimum phase operating condition (Real process)
Having implemented the control of the process (including the simulator) with consideration on the two
operating conditions (positions) of the transmission zero, the control, response time and stability of the
process is observed. The responses from the real and the model (simultor) are quite similar. Figure 6.3
and Figure 6.4 shows that the response and settling times for the non-minimum phase process is longer
than the minimum phase process. And there is a good dierence in the controller behaviour for both
conditions, as the controller is more stable making the process to be controlable in the minimum phase.
Figures 6.1 and 6.3 shows stable processes, while Figures 6.2 and 6.4 shows unstable and uncontrollable
processes.
6.1 Lowpass lter implementation
In the course of testing the controller performance with the real process, it has been noticed that the
measurements from the process was quite noisy. And this calls for implementation of a low pass lter
that would considerably reduce the noise in the signals. The lter is implemented using a formular node,
which is based on the transfer function of a lowpass lter having input variable
y
u
and an output variable
. It is written on the form in Equation (6.1).
1
y(s)
= H(s) =
u(s)
Tf s + 1
1
wb
Tf =
where
Tf
is the lter time constant,
wb = 2πf
, and
(6.1)
f
(6.2)
is the signal frequency.
It is very necessary to apply the Euler backward dierence on
ẏ(t)
(time domain) of Equation (6.1),
which is to help in obtaining a mathematical relationship that is used in deriving a discrete version of
the lter. Hence, cross multiplying and taking the inverse laplace transform of Equation (6.1) yields;
42
Tf s × y(s) + y(s) = u(s)
(6.3)
L−1 {Tf s × y(s) + y(s)} = L−1 {u(s)}
(6.4)
Tf × ẏ(t) + y(t) = u(t)
(6.5)
Now applying the Euler backward dierence on
ẏ(k) =
ẏ(t)
and knowing that
y(t) = y(k)
y(k) − y(k − 1)
h
gives;
(6.6)
And then substituting into Equation (6.5) yields;
Tf ×
y(k) − y(k − 1)
h
y(k) =
Where
u(k) = yinput (k),
a=
+ y(k) = u(k)
Tf
h
y(k − 1) +
u(k)
Tf + h
Tf + h
(6.7)
(6.8)
is the lter input.
y(k) =
We can now dene
Tf
h
y(k − 1) +
yinput (k)
Tf + h
Tf + h
(6.9)
h
Tf +h , which yields;
y(k) = (1 − a) × y(k − 1) + ayinput (k)
It is important to note that
0 ≤ a ≤ 1,
otherwise the system will be unstable.
43
(6.10)
Chapter 7
Implementation of the MPC
The performance of an MPC controller depends on the accuracy of the model. Although, it is possible
to specify for the MPC controller to incorporate integral action such that it can compensate for the
dierences between the real plant and the model of the plant.
The creation or implementation of the
MPC controller is based on a state-space model of the plant. But in the case of transfer function model
or a zero-pole-gain model, the model needs to be converted to a state-space model.
7.1 Selection of design and tuning parameters
A good MPC controller is achieved when the required design parameters are specied correctly in the
implementation process of the controller. There are quit some design parameters which are used in the
tuning of the controller.
7.1.1 Sampling period and model horizon
Sampling period
Where
ts
4t and the model horizon N
, are parameters that should be chosen such that
N 4t = ts .
is denoted the settling time for the open-loop response. This parameter selection ensures the
model to reect the complete eect of a change in an input variable over the time it needs to attain steady
state. In (Seborg E. Dale and Mellichamp, 2003), it is pointed that it is very typical that
30 ≤ N ≤ 120.
N could be
Also if the output variables are responding on dierent time scales, then dierent values of
used for each output.
7.1.2 Control horizon
This is the number of samples within the prediction horizon of which the MPC controller could aect the
control action. It is also xed for the duration of the controller's execution. If the control horizon increases,
the MPC controller tries to become aggressive such that there would be increased requirement for the
computational eort. It is sometimes denoted as
M
, and conventionally selected within
5 ≤ M ≤ 20.
M for
According to (Seborg E. Dale and Mellichamp, 2003), it is possible to specify dierent values of
each of the inputs.
7.1.3 Prediction horizon
This is the number of samples into the future during which the MPC controller would predict the plant
output. It is denoted as
P
and selected by
P =N +M
thereby making the complete eect of the most
recent input move to be accounted for. The decrement in its value results in making the controller to be
more aggressive. Thus, dierent values of
P
can be selected for each output if their settling times are
dierent. For implementation in LabVIEW program, it is denoted as Np . The desired prediction and
control horizon as dened in this task is shown in Figure 7.1
44
Figure 7.1: Prediction and control horizon
7.1.4 Weighting matrices, Q and R
The weighting matrix
Q as in the denition of the cost function in Equation (4.8), allows output variables
mP × mP diagonal Q matrix will
being weighted according to their relative importance. Note that, an
allow the output variables to be weighted individually while the most important variables will have the
largest weights.
For example, if the levels in the four (4) tank laboratory process is considered more
important than the temperature in the tank, then the tank level in that case will be assigned a larger
weighting factor.
Likewise,
R
is a weighting matrix that allows input variables to be weighted according to their impor-
tance. Also note that, an
rM × rM
matrix is referred to as an input weighting matrix. It is a diagonal
matrix whose elements are referred to as move suppression factors. Convenient tuning is achieved as a
result of increasing the values of the elements and in turn makes the MPC controller to be conservative
by the reducing the input moves.
7.1.5 Reference trajectory
The future output behavior in an MPC application are specied in a number of dierent ways like, the
set-point , reference trajectory, high and low limits. But the reference trajectory has a tunning factor
that is used in adjusting the desired speed of response for each output. The reference trajectory can be
1
specied by the concept of performance ratio .
7.2 Creation of the MPC
According to the National Instruments (NI), the specied value for the control horizon must be less
than the value to be specied for the prediction horizon. They also recommends that the length of the
prediction horizon be set according to the requirements of the control problem because both the lengths of
the prediction or control horizon cannot be changed while the controller is being executed. In (DiRuscio,
2009), it is pointed that a short prediction horizon limits the MPC controller's performance, thereby
making it to operate like a feedback controller.
A long prediction horizon increases the ability of the MPC controller to predict more eectively,
although this long prediction horizon could as well decrease the performance of the MPC controller as it
adds extra calculations to the control algorithm.
As mentioned in section 4.2.2 , the MPC controller calculates a sequence of future control actions in
such a way that a cost function is minimized. The weighting matrices in the cost function is been
specied in such a way that they help in adjusting the priorities of the control action, rate of change in
the control action and the outputs of the plant. Additionally, the constraints on the parameters of the
MPC controller in this case have been specied by the dual optimization method. It is much easier for
understanding of the target reader and/or student as it clearly indicates the initial and nal, as well as
minimum and maximum value constraints on the control action, output of the plant and the rate of
change in control action. Although, the concept of the constraints is much explained in section 4.2.3.2,
but its selection as used in creating the MPC controller is as presented in Figure 7.2 and the block
diagram in Appendix 3.
1 Performance
ratio: Is the ratio of the desired closed-loop settling time to that of open-loop settling time
45
Figure 7.2: Specied MPC constraints.
The requirement for setpoint specication to the MPC controller operates by comparing the plant input
and the output values to setpoint proles. These setpoint proles contain the predicted values of the
control action and plant output setpoints at certain time instants, the proles are been sent to the MPC
controller that calculates the error by comparing the predicted plant inputs and outputs to the setpoint
proles. The MPC controller will then try to reduce the error by minimizing a cost function which takes
this error into account.
Now parameter values exactly as used in the implementation of the multivariable control using the PI
controller as in Table 6.1 of chapter 6 are chosen and the MPC implemented successfully. The results of
the minimum phase and non-minimum phase of the process as well as with the corresponding controller
actions are shown in Figures 7.3 and 7.4.
46
Figure 7.3: Controller action in minimum phase operating condition
47
Figure 7.4: Second control loop adjusting for setpoint change in other loop
The controller is set to non-minimum phase operating condition and the results of its performance
with the process output are as in gures 7.5 and 7.6.
48
Figure 7.5: Controller action in non-minimum phase operating condition
49
Figure 7.6: Second control loop adjusting for setpoint change in non-minimum phase
50
Chapter 8
Discussions
In as much as the system is non-linear, complete expurgation of model uncertainties is not wholly guaranteed in control system design.
Although the choice of model type might not be so important now.
A linearized model of the process is used for control implementation, though not exactly as an original
linear model.
Since this thesis is aimed at comparing the performance of control strategies as applied to the fourtank process, the design is for the case of PI (proportional integral) controller and MPC (model predictive
controller) as described in Chapter 4.
Considering the PI controller implementation where the levels of the two lower tanks are controlled
by the two pumps, it results in using two independent PI controllers. And the multiloop control emerges
from these loops. The upper tanks (tank 3 and tank 4) in the system which are supplied proportionately
depending on the valve positions, thereby resulting to minimum phase and non-minimum phase operating
conditions. For the minimum phase condition, it is easy to obtain controller parameters that gives good
performance.
The PI parameters obtained in Section 4.1.2 are implemented, resulting in responses as
in Figure 6.1 and Figure 6.2 which are the operating conditions of minimum phase and non-minimum
phase respectively. The implemented controller was tested on the real process and the noted discrepancies
between the simulation and the real life responses are quite small. The process is generically dicult to
control in the case of non-minimum phase.
When there is high process interaction, with the presence
of nonlinear eects, the closed loop responses becomes very oscillatory around the setpoints. And when
some random parameters are applied using trial and error, it results in slower responses more than in
minimum phase condition. And the settling time is much longer for the non-minimum phase. Some of
the strengths of PID controller in control design are;
Excellent performance without model of the process.
It has the tendency to perform better when the process model is incorporated in it.
And the basic diculty with PID controllers is that it is a feedback system, its overall performance is
reactive since it has no direct knowledge of the process. When there is non-linearities, it may trade o
its regulation for response time.
Having evaluated the performance of the PI controller, it is very important that control loop interaction
be eliminated or considerably minimized in a multivariable process.
The MPC which is just dependent on the properties of the model of the system as described in Chapter
7, manipulates the signals to the pumps to control the levels in the lower two tanks. Some of the identied
prociencies of the MPC in the process are;
The MPC is able to eectively decouple process interaction.
It implicitly handles constraints on process inputs and outputs systematically, while having smoother
control signal.
It is able to plan control by looking ahead.
Some other advantages of the MPC documented in this thesis are in Section 4.2.
challenges identied with the MPC are;
Model development, computation as well as implementation.
Its adaptation and non-linearity handling.
51
While some of the
Lacks more friendly user interface.
It has been noticed that the tunning of the MPC controller really poses great challenge on its
implementation.
The implemented controllers (PI and MPC), have performed satisfactorily, especially in their behaviour
resulting from setpoint changes and the position of the multivariable transmission zeros. And the performance of the MPC remains thesame not minding the location of the transmission zero. The control and
simulation study of the system which is implemented independently, has shown some of the dierences
and shortcomings among the controllers.
The four-tank process has two unmeasured states, which are the levels of the upper two tanks (tank 3
and tank 4), and having implemented the Kalman estimator was able to estimate the unmeasured levels
respectively. And this estimates as in Figure 4.6 can be used when situations of sensor failure occurs.
8.1 Recommendation
I would like to suggest for onward research in the application of the MPC for controlling the 4-tank process.
This strategy really has a promising future since it is able to handle multivariable process interactions.
It is also of great importance that the sensors on the physical process be properly calibrated for onward
experiments to be carried out on it. It would be very much comfortable if subsequent experiments using
the 4-tank process are implemented rstly in the MATLAB/Simulink (especially the MPC strategy)
before been transfered to LabVIEW that has better graphical user interface, this is to ensure proper
functioning of the process as it would have an alternative test programme.
52
Chapter 9
Conclusion
The implemented controllers (PI and MPC), have performed satisfactorily in the control of the four-tank
process, especially in their behaviour resulting from setpoint changes and the varying position of the
multivariable transmission zeros.
The control and simulation study of the system which is implemented independently, has shown some
of the dierences and shortcomings among the controller types. And developing this control strategies
whose performances have been compared, really serve as a means of providing experience in analyzing
dynamic features of systems having feedback for evaluating the parameters of the control system. Control
system situations that requires compensation for time delays and multivariable interactions are thus
better handled with MPC controllers, since it is able to handle multivariable problems naturally. The
implemented strategies are kind of stepping stone for readers to gain experience in the setting up of
dierent control algorithms like the PID algorithm, MPC algorithm as well as feedback by the state. The
designed control strategies are ensured to enable remote access to documents and LabVIEW programs
for undergraduate students in Telemark university college.
53
Bibliography
DiRuscio, D. (2008). Course lecture notes in systems theory- state space analysis and control theory at
telemark university college. Telemark University College Porsgrunn, Norway.
DiRuscio, D. (2009). Course lecture notes in model predictive control (mpc) at telemark university college.
Telemark University College Porsgrunn, Norway.
DiRuscio, D. (2010). Course lecture notes in state estimator and the kalman lter at telemark university
college. Telemark University College Porsgrunn, Norway.
Gøthesen Dan-Krister, Ernst-Jarle Solberg, S. N. and Semb, A. (2009). Utvikling og analyse av 4-tank
laboratorieprosess. Technical report, Telemark University College Porsgrunn, Norway.
Haugen, F. (2004a). Dynamics Systems- modeling, analysis and Simulation. Tapir Academic Press.
Haugen, F. (2004b). PID Control. Tapir Academic Press.
Haugen, F. (2009). Lecture notes in models, estimation and control.
Johansson, K. H. (2000).
The quadruple-tank process:
A multivariable laboratory process with an
adjustable zero. IEEE.
Johansson Karl Henrik, Alexander Horch, O. W. and Hansson, A. (2009). Teaching multivariable control
using the quadruple-tank process.
Luyben, W. L. and Luyben, M. L. (1997). Essentials of Process Control. McGraw-Hill.
Numsomran A, V. Tipsuwanporn, K. T. (2008). Modeling of the modied quadruple-tank process.
Ogunnaike, B. A. and Ray, W. H. (1994).
Process Dynamics, Modeling and Control. Number ISBN:
0195091191. Oxford University Press, USA.
Rosinova, D. and Markech, M. (2008). Robust control of quadruple-tank process. ICIC Express Letters,
2(3).
Seborg E. Dale, T. F. E. and Mellichamp, D. A. (2003). Process Dynamics and Control. John Wiley &
Sons, Inc, second edition.
54
Part III
Appendices
55
Appendices
Appendix 1: Thesis Topic Description
56
57
Appendix 2: Training Kit
58
Training Kit for experimenting the 4-Tank
laboratory process using the PI and MPC
controllers.
Department of Electrical, Information Technology and Cybernetics, HiT, Norway.
June 4, 2010
1
1 Introduction
This is a laboratory work that is aimed at studying the performances of the PI
and MPC controllers by applying them to control the levels of the two lower
tanks of the 4-tank laboratory process in Telemark University College, Norway.
The four-tank process is a multivariable process that possesses non-minimum
phase characteristics depending on the position of the two valves in the process.
The performance of these controllers will be assessed and/or evaluated in a
simulator and on the real process.
2 Installation/ requirements
In order to be able to carry out this laboratory work either in Telemark University College laboratory (HiT) or on remote sites by connecting through the
internet to the college homepage, it is fundamentally required that your (user's)
computer (or Laptop) has LabVIEW programme of version 2009 or later version
already installed on it. If it is on the University (HiT) laboratory computer, then
you are (the user is) required to log on using your university account/password.
You (the user) now have to download the zip folder.zip that contains all the
VIs which is organised in a labVIEW project unto your local hard drive. Unzip and extract the downloaded folder.zip carefully and the labVIEW project
explorer with the organised VIs is opened as in Figure 1.
Figure 1: Unzipped project explorer
After having a glimpse at the VIs available and the control strategy of interest
2
is to be run, then take the steps in section 3 accordingly.
3 PI experiment
In this section, it is assumed that you are interested in performing experiment
(controlling the levels) on the four-tank process using the PI controller.
The
experiment is usually advised to be initially carried out on the simulator before
advancing to compare and conrm on the real physical process. In selecting the
PI controller to use in carrying out experiment, it is done as in Figure 2.
Figure 2: Selecting the PI controller
On selecting the PID controller as in Figure 2, you should now click on
the main VI that implements the PI controller for the process. See Figure 3 for
guidance.
3
Figure 3: Opening the main PID controller VI
And on loading the VI, PID_MAIN.vi, the front panel appears as in Figure
4. This is now ready to be run.
3.1
Procedure
Prior to running of the PID_MAIN.vi, some parameter values must rst be
congured;
•
You must select the controller mode (Manual or Auto) by pushing the
•
Then select values for
•
You then give values to set point 1 and set point 2.
•
Now, click the run button to start the program.
•
You should now observe the process carefully, and document the results
switch labelled Manual or Auto
γ1 , γ2 1
obtained with relevant plots of signals. Several parameter value changes
can be possibly done for analysing the system performance.
The Simulator and Real process are running simultaneously, and you can select
only simulator by using the Disable structure in the Block diagram.
1 The values of γ and γ to choose must be within the range of 0 to 1, which is used to
1
2
determine the proportion of water ow that is been distributed into the lower and the upper
tanks respectively. If γ1 and γ2 are set to 1 , all the ows from the pump will go into the lower
tanks. Also if γ1 and γ2 are set to 0, all the ows in this case will go into the upper tanks.
4
Figure 4: Front panel for using PI controller
5
4 MPC experiment
Now, you are about selecting the MPC controller for performing the experiment
on the laboratory process (to control the levels).
•
Go to the Project explorer as in Figure 1.
•
Then click the folder MPC controller, and then click on MPC_MAIN.vi
•
Then go to Figure 6 to open MPC program main VI.
which is the main VI for using the MPC controller.
See Figures 5 and 6 for guidance, and the MPC_MAIN.vi after loading appears
as in Figure 7.
Figure 5: Selecting MPC controller
6
Figure 6: Opening MPC main VI
And on loading the VI, MPC_MAIN.vi, the front panel appears as in Figure
7. This is now ready to be run.
7
Figure 7: Front panel for using MPC controller
4.1
Procedure
In order to start running the MPC_MAIN.vi,
•
You must select the controller mode (Manual or MPC) by pushing the
•
Then you should select Simulator or Real process by pushing the switch
•
Then give values to set point 1 and set point 2.
switch labelled Manual or MPC?
labelled, Simulator or Real process?
8
•
Now, click the run button to start the program.
•
You should now observe the process carefully, and document the results
obtained with relevant plots of signals. Several parameter value changes
can be possibly done for analysing the system performance.
5 Kalman lter experiment
Now, you are about using the Kalman lter estimator to determine some of the
levels in the process that has not been measured with hard physical sensors.
This part of the thesis work is inherently implemented in the PI controller VI
named PID_MAIN.vi. Using and observing the performance of the estimator
for the PI controller, see Figure 8 and the Kalman lter loads up immediately.
On clicking the run button, the Kalman estimator starts its estimation.
Figure 8: Kalman estimator
For further enquiries or information, see the main thesis report.
9
6 Reference
Ademu, V.O. (2010). Developing Advanced Control strategies for a 4-tank laboratory process.
10
Appendix 3: MPC Block diagram
69
Appendix 4: Discretization Block diagram
70