1
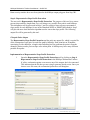
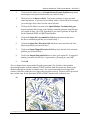
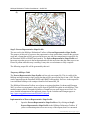
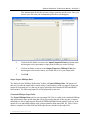
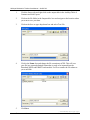
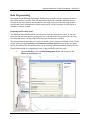
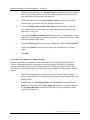
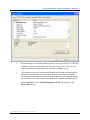
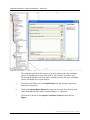
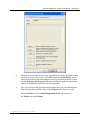
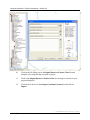
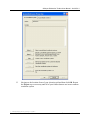
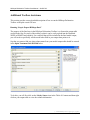
HILLSLOPE DELINEATION TOOLBOX USER MANUAL User Manual for the ArcGIS 9.3 Hillslope Delineation Toolbox Prepared for USDA Forest Service Rocky Mountain Research Station Forestry Sciences Laboratory 1221 South Main Street Moscow, Idaho 83843 Prepared by Herrera Environmental Consultants 2200 Sixth Avenue, Suite 1100 Seattle, Washington 98121 Telephone: 206.441.9080 March 26, 2012 Note: Some pages in this document have been purposely skipped or blank pages inserted so that this document will copy correctly when duplexed. Contents System Requirements...................................................................................................................... 1 System Requirements Summary .............................................................................................. 2 Hillslope Delineation Toolbox Installation ..................................................................................... 2 Installation Steps ...................................................................................................................... 2 Preparing ArcMap for Toolbox Use ........................................................................................ 5 Using the Hillslope Delineation Toolbox ....................................................................................... 8 Data Gathering ......................................................................................................................... 8 Step 1: Hydrology Processing ................................................................................................. 8 Implementation of Hydrology Processing ............................................................................... 9 Step 2: Stream and Watershed Delineation ........................................................................... 12 Implementation of Stream and Watershed Delineation ......................................................... 13 Step 3A: Disturbed WEPP Treatment Area Processing ........................................................ 15 Implementation of Disturbed WEPP Treatment Area Processing ......................................... 16 Step 3B1: ERMiT Treatment Area Processing...................................................................... 17 Implementation of ERMiT Treatment Area Processing ........................................................ 17 Step 3B2: ERMIT Burn Severity Processing ........................................................................ 19 Step 4: Representative Slope Profile Extraction .................................................................... 20 Implementation of Representative Slope Profile Extraction ................................................. 20 Step 5: Process Representative Slope Profile ........................................................................ 22 Implementation of Process Representative Slope Profile ...................................................... 22 Step 6: Export Hillslope Data ................................................................................................ 23 Implementation of Export Hillslope Data.............................................................................. 24 Step 7: Export Hillslope CSV File......................................................................................... 27 Appendix A Toolbox User Resources Tables Table 1. Formatted hillslope output table fields......................................................................... 24 jr 10-04818-000 hillslope toolbox user guide - arcgis 9.3 i Hillslope Delineation Toolbox User Manual – ArcGIS 9.3 System Requirements The Hillslope Delineation Toolbox is a custom set of tools developed to be used with GIS technology and requires two pieces of software to function successfully: ESRI ArcGIS 9.x and the ArcGIS Spatial Analyst extension. You will be unable to use the toolbox without both pieces of software installed and licensed on your machine. The Hillslope Delineation Toolbox was developed to run in ArcGIS 9.x only. If you are unsure of what version of ArcGIS you are running, please see your system adminstrator or check your ArcGIS Desktop Administrator program. To start the Desktop Administrator, make sure all ESRI programs are closed, and then click: StartAll ProgramsArcGISDesktop Administrator To see if the Spatial Analyst extension has been installed and registered, click on the Availability folder and look for Spatial Analyst in the software window. jr 10-04818-000 hillslope toolbox user guide - arcgis 9.3 March 30, 2012 1 Herrera Environmental Consultants Hillslope Delineation Toolbox User Manual – ArcGIS 9.3 System Requirements Summary ESRI ArcGIS 9.x Spatial Analyst Extension All other system requirements are the same for the Hillslope Delineation Toolbox as they are for the ArcGIS software package. For a complete list of ArcGIS 9.x system requirements, please visit the following website: http://wikis.esri.com/wiki/display/ag93bsr/ArcGIS+Desktop. Hillslope Delineation Toolbox Installation The Hillslope Delineation Toolbox runs inside the ArcGIS software and is very easy to install with a few quick steps. It is not a stand-alone program and has no executable file associated with it. Installation Steps 1. Right-click on the Hillslope Delineation Toolbox zip file and click on Extract All. This brings up the Windows Extraction Wizard. 2. Click Next. jr 10-04818-000 hillslope toolbox user guide - arcgis 9.3 Herrera Environmental Consultants 2 March 30, 2012 Hillslope Delineation Toolbox User Manual – ArcGIS 9.3 3. Change the extraction directory to: C:\Documents and Settings\[User_Name]\Application Data\ESRI\Arc Toolbox\My Toolboxes Make sure that you change [User_Name] to your Windows Login name. If you choose to save the file to a different directory, make sure to note the location for later. 4. Click Next. 5. Uncheck Show extracted files and click Finish. 6. Start the ArcMap Program by clicking StartAll ProgramsArcGISArcMap. 7. Click Window on the main toolbar. 8. Click to open ArcToolbox. 9. Right-click anywhere in the empty white space in ArcToolbox and select Add Toolbox. 10. Navigate to the location where you saved the toolbox in Step 3, select the Hillslope Delineation Tools Toolbox, and click Open. jr 10-04818-000 hillslope toolbox user guide - arcgis 9.3 March 30, 2012 3 Herrera Environmental Consultants Hillslope Delineation Toolbox User Manual – ArcGIS 9.3 11. Double-click on the Hillslope Delineation Tools toolbox inside ArcToolbox to expand the toolbox. jr 10-04818-000 hillslope toolbox user guide - arcgis 9.3 Herrera Environmental Consultants 4 March 30, 2012 Hillslope Delineation Toolbox User Manual – ArcGIS 9.3 Preparing ArcMap for Toolbox Use Before you can begin using the Hillslope Delineation toolbox, you must first make sure that the Spatial Analyst extension is both installed and activated. If any license error warnings appear while you are completing the steps below, it is possible that you either don’t have Spatial Analyst installed on your machine or it is not currently registered. Please contact your system administrator for further assistance. Activating Spatial Analyst 1. If it is not already running, start ArcMap. 2. On the main menu, click the Tools menu, and select Extensions. 3. Make sure that the box next to Spatial Analyst is checked. 4. Click Close. Field Name Settings The Hillslope Delineation Toolbox is built to run many automated steps based on the names of specific fields. To make sure that the toolbox runs correctly and is properly able to identify field names even when multiple tables are joined together, it is necessary to change one general setting for ArcToolbox before you begin. jr 10-04818-000 hillslope toolbox user guide - arcgis 9.3 March 30, 2012 5 Herrera Environmental Consultants Hillslope Delineation Toolbox User Manual – ArcGIS 9.3 1. Right click anywhere in the empty white space of ArcToolbox, and click the Environments option. 2. Click on the General Settings drop-down and make sure the box next to Maintain fully qualified field names is unchecked. jr 10-04818-000 hillslope toolbox user guide - arcgis 9.3 Herrera Environmental Consultants 6 March 30, 2012 Hillslope Delineation Toolbox User Manual – ArcGIS 9.3 3. The General Settings menu is also where you can set the Current Workspace and Scratch Workspace environments. Click in the Current Workspace box and enter the location you would like to have output files generated by the Toolbox saved to. This location is for output files that you intend to maintain. 4. Click in the Scratch Workspace box and enter the location where you would like to have intermediate files generated by the Toolbox saved to. This location is for temporary output files that you do not wish to maintain. 5. Click OK. Overwriting Geoprocessing Output To help reduce the number of existing file errors that you receive while working with the Toolbox, it is helpful to set the ArcMap document default settings to overwrite intermediate file outputs when a tool is run multiple times. 1. On the main map document toolbar, select the Tools menu then select Options and then click on the Geoprocessing tab. Make sure the Overwrite the outputs of geoprocessing operations box is checked. 2. Click OK. jr 10-04818-000 hillslope toolbox user guide - arcgis 9.3 March 30, 2012 7 Herrera Environmental Consultants Hillslope Delineation Toolbox User Manual – ArcGIS 9.3 Using the Hillslope Delineation Toolbox Data Gathering The Hillslope Delineation Toolbox requires the user to obtain and input a few GIS datasets to generate output for the Disturbed WEPP and ERMiT Batch models. Listed below are the required datasets: An elevation raster such as a 10-meter DEM or LiDAR, Polygons describing treatment or vegetation types, Polygons describing soil textures, A BARC (Burned Area Reflectance Classifiation) burn severity raster (ERMiT Batch model only), and stream centerline data with names (optional). Some of this data are publicly available for most areas, such as elevation data, stream centerlines, and soil data. Other files like treatment or vegetation type polygons will need to be generated by the user. Appendix A provides information on public data sources to help you with data gathering as well as basic instructions on creating your own data. The data also needs to meet a couple basic requirements before it can be used successfully in the Hillslope Delineation Toolbox. All data needs to be in one common coordinate system. The elevation dataset used needs to be one single raster. Grid size does not need to be consistent between the elevation and BARC rasters. Appendix A provides more information on how to preprocess data if you have multiple elevation grids or multiple coordinate systems. The following sections provide step-by-step instructions for each tool in the Hillslope Delineation Toolbox. They also explain background terminology and any important considerations that may affect your overall model results. The tools are designed to be used in a sequential order and much of the data processing itself is hidden from the user. This is to ensure that the Hillslope Delineation Toolbox can be run by a user with minimal GIS experience without the need for any additional resources besides this user guide. Step 1: Hydrology Processing The first tool in the Hillslope Delineation Toolbox is Hydrology Processing. The purpose of this tool is to run a series of hydrology processing steps on an input elevation raster in order to generate necessary output gridsfor later steps in the toolbox. The following output files will be generated by this tool: jr 10-04818-000 hillslope toolbox user guide - arcgis 9.3 Herrera Environmental Consultants 8 March 30, 2012 Hillslope Delineation Toolbox User Manual – ArcGIS 9.3 Clipped Elevation Grid The first grid that is generated by the Hydrology Processing tool is the Clipped Elevation Grid. This grid is generated by clipping an input elevation raster to an extent defined by the user. Hillshade Grid The second grid that is generated by the Hydrology Processing tool is the Hillshade Grid. A hillshade is generated by modeling illumination source angles and shadows to create a shaded relief grid that gives the user a more three-dimensional sense of on-the-ground topography. Fill Grid The third grid that is generated by the Hydrology Processing tool is the Fill Grid. This grid is generated by running the Spatial Analyst Fill command on the elevation raster to fill any closed depressions and other surface anomalies in the elevation dataset that would affect hydrology analysis on the raster. Flow Direction The fourth grid generated by the Hydrology Processing tool is the Flow Direction Grid. This grid is generated by running the Spatial Analyst Flow Direction command on the filled elevation raster to create a raster displaying the direction every pixel drains to its steepest downslope neighbor. Flow Accumulation The fifth grid generated by the Hydrology Processing tool is the Flow Accumulation Grid. This is generated by running the Spatial Analyst Flow Accumulation command on the flow direction raster to create an ouput raster of accumulated flow at each pixel. Implementation of Hydrology Processing The Hydrology Processing tool assumes that you have already obtained one single elevation raster for your study area and are now ready to process it and generate a number of output grids for later toolbox steps. If you need help in obtaining elevation data or have more than one elevation raster that you need to combine, please see Appendix A before proceeding. If you already have your elevation dataset ready, the following steps will help you get started: 1. Open the Hydrology Processing tool by clicking on Step 1: Hydrology Processing in the Hillslope Delineation Toolbox. If yellow exclamation points occur next to any of the outputs, don’t be concerned. This indicates that the file that you are trying to generate already exists. Once you choose a new file name, the exclamation point errors will disappear. jr 10-04818-000 hillslope toolbox user guide - arcgis 9.3 March 30, 2012 9 Herrera Environmental Consultants Hillslope Delineation Toolbox User Manual – ArcGIS 9.3 2. Click on the file folder icon next to the Elevation Grid drop-down and navigate to your elevation raster dataset. Notice that once you’ve selected an elevation source, the Extent Rectangle values automatically populate. These are the maximum X and Y coordinate values of your DEM dataset. Also, default output locations for the four files that will be produced in Step 1 are selected. jr 10-04818-000 hillslope toolbox user guide - arcgis 9.3 Herrera Environmental Consultants 10 March 30, 2012 Hillslope Delineation Toolbox User Manual – ArcGIS 9.3 3. Elevation grids can be quite large depending on the geographic extent and pixel size, and large files can take up a lot of storage space and processing time. The Extent Rectangle inputs are designed to allow you to clip large elevation grids to a size that better represents your study area. If you don’t want to clip your elevation grid to a smaller size, leave the minimum X and Y values with their default values. 4. To clip your raster to the extent rectangle, use the zoom tool to zoom to the display extent you want to clip your dataset to. Be sure that the display covers the whole area that you want to analyze plus a little bit of extra area. 5. In the lower right hand corner of the data frame are coordinate values for the data extent. Move your cursor around in the data space to see how these values change. jr 10-04818-000 hillslope toolbox user guide - arcgis 9.3 March 30, 2012 11 Herrera Environmental Consultants Hillslope Delineation Toolbox User Manual – ArcGIS 9.3 6. To determine the X Minimum value for your view frame, move your cursor to the very bottom left corner of the view frame and look at the coordinate values in the bottom right of the data frame. Type the first number in the pair of coordinates in the X Minimum box. 7. Next move your cursor to the very bottom right corner of the view frame and look at the coordinate values below your cursor in the data frame. Type the first number in the pair of coordinates in the X Maximum box, and then type the second number in the pair into the Y Minimum box. 8. Now scroll to anywhere in the very top of the view frame. Type the second number in the pair of coordinates in the bottom right corner of the data frame into the Y Maximum box. These four new bounding coordinates create a box that will be used to clip your raster to the view frame extent. 9. Click in the Output Clipped Elevation Grid box to name your output file. Make sure to give the raster a meaningful name that also indicates the toolbox step number such as “grid_clp_1”. Raster names cannot exceed 13 characters in length, so intuitive naming conventions are important. 10. Click in the Output Hillshade Grid box to name your output file. A suggested naming convention for this output raster is “grid_hs_1”. 11. Click in the Output Fill Grid box to name your output file.. A suggested naming convention for this output raster is “grid_fill_1”. 12. Click in the Output Flow Direction Grid box to name your output file. A suggested naming convention for this output raster is “grid_fdir_1”. 13. Click in the Output Flow Accumulation box to name your output file. . A suggested naming convention for the output raster is “grid_facc_1”. 14. Click OK. After the tool is finished running, the output raster datasets will be added to the ArcMap table of contents. Step 2: Stream and Watershed Delineation The second tool in the Hillslope Delineation Toolbox is Stream and Watershed Delineation. The purpose of this tool is to use the flow accumulation and flow direction grids generated in Step 1 to generate a stream network and delineate hillslope areas draining to each stream. The following output files will be generated by this tool: Stream Network Polylines The first output file is a shapefile of the stream network. This is derived by combining the elevation grid output generated in Step 1 with a user-defined stream accumulation threshold area. Both the streams and the hillslope areas delineated by this tool are sensitive to elevation grid jr 10-04818-000 hillslope toolbox user guide - arcgis 9.3 Herrera Environmental Consultants 12 March 30, 2012 Hillslope Delineation Toolbox User Manual – ArcGIS 9.3 resolution, and it is important to be aware of resolution limitations when using this tool. More detailed information about resolution limitations and stream threshold input is provided below in the tool instructions. Hillslope Polygons The output file from this tool is a shapefile of top, left, and right hillslope polygons. Not all hillslopes drain to streams. Implementation of Stream and Watershed Delineation 1. Open the Stream and Watershed Delineation tool by clicking on Step 2: Stream and Watershed Delineation in the toolbox. If yellow exclamation points occur next to any of the outputs, don’t be concerned. This indicates that the file that you are trying to generate already exists. Once you choose a new file name, the exclamation point errors will disappear. 2. Click on the Input Flow Accumulation Grid drop-down menu and select the flow accumulation grid that you created in Step 1. 3. Click on the Input Flow Direction Grid drop-down menu and select the flow direction grid that you created in Step 1. jr 10-04818-000 hillslope toolbox user guide - arcgis 9.3 March 30, 2012 13 Herrera Environmental Consultants Hillslope Delineation Toolbox User Manual – ArcGIS 9.3 4. Notice that an equation has been pre-entered in the Stream Threshold box. The purpose of this equation is to set a contributing drainage area limit that will determine the resolution of a polyline stream network. By default the threshold value is set to 500, which means that a stream will be defined as a connected network of pixels that have at least 500 other cells draining downslope to them. Put another way, 500 10-meter pixels is the equivalent of a contributing drainage area of 0.05 square kilometers. Establishing appropriate stream threshold cutoff values for your study area and your raster resolution size is important. Both stream networks and hillslope areas are sensitive to resolution, and the stream threshold value that you choose has a direct impact on the size and number of hillslopes that you will generate. Fine resolution rasters such as LiDAR data can accurately generate more detailed stream networks and hillslopes draining to them than course resolution datasets can. One method for determining an appropriate cutoff value for your stream raster is to experiment with values that generate results similar to known GIS stream networks from publicly available sources such as USGS (http://nhd.usgs.gov/). The figures below show examples of stream networks delineated using different stream threshold cutoff values and the hillslopes draining to them as well as the USGS stream delineation. Stream threshold value of 100 pixels (0.01km2). Stream threshold value of 500 pixels (0.05 km2). jr 10-04818-000 hillslope toolbox user guide - arcgis 9.3 Herrera Environmental Consultants 14 March 30, 2012 Hillslope Delineation Toolbox User Manual – ArcGIS 9.3 Stream threshold value of 1000 pixels (0.1 km2). USGS stream delineation. To change the threshold cutoff value, click in the white Stream Threshold box and replace the 500 value with a cutoff value of your choice. 5. Click on the file folder next to the Output Stream Network box and navigate to the location where you would like to save the stream polyline output. A suggested naming convention for this output file is “grid_stream_network_centerlines_ step2.shp”. 6. Click in the Output Watershed Grid Name to name your output file. Raster files have a limit of 13 characters or less. A suggested naming convention for this output file is “wshd_grid”. It is not necessary to specify an output folder for this file and it is important to make sure that the file name does not already exist. 7. Click in the Output Hillslope Polygons to name your output file. A suggested naming convention for this output shapefile is “hillslope_polygons_step2.shp”. 8. Click OK. Step 3A: Disturbed WEPP Treatment Area Processing The next tool in the Hillslope Delineation Toolbox is Disturbed WEPP Treatment Area Processing. If you would like to generate data for the ERMiT batch model instead, please skip to Step 3B1: ERMiT Treatment Area Processing. The purpose of this tool is to intersect the hillslope polygons created in Step 2 with treatment or vegetation type and soil texture polygons data to generate hillslope input for the Disturbed WEPP model. Optionally this tool also allows you to input named stream network polylines to determine which streams are adjacent to hillslopes. The following output files will be generated by this tool: jr 10-04818-000 hillslope toolbox user guide - arcgis 9.3 March 30, 2012 15 Herrera Environmental Consultants Hillslope Delineation Toolbox User Manual – ArcGIS 9.3 Disturbed WEPP Hillslope Polygons The Treatment Area Processing tool has only one output file. This file is an intersection of hillslopes, treatment or vegetation type, and soil texture data. It is possible for there to be more than one hillslope in a treatment or vegetation type area. Each intersection in the output file is a hillslope polygon with a unique ID. If you choose to enter named stream network data, the name of the adjacent stream for each polygon will be included in the output file. Not all hillslopes have an adjacent stream. If you need help in obtaining soil texture or named stream network data or creating treatment or vegetation type data, please refer to Appendix A before proceeding. Implementation of Disturbed WEPP Treatment Area Processing 1. Open the Disturbed WEPP Treatment Area Processing tool by clicking on Step 3A: Disturbed WEPP Treatment Area Processing in the Hillslope Delineation Toolbox. If yellow exclamation points occur next to any of the outputs, don’t be concerned. This indicates that the file that you are trying to generate already exists. Once you choose a new file name, the exclamation point errors will disappear. 2. Click on the file folder icon next to the Input Hillslope Polygons drop-down menu and navigate to the hillslope polygon input shapefile that you created in Step 2. Don’t be concerned if you see an error warning at this point. jr 10-04818-000 hillslope toolbox user guide - arcgis 9.3 Herrera Environmental Consultants 16 March 30, 2012 Hillslope Delineation Toolbox User Manual – ArcGIS 9.3 3. Click on the file folder icon next to the Input Treatment or Vegetation Type Polygons drop-down and navigate to the treatment or vegetation type data that you want to intersect with the hillslopes. 4. Click on the file folder icon next to the Input Named Stream Network Polylines drop-down menu and navigate to the stream network shapefile that you would like to use for determining the names of streams adjacent to hillslopes. If you don’t have a stream network shapefile with names available, select the stream network shapefile you generated in Step 2. This will allow the tool to function properly, but will not return any stream name values. 5. Click on the file folder icon next to the Input Soil Texture Polygons and navigate to the soil texture shapefile that you want to intersect with the hillslopes. 6. Click in the Output Disturbed WEPP Hillslope Polygons box to name your output file. A suggested naming convention for this file is“disturbed_wepp_ hillslope_polygons_step3A.shp”. 7. Click OK. Step 3B1: ERMiT Treatment Area Processing The next tool in the Hillslope Delineation Toolbox is ERMiT Treatment Area Processing. If you would like to generate data for the Disturbed WEPP batch model instead, please skip to Step 3A: Disturbed WEPP Treatment Area Processing. The purpose of this tool is to intersect the hillslope polygons created in Step 2 with vegetation type and soil texture polygons data to generate hillslope input for the ERMiT batch model. Optionally this tool also allows you to input named stream network polylines to determine which streams are adjacent to hillslopes. The following output files will be generated by this tool: ERMiT Hillslope Polygons The Treatment Area Processing tool has only one output file. This file is an intersection of hillslopes, vegetation type, and soil texture data. It is possible for there to be more than one hillslope in a vegetation type area. Each intersection in the output file is a hillslope polygon with a unique ID. If you choose to enter named stream network data, the name of the adjacent stream for each polygon will be included in the output file. Not all hillslopes have an adjacent stream. If you need help in obtaining soil texture or named stream network data or creating vegetation type data please refer to Appendix A before proceeding. Implementation of ERMiT Treatment Area Processing 1. Open the ERMiT Treatment Area Processing tool by clicking on Step 3B1: ERMiT Treatment Area Processing in the Hillslope Delineation Toolbox. If yellow exclamation points occur next to any of the outputs, don’t be concerned. jr 10-04818-000 hillslope toolbox user guide - arcgis 9.3 March 30, 2012 17 Herrera Environmental Consultants Hillslope Delineation Toolbox User Manual – ArcGIS 9.3 This indicates that the file that you are trying to generate already exists. Once you choose a new file name, the exclamation point errors will disappear. 2. Click on the file folder icon next to the Input Hillslope Polygons drop-down menu and navigate to the hillslope polygon input shapefile that you created in Step 2. Don’t be concerned if you see an error warning at this point. 3. Click on the file folder icon next to the Input Vegetation Type Polygons dropdown and navigate to the vegetation type data that you want to intersect with the hillslopes. 4. Click on the file folder icon next to the Input Named Stream Network Polylines drop-down menu and navigate to the stream network shapefile that you would like to use for determining the names of streams adjacent to hillslopes. If you don’t have a stream network shapefile with names available, select the stream network shapefile you generated in Step 2. This will allow the tool to function properly, but will not return any stream name values. 5. Click on the file folder icon next to the Input Soil Texture Polygons and navigate to the soil texture shapefile that you want to intersect with the hillslopes. 6. Click in the Output ERMiT Hillslope Polygons box to name your output file. A suggested naming convention for this file is “ermit_hillslope_polygons_ step3B1.shp”. 7. Click OK. jr 10-04818-000 hillslope toolbox user guide - arcgis 9.3 Herrera Environmental Consultants 18 March 30, 2012 Hillslope Delineation Toolbox User Manual – ArcGIS 9.3 Step 3B2: ERMIT Burn Severity Processing The next tool in the Hillslope Delineation Toolbox is ERMIT Burn Severity Processing. This step is intended for users who are preparing input data for the ERMIT model only. The purpose of this tool is to calculate an average burn severity value for each hillslope based on a user-provided burn severity raster. Input data must be in a raster format for this tool to function properly. The following output file will be generated by this tool: Burn Severity Table The ERMIT Burn Severity Processing tool has only one output file, which is a table of burn severity values that is automatically joined to the output polygon file generated in Step 3B1. Implementation of ERMIT Burn Severity Processing 1. Open the ERMIT Burn Severity Processing tool by clicking on Step 3B1: ERMIT Burn Severity Processing in the Hillslope Delineation Toolbox. 2. Click on the file folder icon next to the Input ERMiT Hillslope Polygons drop-down menu and navigate to the ERMiT hillslope polygons that you created in Step 3B1. 3. Click on the file folder icon next to the Input Burn Severity Grid drop-down meanu and navigate to the location of your burn severity raster dataset. 4. Under the Input ERMiT Hillslope Zone Field drop-down, select NEWID. 5. Click OK. jr 10-04818-000 hillslope toolbox user guide - arcgis 9.3 March 30, 2012 19 Herrera Environmental Consultants Hillslope Delineation Toolbox User Manual – ArcGIS 9.3 Burn severity statistics have now been joined to the hillslope output polygons from Step 3B1. Step 4: Representative Slope Profile Extraction The next tool is Representative Slope Profile Extraction. The purpose of this tool is to extract percent slope and flow length from every cell along every possible flow path in each hillslope. This information will be processed in Steps 5 and 6 to extract a linear average representative slope profile for each hillslope for use in the Disturbed WEPP or ERMiT batch models. Step 5 will provide more detail about the algorithm used to extract the slope profile. The following output file will be generated by this tool: Flowpath Points Output The Representative Slope Profile Extraction tool has only one output file, which is a point file of the centerpoint of each pixel in each flow path by hillslope. Each point has an ID number associating it with a hillslope, a length value indicating how far upstream the point is from the channel it drains to and a percent slope value at that point. A hillslope may have many different possible flow paths. Implementation of Representative Slope Profile Extraction 1. Open the Representative Slope Profile Extraction tool by clicking on Step 4: Representative Slope Profile Extraction in the Hillslope Delineation Toolbox. If yellow exclamation points occur next to any of the outputs, don’t be concerned. This indicates that the file that you are trying to generate already exists. Once you choose a new file name, the exclamation point errors will disappear. jr 10-04818-000 hillslope toolbox user guide - arcgis 9.3 Herrera Environmental Consultants 20 March 30, 2012 Hillslope Delineation Toolbox User Manual – ArcGIS 9.3 2. Click on the file folder next to the Input Stream Network Polylines drop-down and navigate to the grid stream network you created in Step 2. 3. The next box is for Raster cell size. Type in the resolution of your elevation raster into this box. If you have been working with a 10-meter DEM for example, you would type in the value 10 in the Linear unit box. 4. Click on the file folder icon next to the Input Hillslope Treatment Polygons drop-down menu and navigate to the hillslope treatment polygons shapefile that you created in Steps 3A or 3B1, depending if you want to generate an input file for the Disturbed WEPP or ERMiT batch models.. 5. Click on the Input Flow Accumulation Grid drop-down menu and select the flow accumulation grid that you created in Step 1. 6. Click on the Input Flow Direction Grid drop-down menu and select the flow direction grid that you created in Step 1. 7. Click on the Input Clipped Elevation Grid drop down and select the elevation grid that you created in Step 1. 8. Click in the Output Flowpath Point box to name your output file. A suggested naming convention for this file is “representative_flowpath_pts_step4.shp”. 9. Click OK. The two images below represent the flowpath point output. The first has a color gradient representing distance from the channel (FLENG column). Dark blue points are closest to the channel and bright red points are furthest away. The second represents percent slope (SLP column). Dark blue points have low slopes and red points are steep. This data will be processed into a usable form for the Disturbed WEPP or ERMiT batch models in the next step. (1) jr 10-04818-000 hillslope toolbox user guide - arcgis 9.3 March 30, 2012 21 Herrera Environmental Consultants Hillslope Delineation Toolbox User Manual – ArcGIS 9.3 (2) Step 5: Process Representative Slope Profile The next tool in the Hillslope Delineation Toolbox is Process Representative Slope Profile. The purpose of this tool is to process the representative slope profile data created in the previous steps into a format that will be processed in the next step into one comprehensive output file for the Disturbed WEPP or ERMIT batch models. The Process Representative Slope Profile tool has many steps that are run in the background and will take more time than the other steps to run. Please be patient while this step is running. It may take several minutes to fully complete. The following output file will be generated by this tool: Temporary Hillslope Table The Process Representative Slope Profile tool has only one output file. This is a table of the hillslope and representative slope profile data that will be processed in Step 6 into a CSV file that can be imported into the Disturbed WEPP and ERMIT batch models. Each row in the output file is an individual hillslope with a unique identifier field named HS_ID. The Hillslope Delineation Toolbox uses a linear averaging algorithm (Cochrane and Flanagan 2003) to extract a representative slope profile from all possible flowpaths in each hillslope. This method assumes that all flowpaths regardless of length have an equal impact on soil loss. For more detailed information on this approach, please see the Cochrane and Flanagan paper at: http://agteca.org/publications/asae46(4)1041-1049.pdf. Implementation of Process Representative Slope Profile 1. Open the Process Representative Slope Profile tool by clicking on Step 5: Process Representative Slope Profile in the Hillslope Delineation Toolbox. If yellow exclamation points occur next to any of the outputs, don’t be concerned. jr 10-04818-000 hillslope toolbox user guide - arcgis 9.3 Herrera Environmental Consultants 22 March 30, 2012 Hillslope Delineation Toolbox User Manual – ArcGIS 9.3 This indicates that the file that you are trying to generate already exists. Once you choose a new file name, the exclamation point errors will disappear. 2. Click on the file folder icon next to the Input Flowpath Points drop-down menu and navigate to the representative slope point file that you created in Step 4. 3. Click on the folder icon next to the Output Temporary Hillslope Table box and navigate to the location where you would like to save your output table. 4. Click OK. Step 6: Export Hillslope Data The final tool in the Hillslope Delineation Toolbox is Export Hillslope Data. The purpose of this tool is to take the output table created in Step 5 and combine it with user input to create one output file formatted in a way that can be easily upload into the Disturbed WEPP and ERMIT batch models. The following output file will be generated by this tool: Formatted Hillslope Output Table The Export Hillslope Data tool has only one output file. This is a table of the combined hillslope and representative slope profile data that will be processed at the end of this step into a commadelimited text file for input into the Disturbed WEPP and ERMIT batch models. Each row in the output file is an individual hillslope with a unique identifier field named HS_ID. Table 1 below shows a complete list of the fields and field types that are included in the output file. jr 10-04818-000 hillslope toolbox user guide - arcgis 9.3 March 30, 2012 23 Herrera Environmental Consultants Hillslope Delineation Toolbox User Manual – ArcGIS 9.3 Table 1. Formatted hillslope output table fields. Field Description Field Name Field Type HS_ID Long Unit ID Number UNIT_ID Text Land Type Code LAND_TYPE Text AREA Double UTREAT Text Upper Hillslope Slope Profile Length USLP_LNG Double Upper Hillslope Top Slope (Percent) UGRD_TP Double UGRD_BTM Double LTREAT Text Lower Hillslope Slope Profile Length LSLP_LNG Double Lower Hillslope Top Slope (Percent) LGRD_TP Double Lower Hillslope Bottom Slope (Percent) LGRD_BTM Double Adjacent Stream Name ADJ_STRM Text TRIB_TO Text ERMIT Top Slope (Percent) ERM_TSLP Double ERMIT Middle Slope (Percent) EM_MSLP Double ERMIT Bottom Slope (Percent) ERM_BSLP Double ERMIT Burn Severity BURNSEV Double Hillslope Unique ID Area (Acres) Upper Treatment Area Type Upper Hillslope Bottom Slope (Percent) Lower Treatment Area Type Stream Tributary Implementation of Export Hillslope Data 1. Open the Export Hillslope Data tool by clicking on Step 6: Export Hillslope Data in the Hillslope Delineation Toolbox. If yellow exclamation points occur next to any of the outputs, don’t be concerned. This indicates that the file that you are trying to generate already exists. Once you choose a new file name, the exclamation point errors will disappear. jr 10-04818-000 hillslope toolbox user guide - arcgis 9.3 Herrera Environmental Consultants 24 March 30, 2012 Hillslope Delineation Toolbox User Manual – ArcGIS 9.3 2. Click on the Input Table dropdown and select the formatted hillslope output table you generated in Step 6. 3. Click in the Input Treatment Unit ID Field box. The next several input boxes require some background explanation. Because the Disturbed WEPP and ERMIT batch models require input files with certain field names only and in a certain order, it is necessary to rename the fields from the data you have entered into the Toolbox to match this format. For example, if your input treatment area data had a field named Poly_UID to represent Unit ID, this will have to be converted to match the UNIT_ID field format required by the Disturbed WEPP and ERMIT batch models. For more detailed instructions on determining these field names, please refer to Appendix A. In the Input Treatment Unit ID Field box, type in the name of the field in your output table from Step 5 that that represents the Unit ID. The field name must be typed in brackets. In the example above, you would type [POLY_UID]. Important: You MUST enter a field name in each box. If you don’t have a corresponding field name that you want to transfer from your input table, please leave the default field names provided. 4. Click in the Input Soil Texture Field box and type in the name of the field in brackets in output table from Step 5 that represents the hillslope soil texture. jr 10-04818-000 hillslope toolbox user guide - arcgis 9.3 March 30, 2012 25 Herrera Environmental Consultants Hillslope Delineation Toolbox User Manual – ArcGIS 9.3 5. Click in the Input Upper Treatment or Vegetation Type Field box and type in the name of the field in brackets in your output table from Step 5 that represents the upper hillslope treatment type. 6. Click in the Input Lower Treatment or Vegetation Type Field box and type in the name of the field in brackets in your output table from Step 5 that represents the lower hillslope treatment type. Note: ERMiT does not have upper and lower treatment types. If you are generating output for the ERMiT batch model, enter your vegetation type field in brackets for both the Input Upper Treatment or Vegetation Type Field box and the Input Lower Treatment or Vegetation Type Field box. 7. Click in the Input Adjacent Stream Name Field box and type in the name of the field in brackets in your output table from Step 5 that represents the names of adjacent streams. 8. Click in the Input Stream Tributary Field box and type in the name of the field in brackets in your output table from Step 5 that represents the names of tributaries to adjacent streams. The figure below shows field names entered for all boxes. In this example, there is no field information to transfer for stream tributary information, so the default field name from Table 1 is entered into the Stream Tributary Field box. jr 10-04818-000 hillslope toolbox user guide - arcgis 9.3 Herrera Environmental Consultants 26 March 30, 2012 Hillslope Delineation Toolbox User Manual – ArcGIS 9.3 9. Notice that there is a list of fields with check boxes in the Delete Fields box. This is a complete list of all fields that are in the output file that you generated in Step 5. To ensure that the final output file is compatible with the Disturbed WEPP or ERMIT batch models, it is necessary to delete any additional fields that are not included in Table 1. Click on the Select All button under the Delete Fields box. Starting at the top, look for the field HS_ID and uncheck the box. Then uncheck each box after it until you reach BURNSEV. Everything after this field should remain checked. This represents all of the fields shown in Table 1 and will delete all other fields that are not in the proper format for the Disturbed WEPP and ERMIT batch models. 10. Click on the folder icon next to the Formatted Hillslope Output Table box and navigate to the location where you would like to save your output table. 11. Click OK. Step 7: Export Hillslope CSV File IMPORTANT: One step outside of the Toolbox is necessary to convert the DBF file created in Step 6 to a comma-delimited CSV that will be compatible with the Disturbed WEPP and ERMiT batch models. jr 10-04818-000 hillslope toolbox user guide - arcgis 9.3 March 30, 2012 27 Herrera Environmental Consultants Hillslope Delineation Toolbox User Manual – ArcGIS 9.3 1. Click the Source tab and right-click on the output table in the ArcMap Table of Contents and click Export. 2. Click on the file folder in the Output table: box and navigate to the location where you want to save your data. 3. Click on the Save as type drop-down box and select Text File. 4. Click in the Name: box and change the file extension to .CSV. This will save your file in a comma-delimited format that is ready to be imported into the Disturbed WEPP and ERMIT batch models. Feel free to name the file whatever you would like. 5. Click Save. jr 10-04818-000 hillslope toolbox user guide - arcgis 9.3 Herrera Environmental Consultants 28 March 30, 2012 Hillslope Delineation Toolbox User Manual – ArcGIS 9.3 6. Click OK. Your data is now formatted and ready to be imported into the Disturbed WEPP and ERMIT model batch macro spreadsheets. jr 10-04818-000 hillslope toolbox user guide - arcgis 9.3 March 30, 2012 29 Herrera Environmental Consultants APPENDIX A Toolbox User Resources Hillslope Delineation Toolbox User Manual – ArcGIS 9.3 Data Gathering The Hillslope Delineation Toolbox requires you to obtain or create a few GIS datasets to generate output for the Disturbed WEPP or ERMiT batch models. The following sections provide some basic information on obtaining and creating GIS data for the Hillslope Delineation Toolbox. Data Gathering The Hillslope Delineation Toolbox requires a few GIS datasets to run successfully. These include an elevation raster such as a 10-meter DEM or LiDAR, polygons describing treatment or vegetation types, soil type polygonsand optionally stream centerline data with names. Some of this data is publicly available, such as elevation data, soil types, and stream centerlines. Other data like treatment area or vegetation types are generated by the user. Below is some information on public data sources to help you with data gathering Basic information on creating new GIS data can be found in the next section. Elevation Grid Elevation gridscan be obtained for most areas from USGS with 10-meter pixels. For more information, please see the USGS website at http://eros.usgs.gov/#/Guides/dem. Higher resolution data like LiDAR may be available on a project basis depending on the geographic extent. For example, Washington State has a public LiDAR Consortium website with data for a portion of the state and Oregon has a similar site being produced. A quick look at a search engine will help you determine what is available for your specific area. Stream Centerlines Stream data is readily available for most areas in a range of resolutions and with many different attributes. One good source of stream data for the continental United States is the National Hydrography Dataset from USGS. The website address is http://nhd.usgs.gov/data.html. Websites like the University of Oregon Library site also often have lists of GIS data sources that are available by state. This site is located at http://libweb.uoregon.edu/map/map_section/ map_Statedatasets.html. Soil Types Soil data is available for download for most areas through the USDA National Resources Conservation Service website. This site is located at http://soildatamart.nrcs.usda.gov/ SDM%20Web%20Application/default.aspx. Data Creation Some datasets required for the Hillslope Delineation Toolbox such as vegetation and treatment types may not be readily available from a public source and will instead need to be generated by jr 10-04818-000 hillslope toolbox user guide arcgis 9.3 - appendix a March 30, 2012 A-1 Herrera Environmental Consultants Hillslope Delineation Toolbox User Manual – ArcGIS 9.3 the user before running the Toolbox. If you are unfamiliar with GIS and need further assistance on generating your own data, please refer to the following ArcGIS 9.3 tutorial sources: http://webhelp.esri.com/arcgisdesktop/9.3/pdf/ArcMap_Tutorial.pdf http://blogs.esri.com/esri/esritrainingmatters/2009/08/11/need-gis-data-learn-howto-create-your-own/ jr 10-04818-000 hillslope toolbox user guide arcgis 9.3 - appendix a Herrera Environmental Consultants A-2 March 30, 2012 Hillslope Delineation Toolbox User Manual – ArcGIS 9.3 Data Preprocessing Data inputs for the Hillslope Delineation Toolbox meet a couple of basic requirements before they can be used successfully. First, all data needs to be in one common coordinate system. Second, the elevation dataset used needs to be one single raster grid. The following sections provide some basic information on preprocessing data if you have multiple elevation grids or multiple coordinate systems. Preparing the Elevation Grid The Hillslope Delineation Toolbox can only process one elevation grid at a time. If you have more than one elevation grid for your project area, you will need to merge them into one large elevation grid before you begin.The following steps describe how to do this. These instructions assume that your rasters are already in one common coordinate system. If they are not, please see the Converting to a Common Coordinate System section of this user guide before proceeding. This also assumes that you are working with rasters with the same pixel size. Detailed information on resampling pixel size is not provided in this user guide. 1. Open ArcToolbox, click on Data Management Tools, and navigate to the Mosaic to New Raster tool. jr 10-04818-000 hillslope toolbox user guide arcgis 9.3 - appendix a March 30, 2012 A-3 Herrera Environmental Consultants Hillslope Delineation Toolbox User Manual – ArcGIS 9.3 2. Click on the file folder next to the Input Rasters box and navigate to the location where your elevation grids are saved. Repeat this step until you’ve added all of your individual elevation grids to the input box. 3. Click on the file folder next to the Output Location box and navigate to the location where you want to save your merged elevation grid. 4. Click in the Raster dataset name with extension box and type in a name for your output merged elevation raster. A suggested naming convention for this output file is “mrg_elev”. 5. Leave the Coordinate system for the raster box blank. You should have already converted all of your grids to a common coordinate system before this step, so the default coordinate system is fine. 6. Click on the Pixel type drop-down menu. Change this value to 32_BIT_FLOAT. 7. Click in the Cellsize box and type in the same pixel resolution as your input rasters. 8. Click OK. Converting to a Common Coordinate System Datasets with different coordinate systems should not be used in the Hillslope Delineation Toolbox. Although the toolbox may appear to function correctly, differences in coordinate systems can introduce error into your analysis that may be difficult to identify in the results. The following steps will help make sure that you have no coordinate system problems with the toolbox. 1. Add all of the datasets that you plan to use in your analysis into an ArcMap project. This includes your elevation grid, treatment area data, landuse data, and named streams. 2. Right click on your elevation grid data, click Properties, and then click the Source tab. This brings up the raster properties window. Scroll down until you see the Spatial Reference information. This tells you what coordinate system your elevation grid is in. jr 10-04818-000 hillslope toolbox user guide arcgis 9.3 - appendix a Herrera Environmental Consultants A-4 March 30, 2012 Hillslope Delineation Toolbox User Manual – ArcGIS 9.3 3. Repeat this step for each dataset that you plan to use in your analysis. If all of the coordinate systems for each dataset are the same you are done. If not, the next step is to project your datasets into one common coordinate system. 4. The coordinate system of your merged elevation grid is what will determine the coordinate system for the rest of your data. If you are working with multiple elevation grids with different coordinate systems that need to be merged together, you will first need to project these datasets into one common coordinate system. Open ArcToolbox, click on Data Management Tools, and navigate to the Project Raster tool. jr 10-04818-000 hillslope toolbox user guide arcgis 9.3 - appendix a March 30, 2012 A-5 Herrera Environmental Consultants Hillslope Delineation Toolbox User Manual – ArcGIS 9.3 The coordinate system for the majority of your elevation grids is the coordinate system you should project your other grids to. For example, if you have four elevation grids and three are in the same coordinate system, that is the coordinate system you should use for your analysis. 5. Click on the file folder next to the Input Raster box and navigate to the raster that you need to project. 6. Click in the Output Raster Dataset box and type in a name for your projected raster. Remember that the limit for raster naming is 13 characters. 7. Click on the icon next to the Output Coordinate System box and click on Import. jr 10-04818-000 hillslope toolbox user guide arcgis 9.3 - appendix a Herrera Environmental Consultants A-6 March 30, 2012 Hillslope Delineation Toolbox User Manual – ArcGIS 9.3 8. Navigate to the location of one of your raster datasets with the coordinate system you want to use for your project. Click OK. Repeat the Project Raster step as necessary until all of your raster datasets are in one common coordinate system. See the Preparing the Elevation Grid section of this user guide for instructions on how to combine these grids into one elevation raster. 9. Now you will repeat the projection steps describe above for your other datasets. These are polygon or polyline files, so the Project tool for features is used. Open ArcToolbox, click on Data Management Tools, and navigate to the Project tool under Feature. jr 10-04818-000 hillslope toolbox user guide arcgis 9.3 - appendix a March 30, 2012 A-7 Herrera Environmental Consultants Hillslope Delineation Toolbox User Manual – ArcGIS 9.3 10. Click on the file folder next to the Input Dataset or Feature Class box and navigate to the shapefile that you need to project. 11. Click in the Output Dataset or Feature Class box and type in a name for your projected shapefile. 12. Click on the icon next to the Output Coordinate System box and click on Import. jr 10-04818-000 hillslope toolbox user guide arcgis 9.3 - appendix a Herrera Environmental Consultants A-8 March 30, 2012 Hillslope Delineation Toolbox User Manual – ArcGIS 9.3 13. Navigate to the location of one of your elevation grid and then click OK. Repeat the Project step as necessary until all of your feature datasets are in one common coordinate system. jr 10-04818-000 hillslope toolbox user guide arcgis 9.3 - appendix a March 30, 2012 A-9 Herrera Environmental Consultants Hillslope Delineation Toolbox User Manual – ArcGIS 9.3 Additional Toolbox Assistance This section provides a more detailed description of how to run the Hillslope Delineation Toolbox to help the casual GIS user. Running “Step 6: Export Hillslope Data” The purpose of the final step in the Hillslope Delineation Toolbox is to format the output table created in the first five steps of the toolbox so that it can be easily upload into the Disturbed WEPP or ERMIT batch models. For each field that will be included in the final model output, you will need to specifically tell the model what field in your output data points to it. Say that you want to find out what column name from your model output table should be entered in the Input Treatment Unit ID Field below. To do this, you will first click on the List by Source icon in the Table of Contents and then right click on your output table to view the column information. jr 10-04818-000 hillslope toolbox user guide arcgis 9.3 - appendix a Herrera Environmental Consultants A-10 March 30, 2012 Hillslope Delineation Toolbox User Manual – ArcGIS 9.3 Notice that the first 18 columns (up through BURNSEV) match the columns listed in Table 1 in the main user guide. These are the “placeholder” columns that have been set up to ensure compatability with the Disturbed WEPP or ERMiT batch models. Scroll to the right past the BURNSEV field. These are the field names that will be entered into Step 6 of the Toolbox. Don’t be concerned if your field names differ from this example. jr 10-04818-000 hillslope toolbox user guide arcgis 9.3 - appendix a March 30, 2012 A-11 Herrera Environmental Consultants Hillslope Delineation Toolbox User Manual – ArcGIS 9.3 In this example, you will notice a field six columns to the right called ID that contains sequential unit ID numbers. To point the Input Treatment Unit ID Field prompt towards the ID field in the example dataset, you would replace [UNITID] with [ID] in brackets. jr 10-04818-000 hillslope toolbox user guide arcgis 9.3 - appendix a Herrera Environmental Consultants A-12 March 30, 2012 Hillslope Delineation Toolbox User Manual – ArcGIS 9.3 The same process of looking up column names in your output table and entering them into the Step 6 input fields that they correspond to should be repeated for all six inputs. If you do not wish to point a field from your output table to a Step 6 input field, simply leave the bracketed field name defaults that are present when you open the user interface. It is very common when joining multiple datasets in GIS to have very similar field names occur within the same table. For example, your output table might contain one called Land_Typ and one column called Land_Typ_1. It is important to open up your output table to look closely at what field name you are intending to use before you enter it into the Step 6 user interface. jr 10-04818-000 hillslope toolbox user guide arcgis 9.3 - appendix a March 30, 2012 A-13 Herrera Environmental Consultants