1
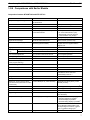
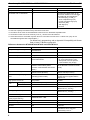
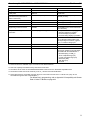
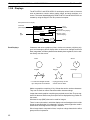
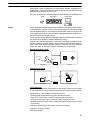
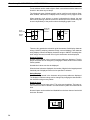
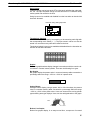
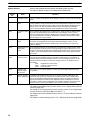
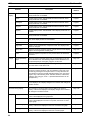
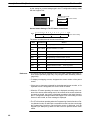
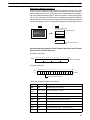
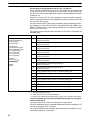
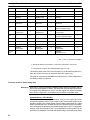
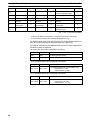
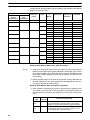
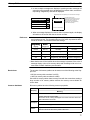
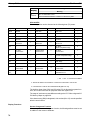
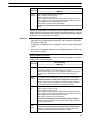
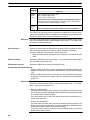
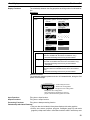
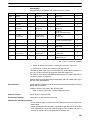
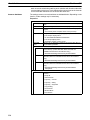
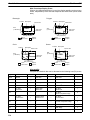
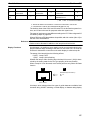
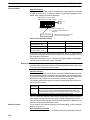
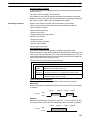
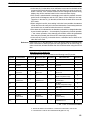
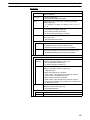
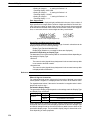
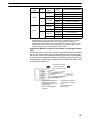
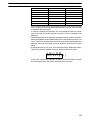
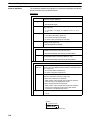
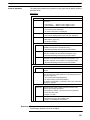
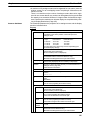
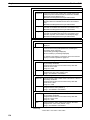
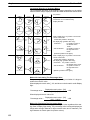
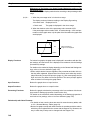
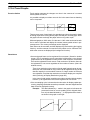
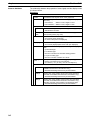
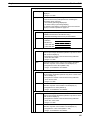
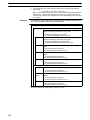
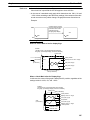
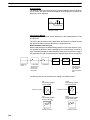
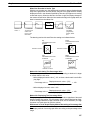
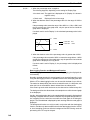
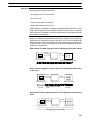
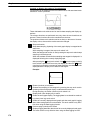
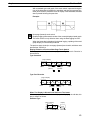
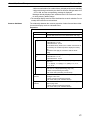
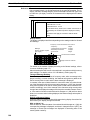
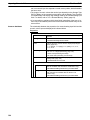
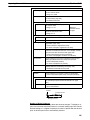
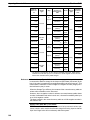
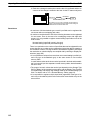
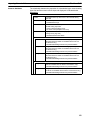
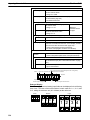
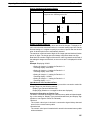
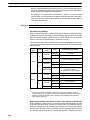
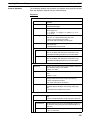
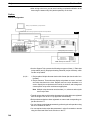
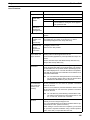
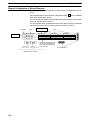
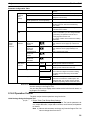
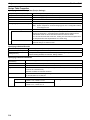
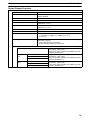
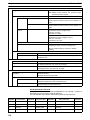
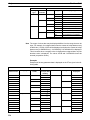
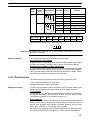
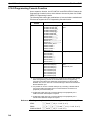
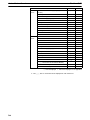
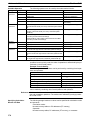
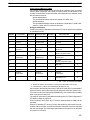
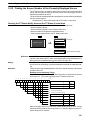
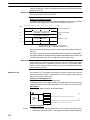
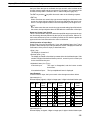
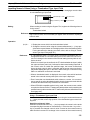
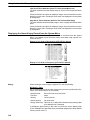
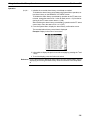
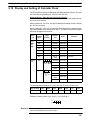
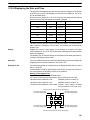
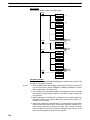
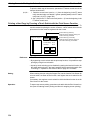
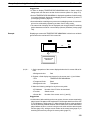
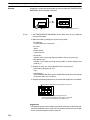
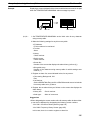
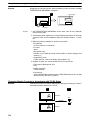
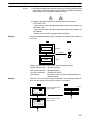
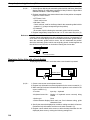
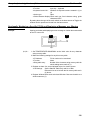
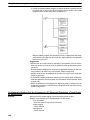
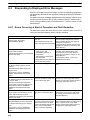
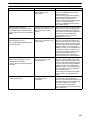
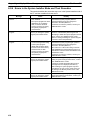
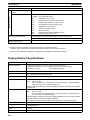
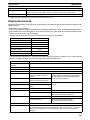
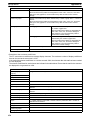
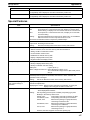
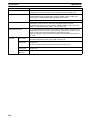
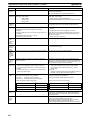
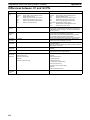
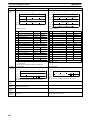
Section 2-10
Graphs
Common Attributes
The relationship between the properties of a trend graph and the display results
is indicated below.
Properties
General
Position
Coordinates of the top left corner of the graph area.
Size
Width and height of the area in which the graph is displayed
(dot units)
NT31/NT31C:
Width 2 to 320; Height 2 to 240
NT631/NT631C: Width 2 to 640; Height 2 to 480
Display
Type
Method for drawing the line (Line drawing method, page 166)
Drawing
Width
Interval between consecutive data on the drawn graph in dot
units (Drawing width, page 166)
Standard/Pen Recorder
Frame
Whether or not a frame is displayed for the graph area
Check mark (frame displayed)/
No check mark (frame not displayed)
Display Sign
Whether or not a negative area is displayed.
Check mark (displayed)/No check mark (not displayed)
Direction
Direction of motion of the graph (Line drawing method, page
166)
Up/down/left/right
For standard type:
Direction of motion from the latest drawing position
For pen recording type:
Direction of motion of the line as a whole
Sampling
Cycle
Cycle (time interval) for data reading (graph updating)
Range: 0.5 to 6553.5 in 0.5 second units
(5 to 65535 ( 0.1) for entry; must be a multiple of 5)
Color
Frame
Display color of the frame (Colors other than black and white are
available with the NT31C and NT631C only.)
Black/Blue/Red/Magenta/Green/Cyan/Yellow/White
+ Range
Display color of the positive range (Colors other than black
and white are available with the NT31C and NT631C only.)
Black/Blue/Red/Magenta/Green/Cyan/Yellow/White
– Range
162
Display color of the negative range (Colors other than black
and white are available with the NT31C and NT631C only.)
(effective only when a check mark is set for Display Sign)
Black/Blue/Red/Magenta/Green/Cyan/Yellow/White