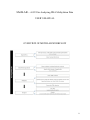
1
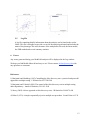
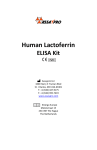
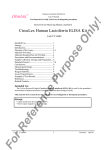
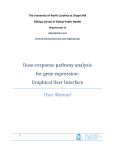
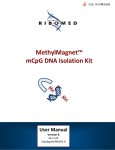
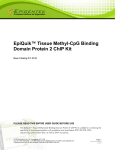
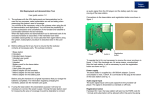
MethLAB – A GUI for Analyzing DNA Methylation Data
USER’S MANUAL
OVERVIEW OF METHLAB WORKFLOW
0
Table of Contents
1. Introduction … 2
2. Statistical Analysis … 2
3. Getting Started … 2
3a) System Requirements … 2
3b) Installing R … 2
3c) Installing the tcltk library … 3
3d) Installing MethLAB … 3
3e) Launching the MethLAB GUI … 3
4. Running MethLAB … 4
4.0) Formatting Files … 4
4.1) Loading Files … 5
4.2) Data Manipulation … 6
4.2.1) Subject Selection … 6
4.2.2) CpG Selection … 7
4.3) Data Analysis … 8
5. Output Files … 9
5.1) Text File … 9
5.2) Q-Q Plots …10
5.3) Manhattan Plot … 11
5.4) Plots of Individual CpG sites … 11
6. Errors … 12
1
1.
Introduction
DNA methylation is a type of epigenetic modification that has been associated with numerous
complex traits and diseases. MethLAB provides a graphical user interface (GUI) to facilitate
analysis of DNA methylation microarray data, allowing users with no experience using statistical
software to implement flexible and powerful analyses of array-based DNA methylation data.
2.
Statistical Analyses
Microarrays such as the Illumina GoldenGate and Infinium platforms typically interrogate DNA
methylation of an individual sample across the genome and output "beta values" that represent
the proportion of DNA methylated at an individual CpG site. MethLAB evaluates the association
between beta values and a designated continuous or categorical phenotype by fitting a separate
linear fixed or mixed effects model for each CpG site. This package can incorporate both
continuous and categorical covariates, as well as fixed or random batch or chip effects. The
package produces quantile-quantile (Q-Q) plots with confidence intervals to allow users to
visually assess whether there is an excess of associated CpG sites and can also produce
Manhattan plots and CpG-specific scatterplots and boxplots. It accounts for multiple tests by
controlling false discovery rate (FDR) at a user-specified level using one of many optional FDR
methods and automates plotting of the beta values against the phenotype for top CpG sites.
Bonferroni adjustments are also provided. Results for all CpG sites analyzed are output in a
manageable .txt file format that can be opened with standard spreadsheet software.
3. Getting Started
a) System Requirements
R must be installed. The program has been tested in systems with >2 GB of RAM and
>1.5 Ghz processor. However, the analysis time will vary depending on the analysis
selected and the processing speed of the system you use. For example, a standard analysis
of ~27,000 CpG sites and 300 subjects that included fixed effects for chip ID took less
than a minute on a machine with 4GB RAM and a 1.5 Ghz dual core processor. With
random instead of fixed effects, the analysis took ~40 minutes on the same machine. A
450k dataset with 200 subjects was also analyzed on the same machine and a fixed
effects analysis took less than 3 minutes to finish. However, we strongly recommend
using a system with higher RAM to run large 450k datasets.
b) Installing R
MethLAB operates as a package within R and requires R version 2.11.1 or higher. R can
be downloaded and installed from the following links:
For Windows OS: http://www.biometrics.mtu.edu/CRAN/bin/windows/base/
For Mac OS: http://www.biometrics.mtu.edu/CRAN/bin/macosx/
c) Installing the tcltk library
MethLAB uses the tcltk library to provide a graphical user interface. This comes preinstalled with R for Windows. Mac users who have not already installed the tcltk library
2
may download and install the tcl library from:
http://www.biometrics.mtu.edu/CRAN/bin/macosx/tools/
Mac users will also need to follow an additional step:
Installing BWidget:
Download the BWidget tool using the link here. Double click it to unpack it and create
the folder BWidget-1.8.0. Open your terminal and type the following commands to finish
the installation process.
• cd ~/Desktop(or the folder name that contains the unpacked file)
• sudo mv BWidget-1.8.0/ /usr/local/lib
d) Installing MethLAB
MethLAB can be downloaded from the URL:
http://genetics.emory.edu/conneely/MethLAB. It is in the form of a zipped file.
Once the file is downloaded follow the instructions below:
For Windows OS:
• Click on the “Packages” button, which is on the top menu of the R Gui.
•
•
Select “Install package(s) from local zip files” from the “Packages” menu.
Follow the prompts as they show up on the screen.
For Mac OS:
• Click on the “Packages & Data” option on the Main menu bar.
• Select the “Package Installer” option from the dropdown menu.
• In the Installer window, choose "Local Source Package” from the dropdown menu.
• Click the “Install” button and browse to the location where the “MethLAB” tar file
has been downloaded. Click “Open” to install.
e) Launching MethLAB
• When installation is complete, call the program by typing the following commands
at the R command line:
> library(MethLAB)
> MethLAB()
• The MethLAB GUI will appear within 45 seconds.
3
4. Running MethLAB
To begin an analysis, use the dropdown Files menu to open the phenotype and methylation files.
Please note that all other features are disabled until both a phenotype and a methylation file have
been specified (unless a methylation file has been opened previously – see section 4.1 b).
4.0 Formatting Input Files
a) The phenotype file can be either a .txt file or
a .csv file with each column representing a
sample and each row representing a phenotype.
A sample phenotype file is available at
http://genetics.emory.edu/conneely/MethLAB.
b) The methylation file can be formatted as a
.txt or .csv file where each column represents a
sample and each row represents a CpG site.
The first column of the methylation file should
contain unique CpG site labels. The
methylation file cannot include any other
column with text; text/annotation can be
included in the annotation file. A sample
methylation file is available at
http://genetics.emory.edu/conneely/MethLAB.
c) The annotation file can contain essentially any
information but the first column of the annotation file
should contain unique CpG site labels consistent with
the methylation file. MethLAB uses the CpG site
labels to match the annotation file and the
methylation file. However, its not necessary for the
CpG sites in the annotation file to be in the same
order as those in the methylation file, and it is fine if
your annotation file has a different number of rows
than the methylation file. If a Manhattan plot is
desired, the file should include columns with the
headers CHR and MAPINFO to indicate
chromosome (1-22, X, Y) and position (must be
numeric). A sample Annotation file is available at
http://genetics.emory.edu/conneely/MethLAB.
4
4.1 Loading Files
Note: for your first time running MethLAB, you may
want to do a trial run using the sample phenotype and
methylation files available at
http://genetics.emory.edu/conneely/MethLAB.
a) In the main menu, click the “Files” button and select
the option “Open Phenotype File” to bring up a dialog
box. Browse/select your file.
b) A preview file should be displayed. Check the
output window to see the dimensions of the phenotype
file.
c) Under “Files”, select “Open Methylation File” and
browse/select your methylation file. A progress bar
will appear. (Note that on Macs, the progress bar will
not depict loading progress accurately.) Large files
(e.g. 450K data) may take 5-30 minutes to load the
first time. Another preview file will appear. Check
preview file and output window to verify that the file
loaded properly.
To avoid having to reload the file in subsequent
analyses, the methylation dataset is saved as a
database file on your local hard drive. For subsequent
analyses MethLAB will use the most recently opened
methylation file for the new session without having to
reload the entire file, unless the user selects a new methylation file. (Note that for files
>6GB, MethLAB will not save the file to the local drive.) If a methylation file has been
opened previously, the Log Window will display "The most recently opened methylation
file will be used by default unless a new file is selected.”
d) The annotation file is optional and can be loaded by selecting “Open Annotation File”
from the “Files” menu. Check the output window to confirm that the file has loaded.
Note: An annotation file with the fields CHR and MAPINFO is required to produce a
Manhattan plot – see 4.0d.
e) Selecting Output Directory
MethLAB outputs a number of files as part of each analysis. Select the location for these
files to be saved by clicking the “Select Output Directory” option of the “Files” Menu.
5
4.2 Data Manipulation
MethLAB allows users to specify selection criteria
within a large dataset. By default, all available
subjects and CpG sites will be analyzed, but a
subset of subjects or CpG sites can be selected for
analysis by following the steps below. Users who
intend to analyze all subjects and CpG sites in the
input datasets can skip to section 4.3.
a) Select subjects to analyze through the option
“Inclusions & Exclusions” under the “Data
Manipulation” pulldown menu. (See 4.2.1.)
b) Select CpGs that you would like to analyze
using the option “CpG Selection under the
“Data Manipulation” menu. (See 4.2.2.)
If no selections are made, all available subjects and
CpG sites will be analyzed.
4.2.1
Subject Selection
Upon opening the subject selection screen, select
subjects based on inclusion or exclusion criteria.
a) Specify a phenotype or trait and a boolean
operator (<, =, or >) from the Inclusion and
Operator drop-down menus, and input
numeric criteria in the Inclusion Criteria box.
For example, if the dataset includes subjects
from 4 racial groups denoted 1 to 4, and the
user wants to evaluate only subjects from
groups 1 and 2, then select ”Race” from the
Inclusion menu, “<” from the operator menu
and type ”3” in the Inclusion Criteria box.
b) A similar strategy can be used to
specify exclusions according to
the example below. Note that
MethLAB is currently enabled to
perform inclusions/exclusions
based on numeric variables only.
6
c) More complex data manipulations can
be accomplished by specifiying
combinations. Two inclusions and/or
two exclusions, connected by boolean
operators, can be specified. For
example, to limit by race and gender,
input the necessary criteria in the two
inclusion criteria and use the boolean
operator “AND”. To avoid errors, it is
imperative that you specify a boolean
operator if you have two or more
inclusion/exclusion criteria as shown
to the left.
d)
4.2.2
CpG Selection
a) By default, MethLAB will analyze all CpG sites in the
methylation file. If you would like to analyze only a subset
of CpG sites, include the names of the CpG sites you would
like to analyze in a .txt or .csv file. The file should contain a
column header as shown to the right. Note that if fewer
than 100 CpG sites are included in the analysis, QQ plots
and Manhattan plots will not be produced.
b) Using the “CpG Selection”
option under the Data
Manipulation menu, load the
.txt or .csv file into
MethLAB.
7
4.3 Data Analysis
1) Under the “Analysis” menu, select “Linear Regression” to analyze data.
2) A list of phenotype variables from the selected phenotype file will appear.
a) Beta Model= – Default: Untransformed Beta Values
Select either untransformed or logit transformed beta values as the dependent
variable for your linear model. The logit transform, log(beta/(1-beta)) is equivalent
to the M-value or the log signal ratio commonly analyzed in the gene expression
literature (in this case it is the log ratio of methylated to unmethylated signal).
b) Covariate Type – Default: Continuous Covariate
Because MethLAB allows both continuous and categorical covariates, covariate
type must be specified in the Covariate Type box before selecting the variable. By
default, variables are continuous. If a “Class Covariate” is selected, the variable
will be represented as a factor (categorical variable) in the linear model text box.
c) Linear Model – Double click variables from the Variable Selection box to select
the independent variable and covariates. The model will appear in the Linear Model
box in the form x1+x2+x3+x4, where x1 is the independent variable to be tested for
association and x2-x4 are additional continuous or categorical covariates.
d) Random Effects Covariate – Users may choose to adjust for technical variation by
modeling batch or chip ID as fixed or random effects.
•
•
To include as a fixed effect, simply enter batch or chip ID into the linear model as
a categorical covariate.
To include as a random effect, select batch or chip ID as a Random Effects
Covariate.
8
•
•
Note that MethLAB has been optimized to perform fixed effects analyses
extremely rapidly. Due to their speed, fixed effects analyses are the best choice for
the initial analysis of a dataset; this is particularly true for large datasets (e.g.,
Illumina 450K).
Inclusion of random effects, implemented through the nlme() package, slows the
analysis considerably but may increase power. In general, random effects are
appropriate when the number of chips is large (ie, >10) and the number of samples
per chip is not too small (ie, <5). For analyses with small samples or sample
exclusions, this condition may not be met, and random effects analyses are likely
to crash. In these cases, fixed effects analyses are a better choice.
e) FDR Method – Default: BH method
Multiple testing is controlled via a user-defined FDR method. The user may choose
from three FDR methods: the Benjamini-Hochberg (BH) method (1), the
Benjamini-Yekutieli (BY) method (2), and the qvalue function by Storey et.al (3).
f) FDR Criterion – Default: .05
Multiple testing is controlled via FDR. To specify the FDR cutoff, enter a number
between 0 and 1. In addition, a stepdown version of Bonferroni significance (Holm
significance (4)) is calculated for each of the CpG sites.
g) Methylation Dataset – Default: “Complete CpG Dataset” (“CpG data subset”
if the user selects a subset file or "Global Analysis to perform a global
methylation analysis)
Users may select a smaller number of CpG sites to be analyzed by selecting the
“CpG data subset” option (see 4.2.2). Unless a subset file is selected, MethLAB
defaults to the “Complete CpG Dataset” option, which analyzes all CpG sites in the
specified methylation file. If a subset is selected, MethLAB will perform the
analysis and adjust for multiple testing with only that subset. If “Global Analysis”,
is selected, MethLAB will instead evaluate the association between the phenotype
and average beta values across all available CpG sites. This analysis seeks to
identify global methylation patterns by fitting a linear model based on average beta
values rather than individual CpG sites. For simplicity, the input and output formats
are similar for complete, subset, and global analyses..
3) Click the “Analyze” button to start an analysis under the specified model; a progress
bar should appear. Note: The progress bar may not be a very accurate representation
of the progress in the case of a fixed effects analysis.
9
5. Output Files
5.1
Text File
MethLAB outputs a text file that contains the t-statistics, p-values and flags indicating the
Bonferroni/Holm significance and FDR significance of each CpG site for a given model.
Additional fields containing CpG annotation information will be included if available
(see 4.0.d and 4.1.d).
5.2
Q-Q Plots
For every analysis with >100 CpG sites, MethLAB produces both classic and modified
quantile-quantile (Q-Q) plots for the –log p-values and for the t-statistics with confidence
intervals.
10
5.3
Manhattan Plot
For analyses of >100 CpG sites, MethLAB automatically outputs a Manhattan plot if an
annotation file is specified with the chromosome and position information for each CpG
site. The column header for the column containing the chromosome information should
be “CHR,” and the column header for the column containing the position information
should be “MAPINFO”.
11
5.4
Plots of Individual CpG sites
After the analysis is finished, the number of CpG sites significant at the specified FDR
will be indicated. (Alternatively, if <100 CpG sites are included in the analysis, a Holm
cutoff will be used.) MethLAB automates plots of the beta values against the phenotype
for the top CpG sites, with regression lines
based on the specified model. Enter the
number of plots to be generated in the
dialogue box, and press OK. (For example, if
“5” is entered, plots will be generated for the
5 most significant CpG sites.)
Scatterplots will be made for continuous outcomes. Box plots will be made for
categorical outcomes if the independent variables are coded as “factor”.
12
5.5
Log File
A log file containing helpful information about the analysis can be found in the results
folder. This file is designed to provide a record of the analysis performed and includes the
name of the phenotype file used, the name of the methylation file used, the linear model,
the FDR method and several summary statistics.
6.
Errors
Any errors generated during your MethLAB analysis will be displayed in the Log window.
We hope you find MethLAB useful and easy to use! Please contact [email protected] with
any questions or comments.
References:
1) Benjamini and Hochberg (1995) Controlling the false discovery rate: a practical and powerful
approach to multiple testing. J R Statist Soc B 57:289-300
2) Benjamini and Yekutieli (2001) The control of the false discovery rate in multiple testing
under dependency. Annals of Statistics, 29:1165-1188
3) Storey (2002) A direct approach to false discovery rates. J R Statist Soc B 64:479-498
4) Holm S (1979) A simple sequentially rejective multiple test procedure. Scand J Stat 6:65–70
13