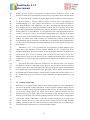
1
PeakCounter 2.1.5
User manual
1
2
3
4
5
6
7
8
9
10
11
12
PeakCounter 2.1.5: a user-friendly Windows programme for high resolution
analysis of multi-parameter data from the Itrax™ core scanner
13
Abstract
14
15
16
17
18
19
20
21
22
23
24
25
26
27
This paper describes new software PeakCounter 2.1.5 that was specifically developed for using
multi-parameter data from the Itrax™ core scanner for varve counting, but it is also an extremely
useful tool for all fine-scale analysis of such data. The X-radiograph and the optical images can be
viewed adjacently. An active window selector plots up to six different parameters (e.g. greyscale
from X-radiograph, chemical elements and/or ratio between them, as well as any other parameter
measured by the scanner). The active area of the optical image can also be viewed in a separate
window (magnified). A cursor line moves simultaneously in all active windows, allowing the user
to check correlation between different curves. Recognised varve/laminae limits can be marked
with the numbers denoting the varve clarity to the human counter, allowing a measure of varve
quality to be incorporated into the count. Weighted averaging can be used to overcome noisy
element profiles that can result when scanning at very high resolution. Distinct sedimentary
structures that are often used to correlate cores (e.g. turbidites, tephras) can be marked and
described. These new data appear as four additional columns in the output file: greyscale from Xradiograph, varve limit, marker layer number and notes.
Michael H. MARSHALL1, Takeshi NAKAGAWA2*, Suigetsu 2006 Project Members3
1
Institute of Geography and Earth Sciences, Aberystwyth University, Aberystwyth, SY23 3DB, Wales, UK
2
Department of Geography, University of Newcastle, Newcastle upon Tyne, NE1 7RU, UK
3
http://www.suigetsu.org/
* Corresponding author (E-mail: [email protected])
28
29
1.0 Introduction
30
31
32
33
34
35
36
37
38
39
40
41
X-ray fluorescence (XRF) core scanning of split sediment cores was developed in the late 1990s
(Jansen et al., 1998) and is a powerful analytical technique. It is relatively rapid, requires no
sample preparation, is non-destructive, and can detect most chemical elements of the periodic
table down to limits of a few parts per million, depending on acquisition dwell time and sample
conditions. A new generation of XRF core scanners allowing extremely high resolution analysis,
with improved count rates and detection limits (even with reduced count time), has become widely
available. The Itrax™ core scanner takes high resolution radiographic and optical images at the
same time as XRF measurements. Rather than using a single spot X-ray beam, which most
alternative scanners use, the Itrax™ scanner is equipped with a unique flat X-ray beam that means
that grain-to-grain variance is averaged in the horizontal core axis, ensuring predominance of the
environmental signal through depth. This is a particular advantage when measuring laminated
sediments at very high resolution. The X-radiographic images are also extremely useful in
-1-
PeakCounter 2.1.5
User manual
42
43
allowing greyscale profiles to be produced of sediment density variations as well as in the
detection of hidden clasts and sedimentary structures that are not visible from the sediment surface.
44
45
46
47
48
49
50
51
52
53
54
55
56
An increasing number of studies are utilising digital analysis of optical and X-ray images as
an objective method of analysing sediment features, including varves, both manually and
automated (Ripepe et al., 1991; Cooper, 1997; Petterson et al., 1999; Saarinen and Petterson,
2001; Ojala and Francus, 2002; Haltia-Hovi et al., 2007). Automated peak counting software has
been developed for use in charactering laminated sediments and varve counting; using profiles
derived from images but also geochemical data, and allow the option of spectral analysis on such
datasets (Weber et al., 2010). However, for such approaches to be viable the laminations must be
extremely well preserved, clearly and consistently distinguishable and continuous for the entire
period of interest. In most laminated and varved sediment sequences this is not the case. These
methods also detract from actually studying and characterising sediment composition and
understanding the process of deposition, for which there is no substitution. These rapid approaches
can only ever be used alongside conventional approaches of thin section microscopy and microfacies analysis.
57
58
59
60
61
62
63
PeakCounter 2.1.5 is a new programme that was developed by Takeshi Nakagawa using
Visual Basic 6 and thoroughly tested by Michael Marshall for varve counting using multiparameter data from the Itrax™ core scanner for the Lake Suigetsu 2006 Varved Sediment Core
(SG06) Project, but it is also an extremely useful tool for all fine-scale analysis of such data.
Further reference to the use of the software for varve counting for the SG06 project can be found
in Marshall et al. (in prep), while a brief description of the software can be found in Francus et al.
(2009).
64
65
66
67
68
69
70
The software did not have instruction document for users mainly because it was originally
developed for internal use of the SG06 project. However, the performance and the user-friendly
interface of the software attracted attention from outside of the project and therefore the demand
for a comprehensive user manual became high. This paper is the first official document released
by the SG06 project aimed at helping a general audience to benefit fully from the software. As of
26th October 2010, there has not been any other PeakCounter user manual authorised by the
project.
71
72
2.0 Scanning configuration
73
74
75
76
77
78
79
80
81
82
PeakCounter 2.1.5 requires that the number of pixels along the depth axis of the X-radiograph is
the same as the number of XRF measurements. In other words the resolution (stepping interval)
needs to be identical for both X-ray radiography and XRF scanning. This is the only requirement
for the scanner settings. Optical core images can be taken in different resolution and using
different devices such as digital cameras. Users can include as many elements as they want for
detection by model fitting. The scanning resolution (defined by the user) must be constant within
each scanned segment. PeakCounter 2.1.5 displays one XRF measurement in one pixel on the
monitor. Therefore the use of a coarse step size results in images that are too small. Generally
speaking, PeakCounter may not be the best analytical tool for materials that do not require highresolution scanning. The SG06 core was scanned at 60 µm stepping.
83
-2-
PeakCounter 2.1.5
User manual
84
3.0 Installation of PeakCounter 2.1.5
85
86
87
88
89
90
91
92
93
PeakCounter 2.1.5 runs on Windows XP Service Pack 3 (SP3) or later. NB: it has been reported
by several users that it does NOT run on Windows XP (SP2) or earlier. Currently there is no plan
to develop PeakCounter for Macintosh or Linux. An installer package of PeakCounter 2.1.5 can be
downloaded from the web page <http://dendro.naruto-u.ac.jp/~nakagawa/>. The download has no
limitation and is free of charge. Extract the downloaded zip file and double-click SetUp.exe file.
Next, simply follow the ordinary procedures of installing Windows software. If successfully
installed you will find a shortcut to the PeakCounter software in your Start menu (Start> Program
Files > PeakCounter > PeakCounter 2.1.5). You do not need to restart your computer to activate
the software.
94
95
96
97
If you have already installed an older version of PeakCounter and are trying to update it, it is
usually possible to simply download the “compressed” version and replace the old .exe file (which
is normally in C/Program Files/PeakCounter/) unless otherwise stated on the web site. The
PeakCounter.exe file needs to be in the same directory as the “References” folder.
98
99
100
101
102
Notice for French Windows users!! A malfunction of PeakCounter 2.0.0 was reported by a French
Windows user. The more recent version 2.1.5 seems to be free from this problem. If the problem
persists, an easy solution is to use PeakCounter version 1.6.2 (also available at
http://dendro.naruto-u.ac.jp/~nakagawa/) which has less capacity to customise the user interface
but does essentially the same thing as the latest version.
103
104
4.0 Formatting data and image files
105
106
107
108
109
110
111
112
113
114
115
116
117
PeakCounter 2.1.5 requires the data file containing the XRF data to be in csv format and the Xradiograph and optical images to both be in bitmap (.bmp) or Jpeg (.jpg) format. The XRF data
file (“result.txt”) can be imported/opened in Excel and saved in a csv file using the core section
name. The optical image (“optical.tif”) can simply be saved as a bmp/jpg file using standard
graphics software (e.g. Adobe Photoshop, GIMP etc), as can the X-radiograph image
(“radiograph.tif”), although this must first be converted to an 8 Bits/Channel image (from 16
Bits/Channel) before it can be saved as a bmp/jpg file. Standard image enhancements (e.g.
brightness, contrast) may need to be made prior to the conversion, in order to avoid loss of signal
resolution (16 bit grey scale divides the range from white to black into >65,000 levels, whereas 8
bit signal can resolve only 255 levels). However, remember that all core sections from the same
master sequence should be edited using identical settings to allow consistent master profiles to be
constructed from the X-radiograph images. Any available optical image of the core section may be
used, whether that recorded by the Itrax scanner or taken in the field.
118
119
5.0 Importing files and user interface manipulation
120
5.1 X-radiographic image
121
122
123
124
Navigate to the location of PeakCounter 2.1.5 and open the programme (Fig. 1). Click on the
“Import radiograph” button (A in Fig. 1) in the PeakCounter 2.1.5 control panel (or go to “File”
(B in Fig. 1), “Import radiograph”), navigate to your radiograph bmp/jpg file (or choose the
“Radiograph.bmp/jpg” file from the sample data folder), select it and click “Open” (or double-
-3-
PeakCounter 2.1.5
User manual
125
126
127
128
129
130
131
132
133
134
135
136
137
138
139
140
141
142
click the file). This opens the full radiograph image in the X-radiograph “Preview” window at the
top of the screen with the core top to the right, including the file location path (Fig. 2). The red
rectangle is the “active window selector” (Fig. 1) and denotes the smaller core section of Xradiograph image that is plotted in the first of the active windows that is also opened (Fig. 2, “1:
Grey scale”). See below for details on the “Active years” window that is also opened. The position
of the active window can be changed by clicking inside the active window selector and dragging
to the required position down/up core, and can be resized by clicking and dragging either side of
the selector. The green line is the greyscale profile (Fig. 2) calculated from the area between the
two dashed white lines on the X-radiograph image, the position and width of which can be
changed by clicking and dragging within, or on the lines (in either the active window, where the
width in pixels is also shown, or in the full X-radiograph preview window, see Fig. 2). The Y-axis
scale can be edited by changing the limits of greyscale value at the top and bottom right hand
corners. [NB: The position of the greyscale selector determines the values that are saved in the
additional column; labelled “greyscale” created in the output file – one column to the right of
“coh”, see Fig. 9]. [NB: The brightness and contrast of the X-radiograph can be changed by using
the corresponding scroll bars in the PeakCounter 2.1.5 control panel, which will NOT change the
values saved in the additional column; i.e. the function is only to enhance visibility on the monitor
without altering signal quality].
143
144
5.2 XRF data
145
146
147
148
149
150
151
152
153
154
155
156
157
158
159
Click on the “Import XRF data” button in the PeakCounter 2.1.5 control panel (Fig. 2) (or go to
“File”, “Import XRF data”), navigate to your XRF data csv file (or choose the “XRF data.csv” file
from the sample data folder), select it and click “open” (or double-click the file). This opens five
other active windows, which contain element profiles plotted in green on a background of the Xradiograph image. This also opens two scale bars; one showing the full core section length above
the X-radiograph preview window (A in Fig. 3) defined by the core scan length, and the other
showing the length of the active windows (B in Fig 3) defined by the active window selector. The
scale bars automatically reflect the analytical resolution (stepping interval) recorded in the XRF
data file. The position of the windows can be changed by clicking and dragging them. They can be
arranged and aligned by right-clicking on the upper-most window and clicking “Align forms” (Fig.
4), or going to “Tool”, “Align forms” in the control panel menu. A single active window can be
viewed by right-clicking the window of interest and clicking on “Hide others” (Fig. 4). Users can
also right-click and click “Show 1-3” to just show the first three active windows, or alternatively
“Show 4-6” (Fig. 4). To display all six windows right-click and select “Show all” (Fig. 4) or go to
“Tool”, “Show all” in the control panel menu.
160
161
5.3 Core photograph
162
163
164
165
166
167
Click on the “Import core photo” button in the PeakCounter 2.1.5 control panel (Fig. 3) (or go to
“File”, “Import core photo”), navigate to your core photo bmp/jpg file (or choose the “Core
photo.bmp/jpg” file from the sample data folder), select it and click “Open” (or double-click the
file). Once open, the window displaying the optical image can be aligned to the X-radiograph
image (Fig. 5). The window can be resized both horizontally (i.e. along the long axis of the core)
and vertically by clicking and dragging at its edge. If you resize it horizontally, then the optical
-4-
PeakCounter 2.1.5
User manual
168
169
170
171
172
173
174
175
176
177
178
image stretches or shrinks to the width of the window. This function is particularly useful when
you are trying to align the core image, independently taken by a digital camera, to the Xradiograph. Vertical resizing only trims the core image, which is useful to save space on the
monitor. The position of the image within the window can be moved vertically (i.e. the short axis
of the core) by clicking and dragging the image. If the overlap between images encompasses the
active window selector on the X-radiograph (red rectangle), an active window selector will also
appear on the optical image (Fig. 5). This will move horizontally when the user changes the
position of the active window selector on the X-radiograph image. It can be moved vertically by
clicking and dragging within it in the core photo window. If the user changes the position or size
of the core photo then it is necessary to click on the active window selector in the core photo to realign it to that within the X-radiograph image preview window.
179
180
5.3.1 Magnifying the core photo
181
182
183
184
185
186
187
188
189
190
191
192
193
194
195
196
197
198
199
200
201
202
203
204
Right-click on the core photo and select “Crop” to open a magnified image of the core section
defined by the active window selector in a separate window (Fig. 5). This can be moved and
resized both vertically and horizontally. The brightness and contrast can be changed by using the
corresponding scroll bars in the PeakCounter 2.1.5 control panel. Once in the required position (i.e.
aligned with the active windows), right-click and select “Align scale” (Fig. 6), to align the active
window scale below the cropped core photo, and to align the active cursor line (orange line with
cross-hair) between this and the other active windows. The method for aligning the active cursor is
defined by either the absolute position of the core photo compared to the X-radiograph image, or
by the relative scale between the two; right-click on the cropped optical image and select “Pointer
link”, then either “Position” or “Scale” (Fig. 6). The “Scale” mode is more useful when the optical
core image was taken by the Itrax™, when it usually has the exact same scale as the X-radiograph.
The “Position” mode can better solve the problem of imperfect alignment between core images
taken independently by a digital camera and the X-radiograph. In “Position” mode, the orange
cursor lines (with cross-hair) in the cropped image and the active windows can be finely aligned
by changing the width of the cropped core image window and the position of the scale to which
the cursor line is linked. Clicking on between the dashed white lines initially plots three green
profile lines corresponding to L*, a*, and b* colour components which are derived from the area
between the white lines, the colour profile selector (Fig. 6). As with the X-radiograph active
window, this area can be moved and resized by clicking and dragging between or on the dashed
white lines. Right-click on the cropped optical image and select “Colour profile”, then either
“RGB”, to change the plotted profiles to red, green, blue additive colour components, or “grey
scale”, to plot the greyscale of the image, equivalent to the surface reflectance (Fig. 6). To rescale/stretch the Y-axis, click and drag vertically on the image anywhere outside the dashed white
lines.
205
206
5.4 Screen resolution
207
208
209
210
One pixel in each active window precisely corresponds to one measurement by the Itrax™ core
scanner. Users are advised to reduce their screen resolution to improve the visibility of extremely
fine-scale changes in parameter profiles. A trial and error approach is advocated so that the user
can view the programme at a reduced resolution while maximising use of screen space. In Vista
-5-
PeakCounter 2.1.5
User manual
211
212
this can be done by right-clicking on the desktop, selecting “Personalize”, then clicking “Display
settings”.
213
214
6.0 Using PeakCounter 2.1.5
215
6.1 Further active window manipulation
216
217
All the components displaying the multi-parameters derived from the Itrax™ core scanner should
now be arranged so they are all visible and fill the screen (Figs. 6 and 7).
218
219
220
221
222
223
224
225
226
227
228
229
230
231
The drop-down menu at the top left corner of each of the six active windows can be used to
select from the list which of the parameters is plotted in the window. As well as all of the elements
of interest selected by the Itrax™ user to measure, this list includes greyscale, kilo-counts per
second (kcps), and mean square error of prediction (MSE). In active windows 4-6 it is also
possible to plot element and/or parameter ratios by ticking the “ratio” box and selecting the
desired element/parameter(s) from the two drop-down menus. The parameter profiles may be
stretched by changing the upper and lower Y-axis values at the right of each active window. The
Y-axis may also be reversed by right-clicking on the active window and selecting “Flip vertical”
(Fig. 4). Weighted moving averages (equally- or centrally-based, 3- or 5-point) may be plotted by
right-clicking on the desired active window and selecting “Moving average” (Fig. 4) and then one
of the possibly weightings (“0:33:33:33:0”, “0:25:50:25:0”, “20:20:20:20:20”, or
“10:20:40:20:10”). To bring both the active window scale bar and the X-radiograph scale bar to
the front of all the windows at any time go to “Tool”, “Show scale” in the PeakCounter 2.1.5
control panel menu.
232
233
6.2 Varve counting
234
235
236
237
238
239
240
241
242
243
244
245
246
247
248
249
250
251
The active cursor line (orange line with cross-hair) moves simultaneously in all active windows
allowing the user to examine correlation between elements, parameters and their ratios at
extremely high resolution. This allows varve (or other laminae/sediment structure) limits to be
marked in the active windows (and the output file). To activate one of the six active windows the
user must either left- or right-click on the desired window. The active windows can be
deactivated/activated by either right-clicking on any of them and unticking/ticking the “Activate”
command (Fig. 4), or by using “Ctrl-A”. The user is able to mark different levels of varve signal
clarity resulting due to differing degrees of correlation between indicator parameters and signal
strength, but also denoting the counter’s judgement that it represents a true varve. Left-click at the
desired position in any of the active windows (not including the magnified core photo) to mark a
“Level 1” line (red) in all active windows and to register this in the “Active years” counter
window (Fig. 7), which counts all marked years within the current active windows. Right-click at
the desired position in any of the active windows to select any level of certainty from 1 to 5 (and
to 9 by selecting “(more)”), which will be shown as different colour lines and registered in the
corresponding “Active years” counter window (Fig. 7, click “more” in the counter window to see
levels 6-9). It is also possible to move the mouse to the desired position and to use the number
keys (1-9) on the computer keyboard. The user can change the corresponding line and count
colour by going to “Setting” in the control panel menu, “Colour setting”, selecting the level colour
-6-
PeakCounter 2.1.5
User manual
252
253
they wish to change, clicking on the desired colour and clicking “OK”. Default settings can be set
by going to “Setting”, “Colour setting”, and selecting “Default”.
254
255
256
257
258
259
260
The user can “Undo” their last marked level lines by right-clicking on any of the active
windows and selecting the appropriate command (Fig. 4), or by using “Ctrl-Z”. The undo function
can be repeated for up to 50 times. Marked lines may be deleted by hovering the active cursor line
over the particular marked line, right-clicking and selecting “Delete” [NB. this cannot be undone].
An additional column is created in the output file labelled “year” where the marked level number
is recorded in the spreadsheet row corresponding to the exact “Position (mm)” from the top of the
Itrax™ core scan (Fig. 9) (one row in the spreadsheet corresponds to one pixel in active window).
261
262
263
264
265
266
267
268
269
270
271
If the varve clarity and/or signal are poor in places, then more clearly varved sections can be
used to estimate the spacing/position of varves in the poorly varved section (i.e. sedimentation
rate). Either click the “Show tools” button in the PeakCounter 2.1.5 control panel (Fig. 8, which
will also bring the “Active year” window to the front), or go to “Tool”, “Show elastic scale”,
which will open/show the “Elastic scale” bar aligned with the active windows. Click and drag
horizontally inside the bar to reveal markers and circles in the bar and active windows,
respectively. The user can drag them to the desired spacing (noted in the elastic scale bar in mm,
Fig. 8) as indicated by the position of the marked varves in the clearly varved section. The bar can
be placed anywhere and the circles will move accordingly. NB: this tool should only ever be used
as an approximate guide, and any varve limits marked using the tool should be marked at an
accordingly low degree of certainty (i.e. a high level number).
272
273
6.3 Labelling laminae and making notes on sediment character
274
275
276
277
278
279
280
281
282
283
284
285
286
287
288
289
290
To precisely mark a particular sedimentary structure, right-click in an active window at the desired
position and select “Labelled lamina” (Fig. 4). This opens a separate window were the user can
label the lamina in the first box and describe it in the second (Fig. 4). Click “OK” to close the
window. A blue line will appear in the marked position in all active windows. The lamina label
and note (in brackets) text will appear when the user hovers the active cursor line over the blue
line in any of the active windows. The labelled lamina may be deleted by hovering the active
cursor line over the particular marked line, right-clicking and selecting “Delete” [NB. this cannot
be undone]. A blue line also appears in the X-radiograph window of the full core section which
makes it easier for the user to align and re-scale (if required, i.e. when not using the core photo
from the Itrax™ scan) the core photo to the X-radiograph image using the position of the distinct
sedimentary structures (e.g. turbidites, tephra) as marker layers (Fig. 7). Two additional columns
are created in the output file labelled “lamina” and “note” where these are recorded (Fig. 9). This
therefore makes it easy for the user to find the marker layers in the output file which are
particularly useful when used to correlate overlapping core sections, either when taken as parallel
“Double-L” channel (a.k.a. “LL-channel” or “Nakagawa channel”) sub-samples (see: Nakagawa
(2007); Nakagawa et al. (in press)) advocated here when core scanning at extremely high
resolution for varve counting) from the same master core section, or from overlapping bore holes.
291
292
293
294
In the same way, the user can precisely mark notes at any required position by right-clicking
in any of the active windows and selecting “Note” (Fig. 4). This opens a new window where the
note can be made, either manually, or by selecting a note from the drop-down library list, and then
clicking “OK” (Fig. 4). A short white line will appear in the active windows. This note will be
-7-
PeakCounter 2.1.5
User manual
295
296
297
298
299
shown as text when the user hovers the active cursor line over the white line in any of the active
windows. Unlike “Labelled lamina”, the line does not appear in the X-radiograph preview window.
The note may be deleted by hovering the active cursor line over the particular marked white line,
right-clicking and selecting “Delete” [NB. this cannot be undone]. The note will be recorded in the
“note” column in the output file (Fig. 9).
300
301
7.0 Saving
302
303
304
305
306
When saving the output file for the first time, click the “Save as” button in the PeakCounter 2.1.5
control panel. This opens a window where the user can navigate to the desired folder location for
saving. Alternatively, use “File”, “Save as”, select the output file (or change its name) and click
“Save”. For saving after the first time, either click on the “Save” button in the PeakCounter 2.1.5
control panel, or go to “File” in the control panel, “Save”.
307
308
309
By clicking “File”, “Save summary” a separate csv file is created in which the sum of each
level number (1-9) between each labelled lamina is recorded. This is extremely useful when
comparing varve counts between marker layers in parallel core sections.
310
311
8.0 Closing PeakCounter 2.1.5
312
Either click on the “Quit” button on the control panel, or go to “File”, “Quit”.
313
314
9.0 Questions and bug reports
315
316
Queries and bug reports should be sent directly to the author of the software (E-mail:
[email protected]).
317
318
References
319
320
Cooper, M.C., 1997. The use of digital image analysis in the study of laminated sediments.
Journal of Paleolimnology 19: 33–40.
321
322
323
Francus P, Lamb H, Nakagawa T, Marshall M.H, Brown E, Suigetsu 2006 Project
Members. 2009. The potential of high-resolution X-ray fluorescence core scanning:
Applications in paleolimnology. PAGES News, 17: 93-95.
324
325
Holtia-Hovi E, Saarinen T, Kukkonen M. 2007. A 2000-year record of solar forcing on varved
lake sediment in eastern Finland. Quaternary Science Reviews 26: 678-689.
326
327
328
329
Marshall M.H., Schlolaut G, Nakagawa T, Brauer A, Lamb H, Bronk Ramsey C, Yokoyama Y,
Suigetsu 2006 Project Members. In prep. A novel approach to varve counting for the Lake
Suigetsu 2006 Varved Sediment Core Project: Combining µ-XRF and X-radiography with
thin section microscopy. Quaternary Geochronology.
330
331
332
Nakagawa, T. (2007) Double-L channel: an amazingly non-destructive method of continuous subsampling from sediment cores. Quaternary International, 167-168 Supplement, 298,
doi:j.quaint.2007.04.001.
-8-
PeakCounter 2.1.5
User manual
333
334
335
336
337
Nakagawa, T., Gotanda, K., Haraguchi, T., Danhara, T., Yonenobu, H., Yokoyama, Y., Brauer, A.,
Tada, R., Takemura, K. Staff, R.A., Payne, R., Bronk Ramsey, C., Suigetsu 2006 Project
members (in press) SG06, a perfectly continuous varved sediment core from Lake Suigetsu,
Japan: stratigraphy and potential for improving radiocarbon calibration model and
understanding of climate changes. Quaternary Science Reviews.
338
339
Ojala, A.E.K., Francus, P., 2002. X-ray densitometry vs. BSE-image analysis of thin-sections: a
comparative study of varved sediments of Lake Nautaja¨ rvi, Finland. Boreas 31: 57–64.
340
341
Petterson, G., Odgaard, B.V., Renberg, I., 1999. Image analysis as a method to quantify sediment
components. Journal of Paleolimnology 22: 443–455.
342
343
Ripepe, M., Roberts, L.T., Fischer, A.G., 1991. Enso and sunspot cycles in varved Eocene oil
shales from image analysis. Journal of Sedimentary Petrology 61: 1155–1163.
344
345
346
Saarinen, T., Petterson, G., 2001. Image analysis techniques. In: Last, W.M., Smol, J.P. (Eds.),
Tracking Environmental Change Using Lake Sediments, vol. 2: Physical and Geochemical
methods. Kluwer Academic Publishers, Dordrecht, pp. 23–40.
347
348
349
350
Weber, M.E., Reichelt, L., Kuhn, G., Pfeiffer, M., Korff, B., Thurow, J.W., Ricken, W. 2010.
BMPix and PEAK tools: New methods for automated laminae recognition and counting Application to glacial varves from Antarctic marine sediment. Geochemistry, Geophysics,
Geosystems 11: Q0AA05, doi:10.1029/2009GC002611
-9-
PeakCounter 2.1.5
User manual
Fig 1. Initial window of PeakCounter 2.1.5
-10-
PeakCounter 2.1.5
User manual
Fig 2. PeakCounter 2.1.5 window after X-radiograph image import
-11-
PeakCounter 2.1.5
User manual
Fig. 3. PeakCounter 2.1.5 window after XRF data import
-12-
PeakCounter 2.1.5
User manual
Fig. 4. Right-click window (with extensions)
-13-
PeakCounter 2.1.5
User manual
Fig. 5. PeakCounter 2.1.5 window after core photo import
-14-
PeakCounter 2.1.5
User manual
Fig. 6. PeakCounter 2.1.5 window after opening magnified crop of core photo
-15-
PeakCounter 2.1.5
User manual
Fig. 7. PeakCounter 2.1.5. The profile in active window 4 (Ti) has been smoothed using the
weighted average tool. The profile in active window 5 shows the use of the ratio tool, and has
also been smoothed using the weighted average tool. Varve have also been marked using
different levels of certainty.
-16-
PeakCounter 2.1.5
User manual
Fig. 8. PeakCounter 2.1.5., with the elastic scale tool shown (just above active window 1).
-17-
PeakCounter 2.1.5
User manual
Fig. 9. Output file showing additional columns created by PeakCounter 2.1.5.
-18-