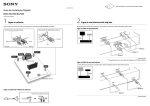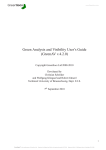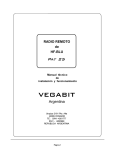
1
TranSignalTM
TF Protein Array
Cat. # MA3501 - MA3508
Product User Manual
Released 03/22/05
Revised 08/11/05
Transcending boundaries ...
Panomics, Inc. • 2003 East Bayshore Road • Redwood City, CA 94063 • USA
Tel.: 650.216.9736 or 877.726.6642 (PANOMIC) • Fax: 650.216.9790 • www.panomics.com
2
TranSignalTM TF Protein Array
TranSignalTM TF Protein Array
1. INTRODUCTION
Contents
1. INTRODUCTION .............................................................................................................. 3
2.CHOOSING AN ANTIBODY DETECTION METHOD ........................................................... 6
3. MATERIALS PROVIDED ................................................................................................... 6
4. ADDITIONAL MATERIALS REQUIRED ............................................................................. 7
5. INCUBATION OF PROTEIN WITH THE ARRAY MEMBRANE ........................................... 8
6. DETECTION..................................................................................................................... 9
7. INCUBATION OF DNA WITH THE ARRAY MEMBRANE...................................................10
8. TROUBLESHOOTING .................................................................................................... 11
9. REFERENCES ................................................................................................................ 12
APPENDIX A: Schematic Diagram of the TranSignal TF Protein Array VERSION I............ 13
APPENDIX B: Schematic Diagram of the TranSignal TF Protein Array VERSION II........... 14
APPENDIX C: Schematic Diagram of the TranSignal TF Protein Array VERSION III.......... 15
APPENDIX D: Schematic Diagram of the TranSignal TF Protein Array VERSION IV.......... 16
APPENDIX E: Typical Results of the TranSignal TF Protein Array when screening protein protein interactions .................................................................................................. 17
APPENDIX E: Typical Results of the TranSignal TF Protein Array when screening DNA protein interactions .................................................................................................. 19
Trademarks, Patents, and Limited Warranty
PanomicsTM and TranSignalTM are trademarks of Panomics, Inc.
FluorChemTM is a registered trademark of Alpha Innotech Corporations.
HyperfilmTM is a trademark of Amersham Pharmacia Corporation.
Certain aspects of the TranSignalTM array technology are in the process of patent filing.
This product is intended for research purposes only. Panomics products may not be
resold, modified for resale, or used to manufacture commercial products without written
approval by Panomics, Inc.
Panomics, Inc. warrants that the performance of this kit meets Panomics’ performance
specifications from the time of shipment until the expiration date, if stored under the
recommended conditions. Panomics disclaims all other warranties, either express or
implied, including without limitation and implied merchantability or fitness for a particular
purpose.
Under no circumstances shall Panomics be liable for any damages arising out of the use
of the materials.
2001–2005 C Panomics, Inc. All rights reserved.
The human genome comprises an estimated 30,000 genes, 2,000 of which
encode proteins involved in the control of gene expression. These proteins,
known as transcription factors (TFs), are responsible for the who, what,
when, where, and how of gene expression: which genes are expressed in
what cell types, under what environmental conditions, and at what stages
of development. The activity of TFs is highly regulated by various
mechanisms, including protein induction, modification, translocation,
degradation, and inhibition (1).
Before activated TFs can impose regulation on the basal transcriptional
machinery, they either bind to their corresponding specific cis-elements,
or interact with other TF proteins. This interaction usually requires
cofactors to bridge the TF proteins and the components of the basal
transcriptional machinery. The interactions between TFs, cofactors, and
basal transcriptional machinery create a complex, multidimensional
network (2).
Identifying and characterizing the interaction network in the context of
different cellular environments will allow us to understand the network
structure, as well as the cellular signal-induced changes in this structure.
Tools for studying protein-protein interactions—especially interactions
involving TF proteins—are essential for understanding gene expression
and regulation.
Novel method for investigating protein-protein interactions
Traditionally, protein-protein interactions have been studied by pull-down
assay, coimunoprecipitation, super-gel shift, and the yeast two-hybrid
system. But because these methods are notoriously time-consuming and
inefficient, they are not conducive to mapping the intricate network of
protein-protein interaction. That’s where the TranSignalTM TF Protein
Array comes in. This method enables you to determine how a particular
protein interacts with multiple other proteins—in a single detection
experiment.
Figure 1 illustrates how this simple procedure works. The array membrane
is spotted with transcription factor proteins, which are expressed from
full length TF cDNAs, with an N-terminal His Tag. A protein of interest is
(MA3020UM061603)
For Technical Support, call 1.877.726.6642 (PANOMIC) or visit our Web site at www.panomics.com.
For Technical Support, call 1.877.726.6642 (PANOMIC) or visit our Web site at www.panomics.com.
3
4
TranSignalTM TF Protein Array
TranSignalTM TF Protein Array
used as bait to search for interactions with the immobilized proteins.
Interactions can be assessed either by using an antibody to the protein of
interest, or with antibody to protein tags such as HA, GST or biotin. The
signal is visualized via chemiluminescent detection.
Insert gene of interest
into expression vector
gene
+
vector
=
Novel method to characterize gene promoter regions
The TranSignalTM TF Protein Array provides a method by which you can
very quickly survey direct interactions between TF proteins and their
complimentory cis-binding element. This means that by simply producing
a biotinylated version of your promoter region of interest you can asses
which transcription factors arrayed on the membrane have the potential
to bind to this region. Once these have been identified it starts to give clues
about which transcription factors, and their associated signaling
pathways, might be regulating the expression of your gene of interest.
express your protein
of interest
prepare bacterial
extract
OR
purify protein
use extract directly
incubate with
TranSignal™
TF-Protein Array
chemiluminescent
detection
Signal strength corresponds to
strength of protein-protein
interaction
Figure 2: Flow chart of the TranSignalTM TF Protein Array DNA
Promoter interaction
Figure 1: Flow chart of the TranSignalTM TF Protein Array protein
interaction
For Technical Support, call 1.877.726.6642 (PANOMIC) or visit our Web site at www.panomics.com.
For Technical Support, call 1.877.726.6642 (PANOMIC) or visit our Web site at www.panomics.com.
5
6
TranSignalTM TF Protein Array
2. CHOOSING AN ANTIBODY DETECTION
METHOD
IMPORTANT: Read this section before beginning your experiment!
To detect interactions between your protein of interest and the TF proteins
immobilized on the membrane, you will need to use either an antibody
against your protein of interest or a tag antibody, such as HA, biotin or
GST. As a negative control, incubate the TranSignal TF Protein Array
membrane with antibody only (see Appendix B).
TranSignalTM TF Protein Array
• Detection Buffer A (600 µl)
• Detection Buffer B (600 µl)
For Catalogue items MA3505, MA3506, MA3507 and MA3508 DNA Protein interactions.
STORAGE CONDITONS: Upon receipt, remove the 5X Blocking Buffer
and store at -20οC. Store array membranes, and all other reagents at 4οC.
• TranSignal TF Protein Array (2 each)
• 4 well plate (1 each)
• 5X Binding Buffer (5 ml)
• 20X Wash Buffer (20 ml)−dilute to 1X with dH20
• Streptavidin - HRP (20 µl)
• Detection Buffer A (600 µl)
• Detection Buffer B (600 µl)
2.1 Using an antibody against your protein of interest
If you already have access to your purified protein of interest or bacterial
lysate containing the protein of interest, you can get started right away.
Simply incubate the array membrane with your purified protein, then
detect using the antibody.
2.2 Using a protein tag/antibody combination
If you don’t have an antibody against your protein of interest, you will
need to use protein with a specific tag, such as HA or GST or biotinylate
your protein. Do not use His tagged proteins for hybridization with the
membranes as the proteins on the array are His tagged. You can then
detect hybridized proteins using an antibody against the tag.
2.3
Sufficient quantities of each buffer are provided for two assays.
4. ADDITIONAL MATERIALS REQUIRED
4.1
• Appropriate primary detection antibody
• Anti-rabbit, mouse or goat - HRP conjugate
Using a protein tag/antibody combination
We provide a suitable streptavidin - HRP conjugate for use with this kit
3. MATERIALS PROVIDED
For Catalogue items MA3501, MA3502, MA3503 and MA3504 Protein Protein interactions.
STORAGE CONDITONS: Upon receipt, store array membranes, and all
reagents at 4οC. Keep at 4οC until use.
Reagents and Solutions
4.2
Materials and Equipment
• Microcentrifuge
• Orbital shaker
• Plastic Sheets (e.g., overhead transparencies)
• HyperfilmTM ECL (Amersham, Cat.# RPN1674K) or equivalent
OR
• Chemiluminescence imaging system (e.g., FluorChemTM from
Alpha Innotech Corp.)
• TranSignal TF Protein Array (2 each)
• 1X Blocking Buffer I (30 ml)
• 1X Blocking Buffer II (30 ml)
• 20X Wash Buffer (20 ml)−dilute to 1X with dH20
For Technical Support, call 1.877.726.6642 (PANOMIC) or visit our Web site at www.panomics.com.
For Technical Support, call 1.877.726.6642 (PANOMIC) or visit our Web site at www.panomics.com.
7
8
TranSignalTM TF Protein Array
5. INCUBATION OF PROTEIN WITH THE ARRAY
MEMBRANE
Use this protocol with catalogue items MA3501, MA3502, MA3503 and
MA3504.
TranSignalTM TF Protein Array
6. DETECTION
Important: Do not let the membrane dry out during detection.
6 .1 Prepare 500µl of detection solution by combining 250µl Detection
Buffer A and 250 µl of Detection Buffer B per membrane.
6.2
Using forceps to hold the notched corner, carefully remove each
membrane from its tray. Drain the excess Wash Buffer from the
membrane by touching the edge against tissue. Place membrane
protein-side-up on a clean plastic sheet protector or overhead
transparency, by orienting the notch to the top, right-hand
corner.
6.3
Pipet the mixed Detection Buffers onto the membrane. Overlay
the membrane with a second plastic sheet and ensure that the
buffer mixture is evenly distributed over the membrane without
air bubbles.
5.3 Dilute the bacterial extract, containing overexpressed protein to a
final concentration of 60 µg/ml in 4 ml of 1X Blocking Buffer I. If you
have purified protein, dilute 3 -5 µg purified protein in 4 ml of 1X
Blocking Buffer I.
6.4
Incubate for 5 min at room temperature.
6.5
Remove excess substrate by gently applying pressure to the top
sheet. Using a paper towel, remove excess detection solution
remaining on the surface of the sheets.
5.5 Incubate the membrane with the diluted bacterial extract or purified
protein at room temperature for 2 hr with gentle shaking.
6.6
Expose the membranes using either Hyperfilm TM ECL or a
chemiluminescence imaging system, such as the FluorChemTM
imager from Alpha Innotech Corp. In either case, we recommend
that you try several different exposures of varying lengths of time
(e.g., 30 sec–5 min).
This section describes incubating bacterial extract containing your protein
of interest or purified protein with the array membrane. Note that the
array membranes are notched at the top right-hand corner for orientation
purposes.
Note: Be sure that the membrane is fully submerged in assay buffer at all times. Never
let the membrane dry out.
5.1 Place each membrane into a container containing 4 ml of 1X Blocking
Buffer I.
5.2 Place the tray on a shaker and incubate for 2 hr at room temperature.
5.6 Wash the membrane twice with 4 ml of 1X Wash Buffer for 5 min
(each wash) at room temperature.
5.7 Incubate the membrane with 4 ml of 1X Blocking Buffer II containing
primary antibody:
Note: Use an amount of the antibody suitable for western blot
detection of the protein or protein tag, specified by the manufacturer.
5.8 Incubate the membrane with the primary antibody solution for 2
hours at room temperature,
5.9
Wash the membrane twice with 4ml 1X Wash Buffer for 5-min (each
wash).
5.10 Incubate the membrane with the appropriate secondary antibody
diluted 1:5,000–1:15,000 in 4ml 1X Blocking Buffer II for 1 hr at room
temperature.
5.11 Wash the membrane four times with 4 ml of 1X Wash Buffer for 5 min
(each wash) at room temperature.
For Technical Support, call 1.877.726.6642 (PANOMIC) or visit our Web site at www.panomics.com.
For Technical Support, call 1.877.726.6642 (PANOMIC) or visit our Web site at www.panomics.com.
9
10
TranSignalTM TF Protein Array
7. INCUBATION OF DNA WITH THE ARRAY
MEMBRANE
Follow this protocol for use with catalogue items, MA3505, MA3506,
MA3507 and MA3508
TranSignalTM TF Protein Array
8. TROUBLESHOOTING GUIDE
Problem
Weak or no signal
Cause
Not enough protein.
This section describes incubating a biotinylated oligo of interest with the
array membrane. We recommend that you use a 5’biotinylated Oligo for
this assay.
Protein binding may be
hindered by a partially hidden
tag. Try using a higher
concentration (5-10X of the
bacterial lysate) or longer
binding time.
Concentration of bacterial
lysate is too high.
Further dilute bacterial lysate
or use purified protein.
Antibody concentration is
too high.
Further dilute the antibody.
7.2 Place the tray on a shaker and incubate for 2 hr at room temperature.
7.6 Wash the membrane two times with 4 ml of 1X Wash Buffer for 3 min
(each wash) at room temperature.
7.7 Dilute the Streptavidin - HRP (1:1000 fold) in 1X Wash Buffer and
incubate the membraneg with the diluted Streptavidin - HRP for 30
min at roomtemperature.
7.8 Wash three times with 4 ml of 1X Wash Buffer for 5 min (each wash) at
room temperature.
7.9 Continue with step 6.1 for detection.
For Technical Support, call 1.877.726.6642 (PANOMIC) or visit our Web site at www.panomics.com.
Check protein concentration
by running the sample on
SDS-PAGE.
Tag is partially hidden.
7.1 Place each membrane into a container containing 4 ml of 1X Binding
Buffer.
7.5 Incubate the membrane with the diluted DNA probe at room
temperature for 30 min with gentle shaking.
Recommendation
Check construct by DNA
sequencing. Make sure the
DNA insert is in the right frame
and that the protein expresses
properly.
Note: Be sure that the membrane is fully submerged in assay buffer at all times. Never
let the membrane dry out.
7.3 Dilute 50 - 200 ng of biotinylated DNA probe in 4 ml of 1X Binding
Buffer. For the competition assay cold probes should be in at least 5
X excess of the biotinylated probe (0.25- 1 µg)
11
High background
Dilute the Detection Buffer.
Uneven background Membrane dried out during
incubation.
Keep the membrane fully
submerged in solution during
all incubation steps.
Volume of blocking solution, Increase the volume to make
bacterial lysate or antibody is sure that the membrane is fully
too low.
submerged during incubation.
Volume of detection buffer is Increase the volume to make
too low.
sure that the membrane surface
is fully covered.
Air bubbles on membrane
surface during detection.
Remove air bubbles from
membrane surface.
For Technical Support, call 1.877.726.6642 (PANOMIC) or visit our Web site at www.panomics.com.
3
4
5
6
7
8
9
2. Chan, H M., and La Thangue, N. B. (2001) p300/CBP protiens: HAT for
trancriptional bridges and scaffolds. J Cell Science 114: 2363-2373.
3. Chunhong Yan, Heng Wang, and Douglas D. Boyd (2002) ATF3 Represses
72-kDa Type IV Collagenase (MMP-2) Expression by Antagonizing p53dependent trans-Activation of the Collagenase Promoter. J Bio Chem 277:
10804-10812.
For Technical Support, call 1.877.726.6642 (PANOMIC) or visit our Web site at www.panomics.com.
2
3
4
5
6
7
8
9
10 11 12 13 14 15 16 17 18 19 20 21 22
23 24
Schematic diagram of the TranSignal TF Protein Array. The proteins on the array are spotted in duplicate. HRP marker has
been spotted along the bottom (row F) and in duplicate along the right side (column 23, 24) of the membrane. These spots are
intended for alignment. Note that the notch is at the top right-hand corner.
1
pos pos pos pos pos pos pos pos pos pos F
pos pos E
TranSignalTM TF Protein Array
F pos pos pos pos pos pos pos pos pos pos pos pos pos pos
E GTF2H2 GTF2H2 GTF2I GTF2I GTF3C5 GTF3C5 HAND1 HAND1
D ETS2 ETS2 F2RL F2RL FOS FOS FOSB FOSB FOSL1 FOSL1 FOSL2 FOSL2 GATA1 GATA1 GCNF GCNF GMEB1 GMEB1 GR GR GTF2B GTF2B pos pos D
C E2F3 E2F3 E2F4 E2F4 E2F5 E2F5 E2F6 E2F6 EGR1 EGR1 EGR2 EGR2 EGR4 EGR4 ERα ERα ERβ ERβ ERRγ ERRγ ETS1 ETS1 pos pos C
B CBFB CBFC CDX2 CDX2 CREB1 CREB1 CREBL2 CREBL2 CREM CREM CRSP9 CRSP9 ELK ELK DDIT3 DDIT3 DLX4 DLX4 DMTF1 DMTF1 DR1 DR1 pos pos B
REFERENCES
10 11 12 13 14 15 16 17 18 19 20 21 22 23 24
1. Sawyer TK (2001) Decifering therapeutic targets. BioTechniques 30: 10861090.
A AES AES AP2α AP2α ASCL1 ASCL1 ASH2L ASH2L ATF1 ATF1 ATF2 ATF2 ATF3 ATF3 ATF4 ATF4 BLZF1 BLZF1 BTG2 BTG2 C/EBPα C/EBPα pos pos A
2
9.
1
12
TranSignalTM TF Protein Array
APPENDIX A: Schematic diagram of the
TranSignal TF Protein Array Version I
For Technical Support, call 1.877.726.6642 (PANOMIC) or visit our Web site at www.panomics.com.
13
2
3
4
5
6
7
8
9
10 11 12 13 14 15 16 17 18 19 20 21 22 23 24
2
3
4
5
6
7
8
9
10 11 12 13 14 15 16 17 18 19 20 21 22
23 24
pos pos pos pos pos pos pos pos pos pos F
pos pos E
For Technical Support, call 1.877.726.6642 (PANOMIC) or visit our Web site at www.panomics.com.
3
4
5
6
7
8
9
10 11 12 13 14 15 16 17 18 19 20 21 22 23 24
pos pos E
2
3
4
5
6
7
8
9
10 11 12 13 14 15 16 17 18 19 20 21 22 23 24
Schematic diagram of the TranSignal TF Protein Array. The proteins on the array are spotted in duplicate. HRP marker has
been spotted along the bottom (row F) and in duplicate along the right side (column 23, 24) of the membrane. These spots are
intended for alignment. Note that the notch is at the top right-hand corner.
1
TranSignalTM TF Protein Array
F pos pos pos pos pos pos pos pos pos pos pos pos pos pos pos pos pos pos pos pos pos pos pos pos F
E YY1 YY1
D TCEA1 TCEA1 TCF7L2 TCF7L2 TF2D TF2D TFE3 TFE3 TFEC TFEC THRA THRA TLX TLX TRb1 TRb1 TRCP TRCP TRIP13 TRIP13 v-Myc v-Myc pos pos D
C SMARCB1 SMARCB1 SMARCE1 SMARCE1 SP1 SP1 SP3 SP3 SP4 SP4 SRY SRY STAT1 STAT1 STAT3 STAT3 STAT4 STAT4 STAT6 STAT6 SURB7 SURB7 pos pos C
B PXR2 PXR2 REL REL REVERB REVERB RFXANK RFXANK RXR1B RXR1B RXRA RXRA RXRG RXRG RYBP RYBP SCML1 SCML1 SHP SHP SIX2 SIX2 pos pos B
A PFDN4 PFDN4 POU2AF1 POU2AF1 PPARα PPARα PPARβ PPARβ PPARγ1 PPARγ1 PPARγ2 PPARγ2 PSMC5 PSMC5 PTGER2 PTGER2 PTTG1 PTTG1 PTTG2 PTTG2 PURA PURA pos pos A
2
APPENDIX B: Schematic diagram of the
TranSignal TF Protein Array Version II
1
Schematic diagram of the TranSignal TF Protein Array. The proteins on the array are spotted in duplicate. HRP marker has
been spotted along the bottom (row F) and in duplicate along the right side (column 23, 24) of the membrane. These spots are
intended for alignment. Note that the notch is at the top right-hand corner.
1
F pos pos pos pos pos pos pos pos pos pos pos pos pos pos
E PAX6 PAX6 PAX9 PAX9 PBX1 PBX1
D NFIL3 NFIL3 NFκBp50 NFκBp50 NFκBp65 NFκBp65 NFYB NFYB NR1H2 NR1H2 NR1I2 NR1I2 NR1I3 NR1I3 NR2E1 NR2E1 NR5A2 NR5A2 p53 p53 PALM PALM pos pos D
C MADH4 MADH4 MAFK MAFK MAX MAX MECP2 MECP2 MEF2A MEF2A MEF2B MEF2B MEF2C MEF2C MEF2D MEF2D MSX1 MSX1 NAB1 NAB1 NFE2 NFE2 pos pos C
B ISGF3G ISGF3G ISL1 ISL1 JUN JUN JUNB JUNB KLF12 KLF12 KLF7 KLF7 LDB1 LDB1 LHX2 LHX2 LRH1 LRH1 MADH1 MADH1 MADH3 MADH3 pos pos B
A HAND2 HAND2 HDAC1 HDAC1 HOXA5 HOXA5 HEY HEY HNF4G HNF4G HOXA5 HOXA5 HOXB13 HOXB13 HOXC11 HOXC11 ID1 ID1 ID2 ID2 IRF1 IRF1 pos pos A
1
14
TranSignalTM TF Protein Array
APPENDIX C: Schematic diagram of the
TranSignal TF Protein Array Version III
For Technical Support, call 1.877.726.6642 (PANOMIC) or visit our Web site at www.panomics.com.
15
2
3
4
5
6
7
8
9
10 11 12 13 14 15 16 17 18 19 20 21 22 23 24
2
3
4
5
6
7
8
9
10 11 12 13 14 15 16 17 18 19 20 21 22 23 24
pos pos pos pos pos pos pos pos pos pos E
pos pos D
Schematic diagram of the TranSignal TF Protein Array. The proteins on the array are spotted in duplicate. HRP marker has
been spotted along the bottom (row E) and in duplicate along the right side (column 23, 24) of the membrane. These spots are
intended for alignment. Note that the notch is at the top right-hand corner.
1
E pos pos pos pos pos pos pos pos pos pos pos pos pos pos
D PPARγ1 PPARγ1 PPARγ2 PPARγ2 PXR-2 PXR-2 RXR-A RXR-A SP1 SP1 SP4 SP4 STAT1 STAT1 v-Myc v-Myc YY1 YY1
C JUNB JUNB MAX MAX MEF2A MEF2A MEF2B MEF2B NFE2 NFE2 NFκBp50 NFκBp50 NFκBp65 NFκBp65 PAX6 PAX6 PBX1 PBX1 PPARα PPARα PPARβ PPARβ pos pos C
B EGR2 EGR2 EGR4 EGR4 ETS1 ETS1 ETS2 ETS2 FOS FOS FOSB FOSB GATA1 GATA1 GR GR HNF4G HNF4G IRF1 IRF1 JUN JUN pos pos B
A AP2a AP2a ATF1 ATF1 ATF2 ATF2 ATF3 ATF3 ATF4 ATF4 C/EBPa C/EBPa CDX2 CDX2 CREB1 CREB1 E2F3 E2F3 E2F4 E2F4 EGR1 EGR1 pos pos A
1
16
TranSignalTM TF Protein Array
TranSignalTM TF Protein Array
APPENDIX D: Schematic diagram of the
TranSignal TF Protein Array Version IV
For Technical Support, call 1.877.726.6642 (PANOMIC) or visit our Web site at www.panomics.com.
A.
1 2 3 4 5 6 7 8 9 10 11 12 13 14 15 16 17 18 19 20 21 22 23 24
For Technical Support, call 1.877.726.6642 (PANOMIC) or visit our Web site at www.panomics.com.
17
APPENDIX E: Typical Results of the TranSignal TF
Protein Array when screening protein - protein
interactions
Purified p53 Protein
A
B
C
D
E
F
1 2 3 4 5 6 7 8 9 10 11 12 13 14 15 16 17 18 19 20 21 22 23 24
B. Bacterial Lysate containing p53
A
B
C
D
E
F
18
TranSignalTM TF Protein Array
C.
TranSignalTM TF Protein Array
19
APPENDIX F: Typical Results of the TranSignal TF
Protein Array when screening protein - DNA
interactions
Negative Control
A
B
C
D
E
F
1 2 3 4 5 6 7 8 9 10 11 12 13 14 15 16 17 18 19 20 21 22 23 24
Typical results obtained with the TranSignal TF Protein Array. p53-expressing bacterial
lysate (A), p53 purified protein (B), and buffer only (C) were incubated with the TranSignal TF
Protein Array membrane for 2 hours and detected by p53 monoclonal antibody (Upstate
Biotechnology) and anti-mouse Ig HRP conjugate (Amersham). Images were acquired using
FluorChem™ imager (Alpha Innotech). As reported in the literature, ATF3 (position A11,
A12) interacts with p53 (3).
Typical results obtained with the TranSignal TF Protein Array IV. The TF protein array
IV was incubated with the biotinylated PCR product of the rat PEPCK Promoter
Region (-1 to -465) alone (Figure A) and both biotinylated and unlabeled PEPCK
promoter (Figure B.). Images were acquired using FluorChem™ imager (Alpha Innotech).
Specific Protein/DNA interactions (boxes) were competed out with unlabeled probe,
whereas non-specific binding of the probe was not.
For Technical Support, call 1.877.726.6642 (PANOMIC) or visit our Web site at www.panomics.com.
For Technical Support, call 1.877.726.6642 (PANOMIC) or visit our Web site at www.panomics.com.
20
TranSignalTM TF Protein Array
NOTES:
For Technical Support, call 1.877.726.6642 (PANOMIC) or visit our Web site at www.panomics.com.