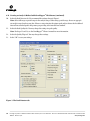
1
TECHNICAL MANUAL
PowerPlex® S5 System
Instructions for Use of Products
DC6951 and DC6950
Revised 11/15
TMD021
PowerPlex® S5 System
All technical literature is available at: www.promega.com/protocols/
Visit the web site to verify that you are using the most current version of this Technical Manual.
E-mail Promega Technical Services if you have questions on use of this system: [email protected]
1. Description.......................................................................................................................................... 2
2. Product Components and Storage Conditions......................................................................................... 4
3. Before You Begin.................................................................................................................................. 5
3.A.Precautions................................................................................................................................. 5
3.B. Matrix Standardization or Spectral Calibration.............................................................................. 5
4. Protocols for DNA Amplification Using the PowerPlex® S5 System........................................................... 6
4.A. Amplification Setup..................................................................................................................... 6
4.B. Amplification Thermal Cycling...................................................................................................... 8
5. Instrument Setup and Sample Preparation............................................................................................. 9
5.A. Detection of Amplified Fragments Using the ABI PRISM® 3100 or 3100-Avant
Genetic Analyzer with Data Collection Software, Version 2.0, or the Applied Biosystems 3130
or 3130xl Genetic Analyzer with Data Collection Software, Version 3.0........................................... 9
5.B. Detection of Amplified Fragments Using the ABI PRISM® 3100 Genetic Analyzer
with Data Collection Software, Version 1.0.1 or 1.1..................................................................... 11
5.C. Detection of Amplified Fragments Using the ABI PRISM® 310 Genetic Analyzer............................. 14
6. Data Analysis..................................................................................................................................... 16
6.A.PowerPlex® Panels and Bins Text Files with GeneMapper® ID, Version 3.2.................................... 16
6.B. Creating an Analysis Method with GeneMapper® ID Software....................................................... 16
6.C. Sample Analysis Using the GeneScan® Software and Windows® Operating Systems........................ 21
6.D. Sample Analysis Using the GeneScan® Software and Macintosh® Operating Systems....................... 23
6.E. Sample Analysis Using the Genotyper® Software and PowerTyper™ S5 Macro............................... 24
6.F.Controls.................................................................................................................................... 26
6.G.Results..................................................................................................................................... 26
7. Troubleshooting................................................................................................................................ 29
7.A. Amplification and Fragment Detection........................................................................................ 29
7.B.GeneMapper® ID Analysis Software............................................................................................ 32
7.C. PowerTyper™ S5 Macro............................................................................................................. 36
8. References......................................................................................................................................... 38
Promega Corporation · 2800 Woods Hollow Road · Madison, WI 53711-5399 USA · Toll Free in USA 800-356-9526 · 608-274-4330 · Fax 608-277-2516
www.promega.com TMD021 · Revised 11/15
1
9. Appendix........................................................................................................................................... 41
9.A. Advantages of Using the Loci in the PowerPlex® S5 System........................................................... 41
9.B. DNA Extraction and Quantitation Methods and Automation Support............................................. 43
9.C. The Internal Lane Standard 600................................................................................................. 44
9.D. Preparing the PowerPlex® S5 System PCR Amplification Mix........................................................ 44
9.E. Composition of Buffers and Solutions.......................................................................................... 45
9.F. Related Products....................................................................................................................... 45
9.G. Summary of Changes................................................................................................................. 46
1.Description
STR (short tandem repeat) loci consist of short, repetitive sequence elements 3–7 base pairs in length (1–4). These
repeats are well distributed throughout the human genome and are a rich source of highly polymorphic markers, which
may be detected using the polymerase chain reaction (5–8). Alleles of STR loci are differentiated by the number of
copies of the repeat sequence contained within the amplified region and are distinguished from one another using
fluorescence detection following electrophoretic separation.
The PowerPlex® S5 System(a,b) is used for human identification applications including forensic analysis, relationship
testing and research use. The system allows co-amplification and detection of five loci (four STR loci and Amelogenin),
including D8S1179, D18S51, Amelogenin, FGA and TH01. One primer specific for each of Amelogenin, D18S51 and
D8S1179 loci is labeled with fluorescein (FL) and one primer specific for each of the TH01 and FGA loci is labeled with
6-carboxy-4´,5´-dichloro-2´,7´-dimethoxy-fluorescein (JOE). All five loci are amplified simultaneously in a single
tube and analyzed in a single injection.
The PowerPlex® S5 System is compatible with the ABI PRISM® 310, 3100 and 3100-Avant and Applied Biosystems
3130 and 3130xl Genetic Analyzers. The protocols presented in this manual were tested at Promega Corporation.
Amplification and detection instrumentation may vary. You may need to optimize protocols including cycle number
and injection conditions (or loading volume) for each laboratory instrument. In-house validation should be performed.
The PowerPlex® S5 System provides all of the materials necessary to amplify STR regions of purified human genomic
DNA. This manual contains a protocol for use of the PowerPlex® S5 System with the Applied Biosystems 2720 and
GeneAmp® PCR system 9600, 9700 and 2400 thermal cyclers in addition to protocols to separate amplified products
and detect separated material (Figure 1). Protocols to operate the fluorescence-detection instruments should be
obtained from the instrument manufacturer.
Information on other Promega fluorescent STR systems is available upon request from Promega or online at:
www.promega.com
2
Promega Corporation · 2800 Woods Hollow Road · Madison, WI 53711-5399 USA · Toll Free in USA 800-356-9526 · 608-274-4330 · Fax 608-277-2516
TMD021 · Revised 11/15
www.promega.com
Amplification Setup
Section 4.A
Thermal Cycling
Section 4.B
GeneAmp® PCR System 9700
GeneAmp® PCR System 9600
GeneAmp® PCR System 2400
Applied Biosystems 2720
Instrument Setup and Sample Preparation
Section 5
Applied Biosystems® 3130 or 3130xl
Genetic Analyzer with Data Collection
Software, Version 3.0
Section 5.A
ABI PRISM® 3100 or 3100-Avant
Genetic Analyzer with Data Collection
Software, Version 2.0
Section 5.A
ABI PRISM® 3100 Genetic Analyzer
with Data Collection Software,
Version 1.0.1 or 1.1
Section 5.B
ABI PRISM® 310 Genetic Analyzer
Section 5.C
Data Analysis
Section 6
GeneMapper® ID Software,
Versions 3.1 and 3.2
GeneScan® Software and
Windows® Operating Systems
GeneScan® Software and
Macintosh® Operating Systems
Figure 1. An overview of the PowerPlex® S5 System protocol.
Promega Corporation · 2800 Woods Hollow Road · Madison, WI 53711-5399 USA · Toll Free in USA 800-356-9526 · 608-274-4330 · Fax 608-277-2516
www.promega.com TMD021 · Revised 11/15
3
2.
Product Components and Storage Conditions
PRODUCT
PowerPlex® S5 System
S I Z E C A T. #
100 reactions
DC6951
Not For Medical Diagnostic Use. Cat.# DC6951 contains sufficient reagents for 100 reactions of 25µl each.
Includes:
Pre-amplification Components Box (Blue Label)
•
500µlPowerPlex® S5 5X Master Mix
•
250µlPowerPlex® S5 10X Primer Pair Mix
•
25µl 2800M Control DNA, 10ng/µl
• 5 × 1,250µl Water, Amplification Grade
Post-amplification Components Box (Beige Label)
•
•
25µlPowerPlex® S5 Allelic Ladder Mix
150µl Internal Lane Standard (ILS) 600
PRODUCT
PowerPlex® S5 System
S I Z E C A T. #
400 reactions
DC6950
Not For Medical Diagnostic Use. Cat.# DC6950 contains sufficient reagents for 400 reactions of 25µl each.
Includes:
Pre-amplification Components Box (Blue Label)
• 4 × 500µl
• 4 × 250µl
•
25µl
•10 × 1,250µl
PowerPlex® S5 5X Master Mix
PowerPlex® S5 10X Primer Pair Mix
2800M Control DNA, 10ng/µl
Water, Amplification Grade
Post-amplification Components Box (Beige Label)
•
•
!
4 × 25µl PowerPlex® S5 Allelic Ladder Mix
4 × 150µl Internal Lane Standard (ILS) 600
The PowerPlex® S5 Allelic Ladder Mix is provided in a separate, sealed bag for shipping. This component should be
moved to the post-amplification box after opening. The Water, Amplification Grade, is provided in a separate sealed
bag for shipping. This component should be moved to the pre-amplification box after opening.
Storage Conditions: Store all components except the 2800M Control DNA at –30°C to –10°C in a nonfrost-free
freezer. Store the 2800M Control DNA at 2 to 10°C. The PowerPlex® S5 10X Primer Pair Mix, PowerPlex® S5 Allelic
Ladder Mix and Internal Lane Standard 600 are light-sensitive and must be stored in the dark. We strongly recommend
that pre-amplification and post-amplification reagents be stored and used separately with different pipettes, tube racks,
etc.
The PowerTyper™ Macro S5 for use with Genotyper® software can be downloaded at:
www.promega.com/resources/tools/powertyper-macros/
The proper panels and bins text files for use with GeneMapper® ID software can be obtained from the Promega web
site at: www.promega.com/resources/tools/genemapper-id-software-panels-and-bin-sets/
4
Promega Corporation · 2800 Woods Hollow Road · Madison, WI 53711-5399 USA · Toll Free in USA 800-356-9526 · 608-274-4330 · Fax 608-277-2516
TMD021 · Revised 11/15
www.promega.com
Matrix standards are required for initial setup of the color separation matrix. The matrix standards are sold separately
and are available for the ABI PRISM® 310 Genetic Analyzer (PowerPlex® Matrix Standards, 310; Cat.# DG4640) and
the ABI PRISM® 3100 and 3100-Avant and Applied Biosystems 3130 and 3130xl Genetic Analyzers (PowerPlex®
Matrix Standards, 3100/3130; Cat.# DG4650). See Section 9.F for ordering information.
3.
Before You Begin
3.A.Precautions
The application of PCR-based typing for forensic or paternity casework requires validation studies and quality-control
measures that are not contained in this manual (9–11). The quality of purified DNA, small changes in buffers, ionic
strength, primer concentrations, choice of thermal cycler and thermal cycling conditions can affect PCR success. We
suggest strict adherence to recommended procedures for amplification, as well as fluorescence detection. Additional
research and validation are required if any modifications are made to the recommended protocols.
PCR-based STR analysis is subject to contamination by very small amounts of human DNA. Extreme care should be
taken to avoid cross-contamination when preparing sample DNA, handling primer pairs, assembling amplification
reactions and analyzing amplification products. Reagents and materials used prior to amplification (PowerPlex® S5
5X Master Mix, PowerPlex® S5 10X Primer Pair Mix, Water, Amplification Grade and 2800M Control DNA) are
provided in a separate box and should be stored separately from those used following amplification (PowerPlex® S5
Allelic Ladder Mix and Internal Lane Standard 600). Always include a negative control reaction (i.e., no template) to
detect reagent contamination. We highly recommend the use of gloves and aerosol-resistant pipette tips (e.g., ART®
tips).
3.B. Matrix Standardization or Spectral Calibration
Proper generation of a matrix file is critical to evaluate multicolor systems with the ABI PRISM® 310, 3100 and
3100-Avant and Applied Biosystems 3130 and 3130xl Genetic Analyzers. A matrix must be generated for each
individual instrument.
The PowerPlex® Matrix Standards, 310 (Cat.# DG4640), is required for matrix standardization for the ABI PRISM®
310 Genetic Analyzer. The PowerPlex® Matrix Standards, 3100/3130 (Cat.# DG4650), cannot be used to generate a
matrix on the ABI PRISM® 310 Genetic Analyzer.
The PowerPlex® Matrix Standards, 3100/3130 (Cat.# DG4650), is required for spectral calibration on the
ABI PRISM® 3100 and 3100-Avant Genetic Analyzers and Applied Biosystems 3130 and 3130xl Genetic Analyzers.
The PowerPlex® Matrix Standards, 310 (Cat.# DG4640), cannot be used to generate a matrix on these instruments.
For protocols and additional information on matrix standardization, see the PowerPlex® Matrix Standards, 310,
Technical Bulletin #TBD021. For protocols and additional information about spectral calibration, see the PowerPlex®
Matrix Standards, 3100/3130, Technical Bulletin #TBD022. These manuals are available online at:
www.promega.com/protocols/
Promega Corporation · 2800 Woods Hollow Road · Madison, WI 53711-5399 USA · Toll Free in USA 800-356-9526 · 608-274-4330 · Fax 608-277-2516
www.promega.com TMD021 · Revised 11/15
5
4.
Protocols for DNA Amplification Using the PowerPlex® S5 System
Materials to Be Supplied by the User
•
Applied Biosystems 2720 or GeneAmp® PCR System 9600, 9700 or 2400 thermal cyclers (Applied Biosystems)
•microcentrifuge
•
0.2ml MicroAmp® reaction tubes or MicroAmp® optical 96-well reaction plate (Applied Biosystems)
•
aerosol-resistant pipette tips
We routinely amplify 0.25–0.5ng of template DNA in a 25µl reaction volume using the protocols detailed below.
Expect to see high peak heights at the smaller loci and lower peak heights at the larger loci if more than the
recommended amount of template is used. When using high template amounts, reduce the amount of template DNA
or the number of cycles (25–28 cycles).
The PowerPlex® S5 System is optimized for the GeneAmp® PCR System 9700 thermal cycler. Amplification protocols
for the Applied Biosystems 2720 and GeneAmp® PCR Systems 9600 and 2400 thermal cyclers also are provided.
4.A. Amplification Setup
!
The use of gloves and aerosol-resistant pipette tips is highly recommended to prevent cross-contamination. Keep all
pre-amplification and post-amplification reagents in separate rooms. Prepare amplification reactions in a room
dedicated for reaction setup. Use equipment and supplies dedicated for amplification setup.
Meticulous care must be taken to ensure successful amplification. A guide to amplification troubleshooting is provided
in Section 7.A.
The concentration of 2800M Control DNA was determined by measuring absorbance at 260nm. Quantification of this
control DNA by other methods, such as qPCR, may result in a different value. Prepare a fresh DNA dilution for each set
of amplifications. Do not store diluted DNA (e.g., 0.25ng/μl or less).
1.
Thaw the PowerPlex® S5 5X Master Mix and PowerPlex® S5 10X Primer Pair Mix completely.
Note: Mix reagents by vortexing each tube for 15 seconds before each use. Do not centrifuge the 10X Primer
Pair Mix after vortexing, as this may cause the primers to be concentrated at the bottom of the tube.
2.
Determine the number of reactions to be set up. This should include positive and negative control reactions.
Add 1 or 2 reactions to this number to compensate for pipetting error. While this approach does consume a
small amount of each reagent, it ensures that you will have enough PCR amplification mix for all samples. It also
ensures that each reaction contains the same PCR amplification mix.
3.
Place one clean, 0.2ml reaction tube for each reaction into a rack, and label appropriately. Alternatively, use a
MicroAmp® plate, and label appropriately.
4.
Add the final volume of each reagent listed in Table 1 into a sterile tube.
Table 1 shows the component volumes per reaction. A worksheet to calculate the required amount of each
component of the PCR amplification mix is provided in Section 9.D (Table 5).
Note: In tests performed at Promega, we have found that reactions can remain at room temperature for up to
4 hours after reaction assembly and prior to thermal cycling with no adverse effect on amplification results.
6
Promega Corporation · 2800 Woods Hollow Road · Madison, WI 53711-5399 USA · Toll Free in USA 800-356-9526 · 608-274-4330 · Fax 608-277-2516
TMD021 · Revised 11/15
www.promega.com
Table 1. PCR Amplification Mix for the PowerPlex® S5 System.
PCR Amplification Mix Component1
Water, Amplification Grade
Volume Per Reaction
to a final volume of 25.0µl
PowerPlex S5 5X Master Mix
5.0µl
PowerPlex® S5 10X Primer Pair Mix
2.5µl
®
template DNA (0.25–0.5ng)
2
total reaction volume
up to 17.5µl
25µl
Add Water, Amplification Grade, to the PCR amplification mix first, then add PowerPlex® S5
5X Master Mix and PowerPlex® S5 10X Primer Pair Mix. The template DNA will be added at Step 7.
1
Store DNA templates in Water, Amplification Grade, or TE–4 buffer (10mM Tris-HCl [pH 8.0],
0.1mM EDTA). If the DNA template is stored in TE buffer that is not pH 8.0 or contains a higher
EDTA concentration, the volume of the DNA sample added should not exceed 20% of the final
reaction volume. PCR amplification efficiency and quality can be greatly altered by changes in pH
(due to added Tris-HCl), available magnesium concentration (due to chelation by EDTA) or other
PCR inhibitors, which may be present at low concentrations depending on the source of the template
DNA and the extraction procedure used.
2
5.
Vortex the PCR amplification mix for 5–10 seconds.
Note: Failure to vortex the PCR amplification mix sufficiently can result in poor amplification, peak height
imbalance and extra peaks in the range of 50–80bp.
!
6.
Pipet the appropriate volume of PCR amplification mix into each reaction tube.
7.
Pipet the template DNA (0.25–0.5ng) for each sample into the respective tube containing PCR amplification mix.
8.
For the positive amplification control, vortex the tube of 2800M Control DNA, then dilute an aliquot to 0.5ng in
the desired template DNA volume. Pipet 0.5ng of diluted 2800M Control DNA into a reaction tube containing
PCR amplification mix.
Note: To store diluted 2800M Control DNA, dilute the DNA to 0.5ng/μl in TE–4 buffer with 20μg/ml glycogen
and store at 4°C. Do not store dilutions performed in water.
9.
For the negative amplification control, pipet Water, Amplification Grade, or TE–4 buffer instead of template DNA
into a reaction tube containing PCR amplification mix.
10. Optional: Briefly centrifuge the tubes to bring contents to the bottom and remove any air bubbles.
Promega Corporation · 2800 Woods Hollow Road · Madison, WI 53711-5399 USA · Toll Free in USA 800-356-9526 · 608-274-4330 · Fax 608-277-2516
www.promega.com TMD021 · Revised 11/15
7
4.B. Amplification Thermal Cycling
Amplification and detection instrumentation may vary. You may need to optimize protocols including cycle number
and injection conditions (or loading volume) for each laboratory instrument. Testing at Promega Corporation shows
that 30 cycles work well with 0.25–0.5ng of purified DNA. Increased cycle number (32–34 cycles) will result in
increased sensitivity when using low amounts of template. Decreased cycle number may be used if a higher amount
of template is added to the amplification. For reactions containing ≥1ng of DNA the number of cycles may be reduced
(25–28 cycles). In-house validation should be performed.
1.
Place the tubes or MicroAmp® plate in a thermal cycler.
2.
Run the recommended protocol provided below for use with the GeneAmp® PCR System 9600, 9700 and 2400
thermal cyclers and Applied Biosystems 2720 thermal cycler.
For information about other thermal cyclers, please contact Promega Technical Services by e-mail:
[email protected]
Thermal Cycling Protocol
96°C for 2 minutes, then:
94°C for 30 seconds
60°C for 2 minutes
72°C for 90 seconds
for 30 cycles, then:
60°C for 45 minutes
4°C soak
When running the GeneAmp® PCR System 9700 thermal
cycler, use the Method Option, Ramp Speed: 9600.
1
3.
After completion of the thermal cycling protocol, store amplified samples at –20°C in a light-protected box.
Notes:
1.
Long-term storage of amplified samples at 4°C or higher may produce degradation products.
2.
A precipitate may form during amplification. This precipitate does not affect downstream analysis or capillary
electrophoresis performance.
8
Promega Corporation · 2800 Woods Hollow Road · Madison, WI 53711-5399 USA · Toll Free in USA 800-356-9526 · 608-274-4330 · Fax 608-277-2516
TMD021 · Revised 11/15
www.promega.com
5.
Instrument Setup and Sample Preparation
5.A. Detection of Amplified Fragments Using the ABI PRISM® 3100 or 3100-Avant Genetic Analyzer
with Data Collection Software, Version 2.0, or the Applied Biosystems 3130 or 3130xl Genetic
Analyzer with Data Collection Software, Version 3.0
Materials to Be Supplied by the User
•
dry heating block, water bath or thermal cycler
•
crushed ice or ice-water bath
•
centrifuge compatible with 96-well plates
•
aerosol-resistant pipette tips
•
3100 or 3130 capillary array, 36cm
•
performance optimized polymer 4 (POP-4®) for the 3100 or 3130
•
10X genetic analyzer buffer with EDTA
•MicroAmp® optical 96-well plate and septa
•
Hi-Di™ formamide (Applied Biosystems Cat.# 4311320)
•PowerPlex® Matrix Standards, 3100/3130 (Cat.# DG4650)
!
The quality of formamide is critical. Use Hi-Di™ formamide. Freeze formamide in aliquots at –20°C. Multiple
freeze-thaw cycles or long-term storage at 4°C may cause breakdown of formamide. Poor-quality formamide may
contain ions that compete with DNA during injection, which results in lower peak heights and reduced sensitivity.
A longer injection time may not increase the signal.
!
Formamide is an irritant and a teratogen; avoid inhalation and contact with skin. Read the warning label and take
appropriate precautions when handling this substance. Always wear gloves and safety glasses when working with
formamide.
Sample Preparation
1.
Prepare a loading cocktail by combining and mixing Internal Lane Standard 600 and Hi-Di™ formamide as
follows:
[(0.5µl ILS 600) × (# injections)] + [(9.5µl Hi-Di™ formamide) × (# injections)]
Note: The volume of internal lane standard used in the loading cocktail can be increased or decreased to adjust
the intensity of size standard peaks. The optimal peak height for the 100-base fragment of the internal lane
standard is 500–1,000RFU. If peak heights are too low, we recommend altering the formamide/internal lane
standard mix to contain 1.0µl of ILS 600 and 9.0µl of Hi-Di™ formamide. If peak heights are too high, we
recommend altering the loading cocktail to contain 0.25µl of ILS 600 and 9.75µl of formamide.
Promega Corporation · 2800 Woods Hollow Road · Madison, WI 53711-5399 USA · Toll Free in USA 800-356-9526 · 608-274-4330 · Fax 608-277-2516
www.promega.com TMD021 · Revised 11/15
9
5.A. Detection of Amplified Fragments Using the ABI PRISM® 3100 or 3100-Avant Genetic Analyzer
with Data Collection Software, Version 2.0, or the Applied Biosystems 3130 or 3130xl Genetic
Analyzer with Data Collection Software, Version 3.0 (continued)
2.
Vortex for 10–15 seconds to mix.
3.
Pipet 10µl of formamide/internal lane standard mix into each well.
4.
Add 1µl of amplified sample (or 1µl of PowerPlex® S5 Allelic Ladder Mix). Cover wells with appropriate septa.
Notes:
1.
Instrument detection limits vary; therefore, the injection time, injection voltage or amount of product
mixed with loading cocktail may need to be adjusted. Use the Module Manager in the data collection
software to modify the injection time or voltage in the run module.
2.
A precipitate may form during amplification. This precipitate does not affect downstream analysis or
capillary electrophoresis performance.
5.
Centrifuge plate briefly to remove air bubbles from the wells.
6.
Denature samples at 95°C for 3 minutes, then immediately chill on crushed ice or in an ice-water bath for
3 minutes. Denature samples just prior to loading the instrument.
Instrument Preparation
Refer to the instrument manual for instructions on cleaning the pump blocks, installing the capillary array, performing
a spatial calibration and adding polymer to the reserve syringe.
Analyze samples as described in the user’s manual for the ABI PRISM® 3100 or 3100-Avant Genetic Analyzer with
Data Collection Software, Version 2.0, and the Applied Biosystems 3130 or 3130xl Genetic Analyzer with the following
exceptions.
1.
In the Module Manager, select “New”. Select “Regular” in the Type drop-down list, and select
“HIDFragmentAnalysis36_POP4” in the Template drop-down list. Confirm that the injection time is 5 seconds
and the injection voltage is 3kV. Change the run time to 1,200 seconds. Give a new name to your run module,
and select “OK”.
Note: Instrument sensitivities can vary. The injection time and voltage may be adjusted in the Module Manager.
A suggested range for the injection time is 3–15 seconds and for the injection voltage is 1–5kV.
2.
In the Protocol Manager, select “New”. Type a name for your protocol. Select “Regular” in the Type drop-down
list, and select the run module you created in the previous step in the Run Module drop-down list. Lastly, select
“F” in the Dye-Set drop-down list. Select “OK”.
3.
In the Plate Manager, create a new plate record as described in the instrument user’s manual. In the dialog box
that appears, select “GeneMapper—Generic” in the Application drop-down list, and select the appropriate plate
type (96-well). Add entries in the owner and operator windows, and select “OK”.
Note: If autoanalysis of sample data is desired, refer to the instrument user’s manual for instructions.
10
Promega Corporation · 2800 Woods Hollow Road · Madison, WI 53711-5399 USA · Toll Free in USA 800-356-9526 · 608-274-4330 · Fax 608-277-2516
TMD021 · Revised 11/15
www.promega.com
4.
In the GeneMapper® plate record, enter sample names in the appropriate cells. Scroll to the right. In the Results
Group 1 column, select the desired results group. In the Instrument Protocol 1 column, select the protocol you
created in Step 2. Be sure this information is present for each row that contains a sample name. Select “OK”.
Note: To create a new results group, select “New” in the drop-down menu in the Results Group column. Select
the General tab, and enter a name. Select the Analysis tab, and select “GeneMapper—Generic” in the Analysis
type drop-down list.
5.
Place samples in the instrument, and close the instrument doors.
6.
In the spectral viewer, confirm that dye set F is active, and set the correct active calibration for dye set F.
7.
In the run scheduler, locate the plate record that you just created in Steps 3 and 4, and click once on the name to
highlight it.
8.
Once the plate record is highlighted, click the plate graphic that corresponds to the plate on the autosampler that
contains your amplified samples.
9.
When the plate record is linked to the plate, the plate graphic will change from yellow to green, and the green
Run Instrument arrow becomes enabled.
10. Click the green Run Instrument arrow on the toolbar to start the sample run.
11. Monitor electrophoresis by observing the run, view, array or capillaries viewer windows in the collection
software. Each injection will take approximately 35 minutes.
5.B. Detection of Amplified Fragments Using the ABI PRISM® 3100 Genetic Analyzer with Data
Collection Software, Version 1.0.1 or 1.1
Materials to Be Supplied by the User
•
95°C dry heating block, water bath or thermal cycler
•
crushed ice or ice-water bath
•
aerosol-resistant pipette tips
•
centrifuge compatible with 96-well plates
•
3100 capillary array, 36cm
•
performance optimized polymer 4 (POP-4®) for the 3100
•
10X genetic analyzer buffer with EDTA
•MicroAmp® optical 96-well plate and septa for the 3100
•
Hi-Di™ formamide (Applied Biosystems Cat.# 4311320)
•PowerPlex® Matrix Standards, 3100/3130 (Cat.# DG4650)
!
The quality of formamide is critical. Use Hi-Di™ formamide. Freeze formamide in aliquots at –20°C. Multiple
freeze-thaw cycles or long-term storage at 4°C may cause breakdown of formamide. Poor-quality formamide may
contain ions that compete with DNA during injection, which results in lower peak heights and reduced sensitivity.
A longer injection time may not increase the signal.
Promega Corporation · 2800 Woods Hollow Road · Madison, WI 53711-5399 USA · Toll Free in USA 800-356-9526 · 608-274-4330 · Fax 608-277-2516
www.promega.com TMD021 · Revised 11/15
11
5.B. Detection of Amplified Fragments Using the ABI PRISM® 3100 Genetic Analyzer with Data
Collection Software, Version 1.0.1 or 1.1 (continued)
!
Formamide is an irritant and a teratogen; avoid inhalation and contact with skin. Read the warning label and take
appropriate precautions when handling this substance. Always wear gloves and safety glasses when working with
formamide.
Sample Preparation
1.
Prepare a loading cocktail by combining and mixing Internal Lane Standard 600 and Hi-Di™ formamide as
follows:
[0.5µl ILS 600) × (# injections)] + [(9.5µl Hi-Di™ formamide) × (# injections)]
Note: The volume of internal lane standard used in the loading cocktail can be increased or decreased to adjust
the intensity of size standard peaks. The optimal peak height for the 100-base fragment of the internal lane
standard is 500–1,000RFU. If peak heights are too low, we recommend altering the formamide/internal lane
standard mix to contain 1.0µl of ILS 600 and 9.0µl of Hi-Di™ formamide. If peak heights are too high, we
recommend altering the loading cocktail to contain 0.25µl of ILS 600 and 9.75µl of formamide.
2.
Vortex for 10–15 seconds to mix.
3.
Pipet 10µl of formamide/internal lane standard mix into each well.
4.
Add 1µl of amplified sample (or 1µl of allelic ladder mix). Cover wells with appropriate septa.
Notes:
1.
Instrument detection limits vary; therefore, injection time, injection voltage or the amount of product
mixed with loading cocktail may need to be adjusted. Use the Module Editor in the Tools menu to modify
the injection time or voltage in the run module.
2.
A precipitate may form during amplification. This precipitate does not affect downstream analysis or
capillary electrophoresis performance.
5.
Centrifuge plate briefly to remove air bubbles from the wells.
6.
Denature samples at 95°C for 3 minutes, then immediately chill on crushed ice or in an ice-water bath for
3 minutes. Denature samples just prior to loading the instrument.
Instrument Preparation
Refer to the ABI PRISM® 3100 Genetic Analyzer User’s Manual for instructions on cleaning the blocks, installing the
capillary array, performing a spatial calibration and adding polymer to the reserve syringe.
1.
Open the ABI PRISM® 3100 Data Collection Software.
2.
Change the “GeneScan36_POP4DefaultModule” module run time to 1,200 seconds.
3.
Change the injection voltage to 3kV.
12
Promega Corporation · 2800 Woods Hollow Road · Madison, WI 53711-5399 USA · Toll Free in USA 800-356-9526 · 608-274-4330 · Fax 608-277-2516
TMD021 · Revised 11/15
www.promega.com
4.
Change the injection time to 11 seconds.
Note: Instrument sensitivities can vary. The injection time and voltage may be adjusted in the Module Manager.
A suggested range for the injection time is 3–22 seconds and for the injection voltage is 1–3kV.
5.
Save the module with a new name (e.g., GeneScan36_POP4PowerPlexS5_3kV_11secs_1200). Use this as the
initial run module for all runs.
6.
Open a new plate record. Name the plate, and select “GeneScan”. Select the plate size (96-well). Select “Finish”.
7.
Complete the plate record spreadsheet for the wells you have loaded. Enter appropriate information into the
Sample Name and Color Info columns. For allelic ladder samples, insert the word “ladder” into the Color Info
column for the blue and green dye colors. This information must be entered to successfully analyze data with the
PowerTyper™ S5 Macro.
8.
In the BioLIMS Project column, select “3100_Project1” from the drop-down menu.
9.
In the Dye Set column, select “Z” from the drop-down menu.
10. When using the ABI PRISM® 3100 Data Collection Software, Version 1.0.1 or 1.1, select
“GeneScan36_POP4PowerPlexS5_3kV_11secs_1200” from the drop-down menu in the Run Module 1 column.
11. To collect the data without autoanalyzing, select “No Selection” in the Analysis Module 1 column. Analysis
parameters can be applied after data collection and during data analysis using the GeneScan® analysis software.
12. Select “OK”. This new plate record will appear in the pending plate records table on the plate setup page of the
collection software.
13. Place samples in the instrument, and close the instrument doors.
14. Locate the pending plate record that you just created, and click once on the name.
15. Once the pending plate record is highlighted, click on the plate graphic that corresponds to the plate on the
autosampler that contains your amplified samples to link the plate to the plate record.
16. When the plate record is linked to the plate, the plate graphic will change from yellow to green, the plate record
moves from the pending plate records table to the linked plate records table, and the Run Instrument button
becomes enabled.
17. Select the Run Instrument button on the toolbar to start the sample run.
18. Monitor electrophoresis by observing the run, status, array and capillary views windows in the collection
software. Each injection will take approximately 35 minutes.
Promega Corporation · 2800 Woods Hollow Road · Madison, WI 53711-5399 USA · Toll Free in USA 800-356-9526 · 608-274-4330 · Fax 608-277-2516
www.promega.com TMD021 · Revised 11/15
13
5.C. Detection of Amplified Fragments Using the ABI PRISM® 310 Genetic Analyzer
Materials to Be Supplied by the User
•
95°C dry heating block, water bath or thermal cycler
•
310 capillaries, 47cm × 50µm
•
performance optimized polymer 4 (POP-4®) for the 310
•
10X genetic analyzer buffer with EDTA
•
sample tubes and septa
•
aerosol-resistant pipette tips
•
Hi-Di™ formamide (Applied Biosystems Cat.# 4311320)
•PowerPlex® Matrix Standards, 310 (Cat.# DG4640)
•
crushed ice or ice-water bath
!
The quality of formamide is critical. Use Hi-Di™ formamide. Freeze formamide in aliquots at –20°C. Multiple
freeze-thaw cycles or long-term storage at 4°C may cause breakdown of formamide. Poor-quality formamide may
contain ions that compete with DNA during injection, which results in lower peak heights and reduced sensitivity.
A longer injection time may not increase the signal.
!
Formamide is an irritant and a teratogen; avoid inhalation and contact with skin. Read the warning label and take
appropriate precautions when handling this substance. Always wear gloves and safety glasses when working with
formamide.
Sample Preparation
1.
Prepare a loading cocktail by combining Internal Lane Standard 600 and Hi-Di™ formamide as follows:
[(1.0µl ILS 600) × (# injections)] + [(24.0µl Hi-Di™ formamide) × (# injections)]
Note: The volume of internal lane standard used in the loading cocktail can be increased or decreased to adjust
the intensity of size standard peaks. If peak heights are too high, we recommend altering the formamide/internal
lane standard mix to contain 0.5µl of ILS 600 and 24.5µl of Hi-Di™ formamide.
2.
Vortex for 10–15 seconds to mix.
3.
Combine 25.0µl of prepared loading cocktail with 1.0µl of amplified sample or 1.0µl of PowerPlex® S5 Allelic
Ladder Mix.
Notes:
4.
14
1.
Instrument detection limits vary; therefore, injection time, injection voltage or the amount of product
mixed with loading cocktail may need to be adjusted.
2.
A precipitate may form during amplification. This precipitate does not affect downstream analysis or
capillary electrophoresis performance.
Denature samples and ladder by heating at 95°C for 3 minutes, and immediately chill on crushed ice or in an
ice-water bath for 3 minutes. Denature samples just prior to loading.
Promega Corporation · 2800 Woods Hollow Road · Madison, WI 53711-5399 USA · Toll Free in USA 800-356-9526 · 608-274-4330 · Fax 608-277-2516
TMD021 · Revised 11/15
www.promega.com
5.
Place the tubes in the appropriate autosampler tray.
6.
Place the autosampler tray in the instrument, and close the instrument doors.
Instrument Preparation
Refer to the ABI PRISM® 310 Genetic Analyzer User’s Manual for instructions on cleaning the pump block, installing
the capillary, calibrating the autosampler and adding polymer to the syringe.
1.
Open the ABI PRISM® 310 Data Collection Software.
2.
Prepare a GeneScan® sample sheet as described in the ABI PRISM® 310 Genetic Analyzer User’s Manual. Enter
the appropriate sample information in the Sample Info column.
For rows containing PowerPlex® S5 Allelic Ladder Mix, insert the word “ladder” in the Sample Info column for
the blue dye color and green dye color. This information must be entered to successfully analyze your data using
the PowerTyper™ S5 Macro.
3.
Create a new GeneScan® injection list. Select the appropriate sample sheet by using the drop-down menu.
4.
Select the “GS STR POP4 (1ml) F” Module using the drop-down menu. Change the injection time to the
appropriate setting and the run time to 23 minutes. Keep the settings for the remaining parameters as shown
below:
Inj. Secs:
Inj. kV:
Run kV:
Run °C:
Run Time:
2–5
15.0
15.0
60
23
You may need to optimize the injection time for individual instruments. We recommend injection times of
2–5 seconds.
!
Note: Migration of fragments may vary slightly over the course of a long ABI PRISM® 310 Genetic Analyzer run.
This may be due to changes in temperature or changes in the column. When analyzing many samples, injections
of allelic ladder at different times throughout the run can aid in accurately genotyping samples.
5.
Select the appropriate matrix file (Section 3.B).
6.
To analyze data automatically, select the auto analyze checkbox and the appropriate analysis parameters and
size standard. Refer to the ABI PRISM® 310 Genetic Analyzer User’s Manual for specific information on these
options.
7.
After loading the sample tray and closing the doors, select “Run” to start the capillary electrophoresis (CE)
system.
8.
Monitor electrophoresis by observing the raw data and status windows. Each sample will take approximately
35 minutes for syringe pumping, sample injection and sample electrophoresis.
Promega Corporation · 2800 Woods Hollow Road · Madison, WI 53711-5399 USA · Toll Free in USA 800-356-9526 · 608-274-4330 · Fax 608-277-2516
www.promega.com TMD021 · Revised 11/15
15
6.
Data Analysis
6.A.PowerPlex® Panels and Bins Text Files with GeneMapper® ID, Version 3.2
To facilitate analysis of data generated with the PowerPlex® S5 System, we have created panels and bins text files to
allow automatic assignment of genotypes using GeneMapper® ID software, version 3.2. We recommend that users
of GeneMapper® ID software, version 3.2, complete the Applied Biosystems GeneMapper® ID Software Human
Identification Analysis Tutorial to familiarize themselves with the proper operation of the software. For
GeneMapper® ID software, version 3.1, users we recommend upgrading to version 3.2.
Getting Started
1.
To obtain the proper panels, bins and stutter text files for the PowerPlex® S5 System, go to:
www.promega.com/resources/tools/genemapper-id-software-panels-and-bin-sets/
2.
Select the PowerPlex® System that you use, select “GeneMapper ID” and select the control DNA that you use.
3.
Enter your contact information.
4.
Select “Submit”.
Importing Panels and Bins Text Files
These instructions loosely follow the Applied Biosystems GeneMapper® ID software tutorial, pages 1–4.
1.
Open the GeneMapper® ID software, version 3.2.
2.
Select “Tools”, then “Panel Manager”.
3.
Highlight the Panel Manager icon in the upper left tile (navigation pane).
4.
Select “File”, then “Import Panels”.
5.
Navigate to the saved panels and bins text files. Select “PowerPlex_S5_Panels_ID3.2x.txt”.
6.
In the navigation pane, highlight the PowerPlex_S5_Panels folder that you just imported.
7.
Select “File”, then “Import Bin Set”.
8.
Navigate to the saved panels and bins text files. Select “PowerPlex_S5_Bins_ID3.2x.txt”, then “Import”.
9.
At the bottom of the Panel Manager window, select “OK”. The Panel Manager window will close automatically.
6.B. Creating an Analysis Method with GeneMapper® ID Software
These instructions loosely follow the Applied Biosystems GeneMapper® ID software tutorial, pages 1–11.
1.
Select “Tools”, then “GeneMapper Manager”.
2.
Select the Analysis Methods tab.
3.
Select “New”, and a new analysis method dialog box will open.
4.
Select “HID”, and select “OK”.
Note: If you do not see the HID option, you do not have the GeneMapper® ID software. Contact
Applied Biosystems.
16
Promega Corporation · 2800 Woods Hollow Road · Madison, WI 53711-5399 USA · Toll Free in USA 800-356-9526 · 608-274-4330 · Fax 608-277-2516
TMD021 · Revised 11/15
www.promega.com
Enter a descriptive name for the analysis method, such as “PowerPlexS5 advanced”.
6.
Select the Allele tab (Figure 2).
7.
Select the bins text files corresponding to the PowerPlex® System “PowerPlex_S5_Bin_ID3.2x”.
8.
Ensure that the “Use marker-specific stutter ratio if available” box is checked.
9.
Enter the values shown in Figure 2 for proper filtering of stutter peaks when using the PowerPlex® Systems. For
an explanation of the proper usage and effects of these settings, refer to the Applied Biosystems user bulletin
titled “Installation Procedures and New Features for GeneMapper ID Software 3.2” and the “GeneMapper® ID
Software Version 3.1 Human Identification Analysis User Guide.
Note: Some of these settings have been optimized and are different from the recommended settings in the user
bulletin.
7482TA
5.
Figure 2. The Allele tab. Select the bins text file “PowerPlex_S5_Bins_ID3.2x”, where “X” refers to the most recent
version of the bins text file.
Promega Corporation · 2800 Woods Hollow Road · Madison, WI 53711-5399 USA · Toll Free in USA 800-356-9526 · 608-274-4330 · Fax 608-277-2516
www.promega.com TMD021 · Revised 11/15
17
6.B. Creating an Analysis Method with GeneMapper® ID Software (continued)
10. Select the Peak Detector tab. We recommend the settings shown in Figure 3.
Note: Select full range or partial range for the analysis range. When using a partial range, choose an appropriate analysis range based on your data. Choose a start point after the primer peak and just before the first defined
internal lane standard peak to help ensure proper sizing of the internal lane standard.
11. Select the Peak Quality tab. You may change the settings for peak quality.
Note: For Steps 11 and 12, see the GeneMapper® ID user’s manual for more information.
12. Select the Quality Flags tab. You may change these settings.
7483TA
13. Select “OK” to save your settings.
Figure 3. The Peak Detector tab.
18
Promega Corporation · 2800 Woods Hollow Road · Madison, WI 53711-5399 USA · Toll Free in USA 800-356-9526 · 608-274-4330 · Fax 608-277-2516
TMD021 · Revised 11/15
www.promega.com
Creating a Size Standard
Select “Tools”, then “GeneMapper Manager”.
2.
Select the Size Standard tab.
3.
Select “New”.
4.
Select “Basic or Advanced” (Figure 4). The type of analysis method selected must match the type of analysis
method created earlier. Select “OK”.
5725TA
1.
Figure 4. The Select Dye and Analysis Method window.
Promega Corporation · 2800 Woods Hollow Road · Madison, WI 53711-5399 USA · Toll Free in USA 800-356-9526 · 608-274-4330 · Fax 608-277-2516
www.promega.com TMD021 · Revised 11/15
19
6.B. Creating an Analysis Method with GeneMapper® ID Software (continued)
Enter a detailed name such as “60–350 ILS Adv” in the Size Standard Editor (Figure 5).
7484TA
5.
Figure 5. The Size Standard Editor.
6.
Choose”Red” for the Size Standard Dye.
7.
Enter sizes for the 60–350bp internal lane standard fragments (Section 9.C, Figure 11).
Note: With the run times recommended in this manual, not all ILS 600 fragments will be detected. Label all
fragments present. For accurate sizing, the 350bp fragment must be detected. If present, larger fragments also
may be labeled.
8.
Select “OK”.
20
Promega Corporation · 2800 Woods Hollow Road · Madison, WI 53711-5399 USA · Toll Free in USA 800-356-9526 · 608-274-4330 · Fax 608-277-2516
TMD021 · Revised 11/15
www.promega.com
Processing Sample Data
1.
Import sample files into a new project as described in the Applied Biosystems GeneMapper® ID Software
Human Identification Analysis Tutorial.
2.
In the Sample Type column, use the drop-down menu to select “Ladder”, “Sample”, “Positive Control” or
“Negative Control”. Every folder in the project must contain at least one ladder that is designated as such for
proper genotyping.
3.
In the Analysis Method column, select the analysis method created earlier.
4.
In the Panel column, select “PowerPlex_S5_Panels”. This is the panels text file that was imported in Section 6.A.
5.
In the Size Standard column, select the size standard that was created in Creating a Size Standard section.
6.
If analyzing data from an ABI PRISM® 310 Genetic Analyzer, ensure that the appropriate matrix file is selected
in the Matrix column.
7.
Select “Analyze” (green arrow button) to start data analysis.
6.C. Sample Analysis Using the GeneScan® Software and Windows® Operating Systems
1.
Analyze data using the GeneScan® analysis software.
2.
Review the raw data for one or more sample runs. Highlight the sample file name, then in the Sample menu,
select “raw data”. Move the cursor so that the crosshair is on the baseline to the right of the large primer peak
(before the first internal lane standard peak [red]). Use the X-value number shown at the bottom left of the
window for the start position in the analysis parameters.
Promega Corporation · 2800 Woods Hollow Road · Madison, WI 53711-5399 USA · Toll Free in USA 800-356-9526 · 608-274-4330 · Fax 608-277-2516
www.promega.com TMD021 · Revised 11/15
21
6.C. Sample Analysis Using the GeneScan® Software and Windows® Operating Systems (continued)
The recommended analysis parameters are shown in Figure 6.
7329TA
3.
Figure 6. The analysis parameters window. The start point of the analysis range, which will vary, is defined in
Section 6.C or 6.D, Step 2.
4.
The analysis parameters can be saved in the Params folder; in most installations this is located at:
C:\AppliedBio\Shared\Analysis\Sizecaller\Params\
5.
Apply the stored Analysis Parameters file to the samples.
6.
Assign a new size standard. Select a sample file, and highlight the arrow next to size standard. Select “define
new”. Assign the size standard peaks as shown in Figure 11 in Section 9.C. Store the size standard in the Size
Standards folder at: C:\AppliedBio\Shared\Analysis\Sizecaller\SizeStandards\
Note: With the run times recommended in this manual, not all ILS 600 fragments will be detected. Label all
fragments present. For accurate sizing, the 350bp fragment must be detected. If present, larger fragments may
be labeled also.
22
Promega Corporation · 2800 Woods Hollow Road · Madison, WI 53711-5399 USA · Toll Free in USA 800-356-9526 · 608-274-4330 · Fax 608-277-2516
TMD021 · Revised 11/15
www.promega.com
7.
Apply the size standard file to the samples, then analyze the sample files. See Section 6.E for additional
information on the use of the PowerTyper™ S5 Macro and Genotyper® software.
For additional information regarding the GeneScan® analysis software, refer to the GeneScan® Analysis
Software User’s Manual.
6.D. Sample Analysis Using the GeneScan® Software and Macintosh® Operating Systems
1.
Analyze data using the GeneScan® analysis software.
2.
Review the raw data for one or more sample runs. Highlight the sample file name, then in the Sample menu,
select “raw data”. Move the cursor so that the crosshair is on the baseline to the right of the large primer peak
(before the first internal lane standard peak [red]). Use the X-value number shown at the bottom left of the
window for the start position in the analysis parameters.
3.
The recommended analysis parameters are:
Analysis Range
Start: Defined in Step 2
Stop: 10,000
Data Processing
Baseline: Checked
Multicomponent: Checked
Smooth Options: Light1
Peak Detection
Peak Amplitude Thresholds2:
B:
Y:
G:
R:
Min. Peak Half Width: 2pts
Size Call Range
Min: 60
Max: 350
Size Calling Method
Local Southern Method
Split Peak Correction
None
Smooth options should be determined by individual laboratories.
1
The peak amplitude thresholds are the minimum peak heights at which the software will call a peak. Values for the peak
amplitude thresholds are usually 50–200RFU and should be determined by individual laboratories.
2
Promega Corporation · 2800 Woods Hollow Road · Madison, WI 53711-5399 USA · Toll Free in USA 800-356-9526 · 608-274-4330 · Fax 608-277-2516
www.promega.com TMD021 · Revised 11/15
23
6.D. Sample Analysis Using the GeneScan® Software and Macintosh® Operating Systems (continued)
4.
The analysis parameters can be saved in the Params folder.
5.
Apply the stored analysis parameters file to the samples.
6.
Assign a new size standard. Select a sample file, highlight the arrow next to size standard, then select “define
new”. Assign the size standard peaks as shown in Figure 11 in Section 9.C. Store the size standard in the Size
Standards folder.
Note: With the run times recommended in this manual, not all ILS 600 fragments will be detected. Label all
fragments present. For accurate sizing, the 350bp fragment must be detected. If present, larger fragments may
be labeled also.
7.
Apply the size standard file to the samples, then analyze the sample files. See Section 6.E for additional
information on the use of the PowerTyper™ S5 Macro and Genotyper® software.
For additional information regarding the GeneScan® analysis software, refer to the GeneScan® Analysis
Software User’s Manual.
6.E. Sample Analysis Using the Genotyper® Software and PowerTyper™ S5 Macro
To facilitate analysis of data generated with the PowerPlex® S5 System, we have created a file to allow automatic
assignment of genotypes using the Genotyper® software. After samples are amplified, detected using the ABI PRISM®
310 or 3100 Genetic Analyzer (using Data Collection Software, Version 1.0.1 or 1.1) and analyzed using GeneScan®
analysis software, sample files can be imported into the Genotyper® program and analyzed using the PowerTyper™ S5
Macro.
The PowerTyper™ S5 Macro can be downloaded from the Promega web site at:
www.promega.com/resources/tools/powertyper-macros/
The PowerTyper™ S5 Macro is used in conjunction with Macintosh® Genotyper® software, version 2.5, and
Windows NT® Genotyper® software, version 3.6, or later. The Genotyper® software must be installed on your
computer before the PowerTyper™ S5 Macro can be used.
Be certain the Sample Info (Macintosh® computers) or Color Info (Windows NT® operating systems) column for each
lane containing allelic ladder mix contains the word “ladder”. The macro uses the word “ladder” to identify the sample
file(s) containing allelic ladder. Sample info can be added or modified after importing into the PowerTyper™ Macro.
Highlight the sample, then select “show dye/lanes window” in the Views menu.
1.
Download the PowerTyper™ S5 Macro from the Promega web site.
2.
Open the Genotyper® software, then the PowerTyper™ S5 Macro. For questions about the Genotyper® software,
refer to the Genotyper® Analysis Software User’s Manual.
3.
In the File menu, select “Import”, and import the GeneScan® project or sample files to be analyzed. Import the
blue, green and red dye colors.
Note: To select the dye colors to be imported, select “Set Preferences” in the Edit menu.
24
Promega Corporation · 2800 Woods Hollow Road · Madison, WI 53711-5399 USA · Toll Free in USA 800-356-9526 · 608-274-4330 · Fax 608-277-2516
TMD021 · Revised 11/15
www.promega.com
4.
Double-click on the Check ILS macro. The macros are listed at the bottom left corner of the active window. A
plots window will be displayed to show the internal lane standard (i.e., ILS 600) in the red dye color. Scroll down
to view and confirm that internal lane standard fragment sizes are correct. If necessary, redefine internal lane
standard fragments and re-analyze samples using the GeneScan® software.
Note: The software uses one ladder sample to determine allele sizes. The macro uses the first ladder sample
imported for allele designations.
5.
Double-click on the POWER macro. The POWER macro identifies alleles in the ladder sample and calculates
offsets for all loci. This process may take several minutes. When completed, a plots window will open to display
the allelic ladders (i.e., D8S1179, D18S51, Amelogenin, etc.).
In general, allelic ladders contain fragments of the same lengths as many known alleles for the locus. Allelic
ladder sizes and repeat units are listed in Table 3 (Section 9.A). Analysis using GeneScan® analysis software and
Genotyper® software allows allele determination by comparing amplified sample fragments with allelic ladders
and internal lane standards. When using an internal lane standard, the calculated lengths of allelic ladder
components may differ from those listed in the table. This is due to differences in migration resulting from
sequence differences between allelic ladder fragments and internal size standard fragments and is not a matter
of concern.
6.
Double-click on the Allelic Ladders macro. A plots window will open to display the blue (fluorescein) dye allelic
ladders (i.e., Amelogenin, D18S51 and D8S1179) and the green (JOE) dye allelic ladders (i.e., TH01). Confirm
that the correct allele designations were assigned to the allelic ladders (Figure 8 in Section 6.G).
Note: The software uses one ladder sample to determine allele sizes. The macro uses the first ladder sample
imported for allele designations. If the POWER macro is run a second time, the software will use the second
ladder; if the POWER macro is run a third time, the software will use the third ladder, etc., until all ladders in
the project are used. If an allelic ladder fails to be analyzed or if many off-ladder alleles are found in the samples,
the samples should be re-analyzed using another ladder from the project.
7.
Double-click on the Display Fluorescein Data macro to display the blue dye for all sample injections. Scroll down
to observe and edit as needed.
8.
Double-click on the Display JOE Data macro to display the green dye for all sample injections. Scroll down to
observe and edit as needed.
9.
Create the appropriate table by selecting the PowerTable, Make Allele Table or Make Vertical Table macro. The
three available table formats are shown below. The PowerTable option allows up to four alleles per sample file.
Additional information such as low peak signal or high peak signal is also included. The Allele Table and Vertical
Table options include only two alleles per locus. If more than two alleles are present at a locus, the smallest
alleles identified are included. The Allele Table format displays the categories (loci) in columns, while the
Vertical table format displays the categories in rows. These tables can be customized to fit needs. To save data in
tables, go to the Table drop-down menu, highlight “Export to File...” and save the file with the desired name and
location. The saved file can be viewed and analyzed using Microsoft Excel®.
Promega Corporation · 2800 Woods Hollow Road · Madison, WI 53711-5399 USA · Toll Free in USA 800-356-9526 · 608-274-4330 · Fax 608-277-2516
www.promega.com TMD021 · Revised 11/15
25
6.E. Sample Analysis Using the Genotyper® Software and PowerTyper™ S5 Macro (continued)
PowerTable Format
Sample
Info
Sample
Comment
Category
Peak 1
Peak 2
Peak 3
Peak 4
Overflow
Low
Signal
Saturation
Edited
Label
Edited
Row
Allele Table Format
Category
Allele 1
Sample Info
Category
Allele 2
Category
Allele 1
Peak 1
Peak 2
Category
Allele 2
Category
Allele 1
Category
Allele 2
Category
Allele 1
Category
Allele 2
Vertical Table Format
Sample Info
Category
10. Save the analyzed data. Go to the File menu, and select “Save as”.
!
The PowerTyper™ Macro is a Genotyper® file and can be overwritten if “Save” is used instead of “Save as”.
6.F.Controls
1.
Observe the results for the negative control. Using the protocols defined in this manual, the negative control
should be devoid of amplification products.
2.
Observe the results for the 2800M Control DNA. Compare the 2800M DNA allelic repeat sizes with the
locus-specific allelic ladder. The expected 2800M DNA allele designations for each locus are listed in Table 4
(Section 9.A).
6.G.Results
Representative results of the PowerPlex® S5 System are shown in Figure 7. The PowerPlex® S5 Allelic Ladder Mix is
shown in Figure 8.
26
Promega Corporation · 2800 Woods Hollow Road · Madison, WI 53711-5399 USA · Toll Free in USA 800-356-9526 · 608-274-4330 · Fax 608-277-2516
TMD021 · Revised 11/15
www.promega.com
A.
B.
7612TA
C.
Figure 7. The PowerPlex® S5 System. A single-source DNA template (250pg) was amplified using the PowerPlex® S5
System. The amplification products were detected using an Applied Biosystems 3130xl Genetic Analyzer and a 3kv,
5-second injection. The results were analyzed using GeneMapper® ID software, version 3.2. Panel A. An electropherogram showing the peaks of the fluorescein-labeled loci: Amelogenin, D18S51 and D8S1179. Panel B. An
electropherogram showing the peaks of the JOE-labeled loci: TH01 and FGA. Panel C. An electropherogram showing
the 80bp to 300bp fragments of the Internal Lane Standard 600.
A.
7613TA
B.
Figure 8. The PowerPlex® S5 Allelic Ladder Mix. The PowerPlex® S5 Allelic Ladder Mix was analyzed using
an Applied Biosystems 3130xl Genetic Analyzer and a 3kv, 5-second injection. The results were analyzed with the
GeneMapper® ID software, version 3.2. Panel A. The fluorescein-labeled allelic ladder components. Panel B. The
JOE-labeled allelic ladder components.
Promega Corporation · 2800 Woods Hollow Road · Madison, WI 53711-5399 USA · Toll Free in USA 800-356-9526 · 608-274-4330 · Fax 608-277-2516
www.promega.com TMD021 · Revised 11/15
27
6.G. Results (continued)
Artifacts and Stutter
Stutter products are a common amplification artifact associated with STR analysis. Stutter products are often observed
one repeat unit below the true allele peak and, occasionally, two repeat units smaller or one repeat unit larger than the
true allele peak. Frequently, alleles with a greater number of repeat units will exhibit a higher percent stutter. The
pattern and intensity of stutter may differ slightly between primer sets for the same loci.
In addition to stutter peaks, other artifact peaks can be observed at some of the PowerPlex® S5 System loci. Low-level
products can be seen in the n–2 and n+2 positions (two bases below and above the true allele peak, respectively) with
some loci, such as D18S51.
One or more extra peaks that are not directly related to amplification may be observed at positions 11 bases smaller
than TH01 alleles, 1 base smaller than FGA alleles and 1 or 8 bases smaller than Amelogenin alleles. These extra peaks
occur when the amplified peaks are particularly intense (high signal level or template amount); the formamide, polymer
or capillary was of poor quality; or denaturation was ineffective. One or more extra peaks that are not directly related to
amplification may be observed at 73bp in the fluorescein channel and at 72–76bp in the JOE channel. See Section 7 for
more information about how to minimize these artifacts.
Stutter filters can be modified in the PowerPlex® panels and bins text files for the GeneMapper® ID software, version
3.2, or the PowerTyper™ Macro if desired. Contact Promega Technical Services ([email protected]) for
assistance with modifications.
Notes:
1.
Peak heights outside the linear range of the instrument may generate artifact peaks due to instrument saturation
(i.e., overloading the sample). Bleedthrough (pull-ups) from one color to another may be observed. Saturated
signal also may appear as two peaks (split peak).
2.
If peak heights are not within the linear range of detection of the instrument, the ratio of stutter peaks to real
allele peaks increases, and allele designations become difficult to interpret. The balance of peak heights also
may appear less uniform.
28
Promega Corporation · 2800 Woods Hollow Road · Madison, WI 53711-5399 USA · Toll Free in USA 800-356-9526 · 608-274-4330 · Fax 608-277-2516
TMD021 · Revised 11/15
www.promega.com
7.Troubleshooting
For questions not addressed here, please contact your local Promega Branch Office or Distributor. Contact information
available at: www.promega.com. E-mail: [email protected]
7.A. Amplification and Fragment Detection
Symptoms
Causes and Comments
Faint or absent allele peaksImpure template DNA. Because of the small amount of template
used, this is rarely a problem. Depending on the DNA extraction
procedure used and sample source, inhibitors may be present in
the DNA sample.
Insufficient template. Use the recommended amount of template
DNA, increase injection time or voltage, increase cycle number
or increase the volume of amplified sample during sample
preparation.
Insufficient enzyme activity. Use the recommended amount of
PowerPlex® S5 5X Master Mix, and vortex the 5X Master Mix
prior to use.
Incorrect amplification program. Confirm the amplification
program.
PCR amplification mix was not mixed thoroughly. Vortex mix for
5–10 seconds before dispensing into reaction tubes or plate.
An air bubble formed at the bottom of the well. Use a pipette to
remove the air bubble, or centrifuge briefly prior to thermal
cycling. Centrifuge samples prior to injection on the CE
instrument.
High salt concentration or altered pH. If the DNA template is
stored in TE buffer that is not pH 8.0 or contains a higher EDTA
concentration, the DNA volume should not exceed 20% of the
total reaction volume. Carryover of K+, Na+, Mg2+ or EDTA from
the DNA sample can negatively affect PCR. A change in pH also
may affect PCR. Store DNA in TE–4 buffer (10mM Tris-HCl
[pH 8.0], 0.1mM EDTA) or nuclease-free water.
Thermal cycler, plate or tube problems. Review the thermal
cycling protocols in Section 4.B. We have not tested other
reaction tubes, plates or thermal cyclers. Calibrate the thermal
cycler heating block, if necessary.
Primer concentration was too low. Use the recommended primer
concentration. Vortex the PowerPlex® S5 10X Primer Pair for
15 seconds to mix before use.
Promega Corporation · 2800 Woods Hollow Road · Madison, WI 53711-5399 USA · Toll Free in USA 800-356-9526 · 608-274-4330 · Fax 608-277-2516
www.promega.com TMD021 · Revised 11/15
29
7.A. Amplification and Fragment Detection (continued)
Symptoms
Causes and Comments
Faint or absent allele peaks (continued)Samples were not completely denatured. Heat-denature samples
for the recommended time, and cool on crushed ice or in an
ice-water bath immediately prior to capillary electrophoresis.
Do not cool the samples in a thermal cycler set at 4°C, as this
may lead to artifacts due to DNA re-annealing.
Poor CE injection (ILS 600 peaks also affected). Re-inject the
sample. Check the syringe for leakage.Check the laser power.
Poor-quality formamide was used. Use only Hi-Di™ formamide
when analyzing samples.
Extra peaks visible in one or all of the color Contamination with another template DNA or previously
channels amplified DNA. Cross-contamination can be a problem. Use
aerosol-resistant pipette tips, and change gloves regularly.
Samples were not completely denatured. Heat-denature samples
for the recommended time, and cool on crushed ice or in an
ice-water bath immediately prior to capillary electrophoresis.
Do not cool the samples in a thermal cycler set at 4°C, as this
may lead to artifacts due to DNA re-annealing.
Artifacts of STR amplification. Amplification of STRs can result
in artifacts that appear as peaks one base smaller than the allele
due to incomplete addition of the 3´ A residue. Perform the
45-minute extension step at 60°C after thermal cycling
(Section 4.B).
High background. Load less amplification product, or decrease
the injection time. See Section 5.
CE-related artifacts (“spikes”). Minor voltage changes or urea
crystals passing by the laser can cause “spikes” or unexpected
peaks. Spikes sometimes appear in one color but often are easily
identified by their presence in more than one color. Re-inject
samples to confirm.
CE-related artifacts (contaminants). Contaminants in the water
used with the instrument or to dilute the 10X genetic analyzer
buffer may generate peaks in the blue and green dye colors. Use
autoclaved water, change vials and wash buffer reservoir.
Excessive amount of DNA. Amplification of >1ng template can
result in a higher number of stutter bands and other artifacts.
30
Promega Corporation · 2800 Woods Hollow Road · Madison, WI 53711-5399 USA · Toll Free in USA 800-356-9526 · 608-274-4330 · Fax 608-277-2516
TMD021 · Revised 11/15
www.promega.com
Symptoms
Causes and Comments
Extra peaks visible in one or all of the color Pull-up or bleedthrough. Pull-up can occur when peak heights
channels (continued)are too high or if a poor or incorrect matrix has been applied to
the samples.
•For the ABI PRISM® 310 Genetic Analyzer, generate a new
matrix, and apply it to the samples.
For the ABI PRISM® 3100 and 3100-Avant and Applied
Biosystems 3130 and 3130xl Genetic Analyzers, perform a
new spectral calibration and re-run the samples.
•Instrument sensitivities can vary. Optimize the injection
conditions. See Section 5.
Long-term storage of amplified sample in formamide can result in
degradation. Repeat sample preparation using fresh formamide.
The CE polymer was beyond its expiration date, or polymer was stored at room temperature for more than one week.
Maintain instrumentation on a daily or weekly basis, as
recommended by the manufacturer.
PCR amplification mix was not mixed thoroughly. Vortex for
5–10 seconds before dispensing into reaction tubes or plate.
An air bubble formed at the bottom of the well. Use a pipette to
remove the air bubble, or centrifuge briefly prior to thermal
cycling. Centrifuge samples prior to injection on the CE
instrument.
Precipitate observed in samples after A precipitate may form as a result of thermal denaturation of the
amplificationprotein associated with hot start. This precipitate does not affect
downstream amplification or capillary performance.
Allelic ladder not running the same as the
Allelic ladder and primer pair mix were not compatible. Ensure
samplethat the allelic ladder is from the same system as the primer pair
mix.
Poor-quality formamide. Use only Hi-Di™ formamide when
analyzing samples.
Migration of samples changed slightly over the course of a CE run
with many samples. This may be due to changes in temperature
or the CE column over time. Use a different injection of allelic
ladder to determine sizes.
Promega Corporation · 2800 Woods Hollow Road · Madison, WI 53711-5399 USA · Toll Free in USA 800-356-9526 · 608-274-4330 · Fax 608-277-2516
www.promega.com TMD021 · Revised 11/15
31
7.A. Amplification and Fragment Detection (continued)
Symptoms
Causes and Comments
Peak height imbalanceInsufficient template DNA. Use the recommended amount of
template DNA. Stochastic effects can occur when amplifying low
amounts of template.
Miscellaneous balance problems. Thaw the 10X Primer Pair Mix
and 5X Master Mix completely, and vortex for 5–10 seconds
before use. Do not centrifuge the 10X Primer Pair Mix after
mixing. Calibrate thermal cyclers and pipettes routinely.
Impure template DNA. Inhibitors that may be present in
forensic samples can lead to allele dropout or imbalance.
PCR amplification mix was not mixed thoroughly. Vortex for
5–10 seconds before dispensing into the reaction tubes or plate.
7.B.GeneMapper® ID Analysis Software
5685TA
Symptoms
Causes and Comments
Alleles not calledTo analyze samples with GeneMapper® ID software, the analysis
parameters and size standard must both have “Basic or
Advanced” as the analysis type. If they are different, an error is
obtained (Figure 9).
Figure 9. The error message that appears in the GeneMapper® ID software when the analysis parameters
and size standard have different analysis types.
32
Promega Corporation · 2800 Woods Hollow Road · Madison, WI 53711-5399 USA · Toll Free in USA 800-356-9526 · 608-274-4330 · Fax 608-277-2516
TMD021 · Revised 11/15
www.promega.com
Symptoms
Causes and Comments
Alleles not called (continued)An insufficient number of ILS 600 fragments was defined. Be
sure to define at least one ILS 600 fragment smaller than the
smallest sample or allelic ladder peak and at least one ILS 600
fragment larger than the largest sample or allelic ladder peak.
Run was too short, and larger peaks in ILS were not captured.
Not all ILS 600 peaks defined in the size standard were detected
during the run.
•Create a new size standard using the internal lane standard
fragments present in the sample.
•Re-run samples using a longer run time.
Off-ladder allelesAn allelic ladder from a different run than the samples was used.
Re-analyze samples with an allelic ladder from the same run.
The GeneMapper® ID software requires that the allelic ladder be
imported from the same folder as the sample. Be sure that the
allelic ladder is in the same folder as the sample. Create a new
project and re-analyze, as described in Section 6.B or 6.C.
Panels text file selected for analysis was incorrect for the STR
system used. Assign correct panels file that corresponds to the
system used for amplification.
The allelic ladder was not identified as an allelic ladder in the
Sample Type column.
The wrong analysis type was chosen for the analysis method. Be
sure to use the HID analysis type.
The internal lane standard was not properly identified in the
sample. Manually redefine the sizes of the size standard
fragments in the sample.
Promega Corporation · 2800 Woods Hollow Road · Madison, WI 53711-5399 USA · Toll Free in USA 800-356-9526 · 608-274-4330 · Fax 608-277-2516
www.promega.com TMD021 · Revised 11/15
33
7.B.GeneMapper® ID Analysis Software (continued)
Symptoms
Causes and Comments
Size standard not called correctly (Figure 10)Starting data point was incorrect for the partial range chosen in
Section 6.B. Adjust the starting data point in the analysis
method. Alternatively, use a full range for the analysis.
Extra peaks in advanced mode size standard. Open the Size
Match Editor. Highlight the extra peak, select “Edit” and select
“delete size label”. Select “auto adjust sizes”.
Run was too short, and larger peaks in ILS were not captured.
Not all ILS 600 peaks defined in the size standard were detected
during the run.
•Create a new size standard using the internal lane standard
fragments present in the sample.
•Re-run samples using a longer run time.
5686TA
Figure 10. An example showing improper assignment of size standard fragments in the GeneMapper® ID
software.
34
Promega Corporation · 2800 Woods Hollow Road · Madison, WI 53711-5399 USA · Toll Free in USA 800-356-9526 · 608-274-4330 · Fax 608-277-2516
TMD021 · Revised 11/15
www.promega.com
Symptoms
Causes and Comments
Peaks in size standard missingIf peaks are below threshold, decrease the peak amplitude
threshold in the analysis method for the red channel to include
peaks.
If peaks are low-quality, redefine the size standard to skip these
peaks.
Error message:
The size standard and analysis method were not in the same
“Either panel, size standard,
mode (“Classic” vs. “Basic or Advanced”). Be sure both files
or analysis method is invalid”are set to the same mode, either Classic or Basic or Advanced
mode.
No alleles called, but no error message appearsPanels file was not selected for sample. In the Panel column,
select the appropriate panels text file for the STR system that
was used.
No size standard was selected. In the Size Standards column, be
sure to select the appropriate size standard.
Size standard was not correctly defined, or size peaks were
missing. Redefine size standard to include only peaks present in
your sample. Terminating analysis early or using short run times
will cause larger ladder peaks to be missing. This will cause your
sizing quality to be flagged as “red”, and no allele sizes will be
called.
Error message: “Both the Bin Set used in the Analysis Method
and the Panel must belong to the same
Chemistry Kit”.
The bins text file assigned to the analysis method may have been
deleted. In the GeneMapper® Manager, select the Analysis
Methods tab, and open the analysis method of interest. Select
the Alleles tab, and select an appropriate bins text file.
Significantly raised baseline
•Poor spectral calibration for the ABI PRISM® 3100 and
3100-Avant Genetic Analyzers and Applied Biosystems 3130
and 3130xl Genetic Analyzers. Perform a new spectral
calibration, and re-run the samples.
•Poor matrix for the ABI PRISM® 310 Genetic Analyzer.
Re-run and optimize the matrix.
Use of Classic mode analysis method. Use of Classic mode
analysis for samples can result in baselines with more noise than
those analyzed using the Basic or Advanced mode analysis
method. Advanced mode analysis methods and size standards
are recommended.
Promega Corporation · 2800 Woods Hollow Road · Madison, WI 53711-5399 USA · Toll Free in USA 800-356-9526 · 608-274-4330 · Fax 608-277-2516
www.promega.com TMD021 · Revised 11/15
35
7.B.GeneMapper® ID Analysis Software (continued)
Symptoms
Red bar appears during analysis of samples, and the following error message appears
when data are displayed: “Some selected
sample(s) do not contain analysis data. Those sample(s) will not be shown”.
Causes and Comments
If none of the samples had matrices applied when run on the
ABI PRISM® 310 Genetic Analyzer, no data will be displayed.
Apply a matrix file during analysis in the GeneMapper® ID
software and re-analyze.
Error message after attempting to import
panels and bins files: “Unable to save panel
data: java.SQLEException: ORA-00001: unique constraint (IFA.CKP_NNN) violated”.
There was a conflict between different sets of panels and bins
text files. Check to be sure that the bins are installed properly.
If not, delete all panels and bins text files, and re-import files
in a different order.
Allelic ladder peaks are labeled off-ladderGeneMapper® ID software was not used, or microsatellite
analysis settings were used instead of HID analysis settings.
GeneMapper® software does not use the same algorithms as
GeneMapper® ID software and cannot correct for sizing
differences using the allelic ladder. We recommend
GeneMapper® ID software for analysis of PowerPlex® reactions.
If using GeneMapper® ID software, version 3.2, be sure that the
analysis method selected is an HID method. This can be verified
by opening the analysis method using the GeneMapper®
Manager, then selecting the General tab. The analysis type
cannot be changed. If the method is not HID, it should be
deleted and a new analysis method created.
7.C. PowerTyper™ S5 Macro
Symptoms
Causes and Comments
File does not open on your computerGenotyper® software was not installed. Be certain that the
Genotyper® software, version 2.5 (Macintosh®) or version 3.6
or higher (Windows NT®), is installed.
Incorrect version of Genotyper® software. The PowerTyper™ S5
Macro will not work with Genotyper® software versions prior to
version 2.5.
The file was corrupted during download. Download the file
again.
36
Promega Corporation · 2800 Woods Hollow Road · Madison, WI 53711-5399 USA · Toll Free in USA 800-356-9526 · 608-274-4330 · Fax 608-277-2516
TMD021 · Revised 11/15
www.promega.com
Symptoms
Causes and Comments
Error message:
Allelic ladder sample files were not identified. Be certain the
“Could not complete the “Run Macro” Sample Info or Color Info column for each lane containing
command because no dye/lanes are selected”PowerPlex® S5 Allelic Ladder Mix contains the word “ladder”.
The macro uses the word “ladder” to identify sample files
containing allelic ladder.
All dye colors were not imported. For Genotyper® software,
versions 2.5 and 3.5 or higher, set preferences (in the Edit
menu) to import the blue, green and red colors.
Error message:
Peak heights for one or more of alleles in the allelic ladder
“Could not complete the “Run Macro” sample file were below 150RFU. The allelic ladder categories are
command because the labeled peak
defined as having a minimum peak height of 150RFU. If peak
could not be found”heights of ladder alleles are below 150RFU, the software will not
be able to locate the allele peak. Re-run the allelic ladder using
more sample or longer injection time to assure peak heights
above 150RFU.
CE spikes in the allelic ladder were identified as alleles by the
macro. Use a different injection of allelic ladder.
TH01 9.3 and 10 alleles were not separated when using heavy
smoothing in the GeneScan® analysis parameters. Use light
smoothing in the GeneScan® analysis parameters.
The base-pair size of alleles in the allelic ladder are outside of
the defined category range. Be sure the internal lane standard
fragments are correctly sized. Redefine the internal lane
standard fragments, and re-analyze the sample using GeneScan®
software. Compare the size of the smallest allele in the allelic
ladder with the base-pair size and range listed in the categories
for the same alleles. If necessary, increase the category start
range (in the category window) to greater than ±6bp, and save
the macro under a new name.
Allelic ladder peaks were too high, causing stutter peaks to be
called as allele peaks. Use a shorter injection time, decrease the
amount of allelic ladder used or re-analyze the allelic ladder
sample using increased peak amplitude thresholds in the
GeneScan® analysis parameters.
Allelic ladder data were not compatible with the PowerTyper™
file used. Confirm that the PowerTyper™ Macro file matches the
allelic ladder being used.
Promega Corporation · 2800 Woods Hollow Road · Madison, WI 53711-5399 USA · Toll Free in USA 800-356-9526 · 608-274-4330 · Fax 608-277-2516
www.promega.com TMD021 · Revised 11/15
37
7.C. PowerTyper™ S5 Macro (continued)
Symptoms
The plots window or allele table
does not display all data
Causes and Comments
The macros were not run in the proper order. Use the POWER
or POWER 20% Filter macro option.
All three dye colors were not imported. For Genotyper®
software, versions 2.5 and 3.5 or higher, set preferences
(in the Edit menu) to import the blue, green and red colors.
The Check ILS macro displays
All three dye colors were not imported. For Genotyper®
an empty plot windowsoftware, versions 2.5 and 3.5 or higher, set preferences
(in the Edit menu) to import the blue, green and red colors.
Off-ladder peaksMigration of samples changed slightly over the course of a CE run
with many samples. This may be due to changes in temperature
or the CE column over time. Use a different injection of allelic
ladder to determine sizes in the PowerTyper™ S5 Macro. Do not
use the first injection on a new column for the ladder sample.
The base-pair size of alleles was incorrect because incorrect
fragment sizes were assigned to the internal lane standard.
Confirm that internal lane standard fragments are assigned
correctly. Re-analyze sample using GeneScan® software, and
redefine internal lane standard fragments.
8.References
1.
Edwards, A. et al. (1991) DNA typing with trimeric and tetrameric tandem repeats: Polymorphic loci, detection
systems, and population genetics. In: The Second International Symposium on Human Identification 1991,
Promega Corporation, 31–52.
2.
Edwards, A. et al. (1991) DNA typing and genetic mapping with trimeric and tetrameric tandem repeats. Am. J.
Hum. Genet. 49, 746–56.
3.
Edwards, A. et al. (1992) Genetic variation at five trimeric and tetrameric tandem repeat loci in four human
population groups. Genomics 12, 241–53.
4.
Warne, D. et al. (1991) Tetranucleotide repeat polymorphism at the human β-actin related pseudogene 2
(actbp2) detected using the polymerase chain reaction. Nucleic Acids Res. 19, 6980.
5.
Ausubel, F.M. et al. (1993) Unit 15: The polymerase chain reaction. In: Current Protocols in Molecular Biology,
Vol. 2, Greene Publishing Associates Inc. and John Wiley and Sons, NY.
6.
Sambrook, J., Fritsch, E.F. and Maniatis, T. (1989) Chapter 14: In vitro amplification of DNA by the polymerase
chain reaction. In: Molecular Cloning: A Laboratory Manual, Second Edition, Cold Spring Harbor Laboratory
Press, Cold Spring Harbor, New York.
38
Promega Corporation · 2800 Woods Hollow Road · Madison, WI 53711-5399 USA · Toll Free in USA 800-356-9526 · 608-274-4330 · Fax 608-277-2516
TMD021 · Revised 11/15
www.promega.com
7.
PCR Technology: Principles and Applications for DNA Amplification (1989) Erlich, H.A., ed., Stockton Press,
New York, NY.
8.
PCR Protocols: A Guide to Methods and Applications (1990) Innis, M.A. et al., eds., Academic Press, San
Diego, CA.
9.
Presley, L.A. et al. (1992) The implementation of the polymerase chain reaction (PCR) HLA DQ alpha typing
by the FBI laboratory. In: The Third International Symposium on Human Identification 1992, Promega
Corporation, 245–69.
10. Hartmann, J.M. et al. (1991) Guidelines for a quality assurance program for DNA analysis. Crime Laboratory
Digest 18, 44–75.
11. Revised Validation Guidelines: Scientific Working Group on DNA Analysis Methods (SWGDAM) (2004)
Forensic Science Communications 6, retrieved 12/03/07 from the World Wide Web:
www.fbi.gov/hq/lab/fsc/backissu/july2004/standards/2004_03_standards02.htm
12. Moos, M. and Gallwitz, D. (1983) Structure of two human β-actin related processed genes, one of which is
located next to a simple repetitive sequence. EMBO J. 2, 757–61.
13. Polymeropoulos, M.H. et al. (1992) Tetranucleotide repeat polymorphism at the human β-actin related
pseudogene H-beta-Ac-psi-2 (ACTBP2). Nucleic Acids Res. 20, 1432.
14. Schneider, H.R. et al. (1998) ACTBP2-nomenclature recommendations of GEDNAP. Int. J. Leg. Med. 111,
97–100.
15. Department of Serology of the medical faculty at the Heinrich-Heine-University of Duesseldorf. SE33
population statistics. (www.uni-duesseldorf.de/WWW/MedFak/Serology/SE33b.htm).
16. Levedakou, E. et al. (2001) Allele frequencies for fourteen STR loci of the PowerPlex™ 1.1 and 2.1 Multiplex
Systems and Penta D locus in Caucasians, African-Americans, Hispanics and other populations of the United
States of America and Brazil. J. Forensic Sci. 46, 736–61.
17. Lins, A.M. et al. (1998) Development and population study of an eight-locus short tandem repeat (STR)
multiplex system. J. Forensic Sci. 43, 1168–80.
18. Puers, C. et al. (1993) Identification of repeat sequence heterogeneity at the polymorphic STR locus
HUMTH01[AATG]n and reassignment of alleles in population analysis using a locus-specific allelic ladder.
Am. J. Human Genet. 53, 953–8.
19. Hammond, H. et al. (1994) Evaluation of 13 short tandem repeat loci for use in personal identification
applications. Am. J. Hum. Genet. 55, 175–89.
20. Bever, R.A. and Creacy, S. (1995) Validation and utilization of commercially available STR multiplexes for
parentage analysis. In: Proceedings from the Fifth International Symposium on Human Identification 1994.
Promega Corporation, 61–8.
21. Sprecher, C.J. et al. (1996) A general approach to analysis of polymorphic short tandem repeat loci.
BioTechniques 20, 266–76.
Promega Corporation · 2800 Woods Hollow Road · Madison, WI 53711-5399 USA · Toll Free in USA 800-356-9526 · 608-274-4330 · Fax 608-277-2516
www.promega.com TMD021 · Revised 11/15
39
8.
References (continued)
22. Lins, A.M. et al. (1996) Multiplex sets for the amplification of polymorphic short tandem repeat loci—silver stain
and fluorescent detection. BioTechniques 20, 882–9.
23. Jones, D.A. (1972) Blood samples: Probability of discrimination. J. Forensic Sci. Soc. 12, 355–9.
24. Brenner, C. and Morris, J.W. (1990) In: Proceedings from the International Symposium on Human
Identification 1989, Promega Corporation, 21–53.
25. Griffiths, R. et al. (1998) New reference allelic ladders to improve allelic designation in a multiplex STR system.
Int. J. Legal Med. 111, 267–72.
26. Bär, W. et al. (1997) DNA recommendations: Further report of the DNA Commission of the ISFH regarding the
use of short tandem repeat systems. Int. J. Legal Med. 110, 175–6.
27. Gill, P. et al. (1997) Considerations from the European DNA Profiling Group (EDNAP) concerning STR
nomenclature. Forensic Sci. Int. 87, 185–92.
28. Frégeau, C.J. et al. (1995) Characterization of human lymphoid cell lines GM9947 and GM9948 as intra- and
interlaboratory reference standards for DNA typing. Genomics 28, 184–97.
29. Levinson, G. and Gutman, G.A. (1987) Slipped-strand mispairing: A major mechanism for DNA sequence
evolution. Mol. Biol. Evol. 4, 203–21.
30. Schlotterer, C. and Tautz, D. (1992) Slippage synthesis of simple sequence DNA. Nucleic Acids Res. 20, 211–5.
31. Smith, J.R. et al. (1995) Approach to genotyping errors caused by nontemplated nucleotide addition by Taq
DNA polymerase. Genome Res. 5, 312–7.
32. Magnuson, V.L. et al. (1996) Substrate nucleotide-determined non-templated addition of adenine by Taq DNA
polymerase: Implications for PCR-based genotyping. BioTechniques 21, 700–9.
33. Walsh, P.S., Fildes, N.J. and Reynolds, R. (1996) Sequence analysis and characterization of stutter products at
the tetranucleotide repeat locus vWA. Nucleic Acids Res. 24, 2807–12.
34. Moller, A., Meyer, E. and Brinkmann, B. (1994) Different types of structural variation in STRs: HumFES/FPS,
HumVWA and HumD21S11. Int. J. Leg. Med. 106, 319–23.
35. Brinkmann, B., Moller A. and Wiegand, P. (1995) Structure of new mutations in 2 STR systems. Int. J. Leg.
Med. 107, 201–3.
36. Mandrekar, P.V., Krenke, B.E. and Tereba, A. (2001) DNA IQ™: The intelligent way to purify DNA. Profiles in
DNA 4(3), 16.
37. Krenke, B.E. et al. (2005) Development of a novel fluorescent two-primer approach to quantitative PCR. Profiles
in DNA 8(1), 3–5.
Additional STR references can be found at: www.promega.com/geneticidentity/
40
Promega Corporation · 2800 Woods Hollow Road · Madison, WI 53711-5399 USA · Toll Free in USA 800-356-9526 · 608-274-4330 · Fax 608-277-2516
TMD021 · Revised 11/15
www.promega.com
9.Appendix
9.A. Advantages of Using the Loci in the PowerPlex® S5 System
The loci included in the PowerPlex® S5 System (Tables 2 and 3) were selected to include four of the current seven
ENFSI loci (12–24) and four of the current CODIS loci. Additionally, the Amelogenin locus is included in the
PowerPlex® S5 System to allow gender identification of each sample. Table 4 lists the PowerPlex® S5 System alleles
revealed in commonly available standard DNA templates.
Table 2. The PowerPlex® S5 System Locus-Specific Information.
Label
Chromosomal Location
GenBank® Locus and
Locus Definition
Repeat Sequence1
5´→ 3´
D8S1179
FL
8q24.13
NA
TCTA Complex (25)
D18S51
FL
18q21.3
HUMUT574
AGAA (25)
Amelogenin2
FL
Xp22.1–22.3 and Y
HUMAMEL, human Y
chromosomal gene for
Amelogenin-like protein
NA
FGA
JOE
4q28
HUMFIBRA, human
fibrinogen alpha chain gene
TTTC Complex (25)
TH01
JOE
11p15.5
HUMTH01, human
tyrosine hydroxylase gene
AATG (25)
STR Locus
1
The August 1997 report (26,27) of the DNA Commission of the International Society for Forensic Haemogenetics (ISFH) states,
“1) for STR loci within coding genes, the coding strand shall be used and the repeat sequence motif defined using the first possible
5´ nucleotide of a repeat motif; and 2) for STR loci not associated with a coding gene, the first database entry or original literature
description shall be used”.
Amelogenin is not an STR but displays a 103-base, X-specific band and a 109-base, Y-specific band.
FL = fluorescein
JOE = 6-carboxy-4´,5´-dichloro-2´,7´-dimethoxyfluorescein
2
Promega Corporation · 2800 Woods Hollow Road · Madison, WI 53711-5399 USA · Toll Free in USA 800-356-9526 · 608-274-4330 · Fax 608-277-2516
www.promega.com TMD021 · Revised 11/15
41
9.A. Advantages of Using the Loci in the PowerPlex® S5 System (continued)
Table 3. The PowerPlex® S5 System Allelic Ladder Information.
STR Locus
D8S1179
D18S51
Label
Size Range of
Allelic Ladder
Components1
(bases)
Repeat Numbers of Allelic Ladder Components
FL
208–252
7–18
FL
123–199
8–10, 10.2, 11–13, 13.2, 14–27
FL
103, 109
X, Y
FGA
JOE
148–270
16–18, 18.2, 19, 19.2, 20, 20.2, 21, 21.2, 22, 22.2, 23,
23.2, 24, 24.2, 25, 25.2, 26–30, 31.2, 43.2, 44.2, 45.2,
46.2
TH01
JOE
93–132
4–9, 9.3, 10–11, 13.3
Amelogenin
2
When using an internal lane standard, such as the Internal Lane Standard 600, the calculated sizes of allelic ladder components
may differ from those listed. This occurs because different sequences in allelic ladder and ILS components may cause differences in
migration. The dye label also affects migration of alleles.
1
Amelogenin is not an STR but displays a 103-base, X-specific band and a 109-base, Y-specific band.
2
Table 4. The PowerPlex® S5 System Allele Determinations in Commonly Available Standard DNA
Templates.
Standard DNA Templates1
STR Locus
K562
9947A
9948
2800M
D8S1179
12, 12
13, 13
12, 13
14, 15
D18S51
15, 16
15, 19
15, 18
16, 18
X, X
X, X
X, Y
X, Y
FGA
21, 24
23, 24
24, 26
20, 23
TH01
9.3, 9.3
8, 9.3
6, 9.3
6, 9.3
Amelogenin
Information on strains 9947A, 9948 and K562 is available online at: http://ccr.coriell.org. Strain K562 is available from the
American Type Culture Collection: www.atcc.org (Manassas, VA). Information about the use of 9947A and 9948 DNA as standard
DNA templates can be found in reference 28.
1
We have carefully selected primers to avoid or minimize artifacts, including those associated with Taq DNA polymerase,
such as repeat slippage and terminal nucleotide addition. Repeat slippage (29,30), sometimes called “n–4 bands”,
“stutter” or “shadow bands”, is due to the loss of a repeat unit during DNA amplification, somatic variation within the
DNA, or both. The amount of this artifact observed depends primarily on the locus and DNA sequence being amplified.
42
Promega Corporation · 2800 Woods Hollow Road · Madison, WI 53711-5399 USA · Toll Free in USA 800-356-9526 · 608-274-4330 · Fax 608-277-2516
TMD021 · Revised 11/15
www.promega.com
Terminal nucleotide addition (31,32) occurs when Taq DNA polymerase adds a nucleotide, generally adenine, to the
3´ ends of amplified DNA fragments in a template-independent manner. The efficiency with which this occurs varies
with different primer sequences. Thus, an artifact band one base shorter than expected (i.e., missing the terminal
addition) is sometimes seen. We have modified primer sequences and added a final extension step of 60°C for
45 minutes (33) to the amplification protocol to provide conditions for essentially full terminal nucleotide addition
when recommended amounts of DNA template are used.
The presence of microvariant alleles (alleles differing from one another by lengths other than the repeat length)
complicates interpretation and assignment of alleles. There appears to be a correlation between a high degree of
polymorphism, a tendency for microvariants and increased mutation rate (34,35). FGA and D18S51 display numerous,
relatively common microvariants.
9.B. DNA Extraction and Quantitation Methods and Automation Support
The DNA IQ™ System (Cat.# DC6700) is a DNA isolation system designed specifically for forensic and paternity
samples (36). This novel system uses paramagnetic particles to prepare clean samples for STR analysis easily and
efficiently and can be used to extract DNA from stains or liquid samples, such as blood or solutions. The DNA IQ™
Resin eliminates PCR inhibitors and contaminants frequently encountered in casework samples. With larger samples,
the DNA IQ™ System delivers a consistent amount of total DNA. The system has been used to isolate and quantify
DNA from routine sample types including buccal swabs, stains on FTA® paper and liquid blood. Additionally, DNA
has been isolated from casework samples such as tissue, differentially separated sexual assault samples and stains on
support materials. The DNA IQ™ System has been tested with the PowerPlex® Systems to ensure a streamlined
process. See Section 9.F for ordering information.
For applications requiring human-specific DNA quantification, the Plexor® HY System (Cat.# DC1001, DC1000) was
developed (37). See Section 9.F for ordering information.
For information about automation of Promega chemistries on automated workstations using Identity Automation™
solutions, contact your local Promega Branch Office or Distributor (contact information available at:
www.promega.com/support/worldwide-contacts/), e-mail: [email protected] or visit:
www.promega.com/idautomation/
Promega Corporation · 2800 Woods Hollow Road · Madison, WI 53711-5399 USA · Toll Free in USA 800-356-9526 · 608-274-4330 · Fax 608-277-2516
www.promega.com TMD021 · Revised 11/15
43
9.C. The Internal Lane Standard 600
10349TA
The Internal Lane Standard (ILS) 600 contains 22 DNA fragments of 60, 80, 100, 120, 140, 160, 180, 200, 225, 250,
275, 300, 325, 350, 375, 400, 425, 450, 475, 500, 550 and 600 bases in length (Figure 11). For PowerPlex® S5
analyses only ILS 600 fragments smaller than 350bp need to be detected. Each fragment is labeled with carboxy-Xrhodamine (CXR) and may be detected separately in the presence of PowerPlex® S5-amplified material. The ILS 600 is
designed for use in each CE injection to increase precision in analyses when using the PowerPlex® S5 System.
Figure 11. Internal Lane Standard 600. An electropherogram showing the Internal Lane Standard 600 fragments.
9.D. Preparing the PowerPlex® S5 System PCR Amplification Mix
A worksheet to calculate the required amount of each PCR amplification mix component is provided in Table 5.
Determine the number of reactions to be set up. This should include positive and negative control reactions.
Add 1 or 2 reactions to this number to compensate for pipetting error. Multiply the volume (µl) per reaction by
the total number of reactions to obtain the final PCR amplification mix volume (µl).
Table 5. PCR Amplification Mix for PowerPlex® S5 System Reactions.
PCR Amplification Mix
Component
Water, Amplification Grade1
Volume Per
Reaction
×
Number of
Reactions
=
µl
×
=
PowerPlex S5 5X Master Mix
5.0µl
×
=
PowerPlex S5 10X
Primer Pair Mix
2.5µl
×
=
up to 17.5µl
×
=
25µl
×
=
®
Final
Volume (µl)
®
Per tube
template DNA volume
(0.25–0.50ng)
total reaction volume
The total volume of PCR amplification mix volume and template DNA should be 25µl.
1
44
Promega Corporation · 2800 Woods Hollow Road · Madison, WI 53711-5399 USA · Toll Free in USA 800-356-9526 · 608-274-4330 · Fax 608-277-2516
TMD021 · Revised 11/15
www.promega.com
9.E. Composition of Buffers and Solutions
TE–4 buffer (10mM Tris-HCl, 0.1mM EDTA [pH 8.0])
1.21g Tris base
0.037g EDTA (Na2EDTA • 2H2O)
Dissolve Tris base and EDTA in 900ml of deionized water. Adjust to pH 8.0 with HCl. Bring the final volume to 1 liter
with deionized water.
TE–4 buffer with 20µg/ml glycogen
1.21g Tris base
0.037g EDTA (Na2EDTA • 2H2O)
20µg/ml glycogen
Dissolve Tris base and EDTA in 900ml of deionized water. Adjust to pH 8.0 with HCl. Add glycogen. Bring the final
volume to 1 liter with deionized water.
9.F. Related Products
Fluorescent STR Multiplex Systems
Product
PowerPlex® Y23 System
SizeCat.#
50 reactions
DC2305
200 reactions
DC2320
PowerPlex® 21 System
200 reactions
DC8902
4 × 200 reactions
DC8942
PowerPlex® 18D System
200 reactions
DC1802
800 reactions
DC1808
PowerPlex® 16 System*
400 reactions
DC6530
PowerPlex 16 HS System*
400 reactions
DC2100
PowerPlex® ESX 16 Fast System*
400 reactions
DC1610
PowerPlex ESX 17 Fast System*
400 reactions
DC1710
PowerPlex® ESI 16 Fast System*
400 reactions
DC1620
PowerPlex ESI 17 Fast System*
400 reactions
DC1720
PowerPlex® ESX 16 System*
400 reactions
DC6710
PowerPlex ESX 17 System*
400 reactions
DC6720
PowerPlex® ESI 16 System*
400 reactions
DC6770
PowerPlex ESI 17 Pro System*
400 reactions
DC7780
®
®
®
®
®
Not for Medical Diagnostic Use.
*Also available in a 100-reaction size.
Promega Corporation · 2800 Woods Hollow Road · Madison, WI 53711-5399 USA · Toll Free in USA 800-356-9526 · 608-274-4330 · Fax 608-277-2516
www.promega.com TMD021 · Revised 11/15
45
9.F. Related Products (continued)
Accessory Components
Product
SizeCat.#
PowerPlex® Matrix Standards, 310*
50µl (each dye)
PowerPlex Matrix Standards, 3100/3130*
25µl (each dye)
DG4650
25µl
DD7101
®
2800M Control DNA*
DG4640
500µlDD7251
Internal Lane Standard 600
150µl
DG1071
6,250µl (5 × 1,250µl)
DW0991
Water, Amplification Grade*
*Not for Medical Diagnostic Use.
Sample Preparation Systems
Product
SizeCat.#
DNA IQ™ System**
100 reactions
DC6701
400 reactions
DC6700
Casework Extraction Kit*
100 reactions
DC6745
50 samples
DC6801
200 samples
DC6800
1 each
AS3060
DNA IQ™ Reference Sample Kit for Maxwell 16**
48 preps
AS1040
DNA IQ™ Casework Pro Kit for Maxwell® 16*
48 preps
AS1240
Plexor HY System*
200 reactions
DC1001
800 reactions
DC1000
10 pack
V1391
Differex™ System*
Maxwell® 16 Forensic Instrument*
®
®
Slicprep™ 96 Device*
*Not for Medical Diagnostic Use.
**For Research Use Only. Not for use in diagnostic procedures.
9.G. Summary of Changes
The following changes were made to the 11/15 revision of this document:
1.
Patent and disclaimer statements were updated.
2.
The document design was updated.
46
Promega Corporation · 2800 Woods Hollow Road · Madison, WI 53711-5399 USA · Toll Free in USA 800-356-9526 · 608-274-4330 · Fax 608-277-2516
TMD021 · Revised 11/15
www.promega.com
(a)
This product is sold under licensing arrangements with the USB Corporation. The purchase price of this product includes limited, nontransferable
rights under U.S. Patent Application Serial Number 11/171,008 owned by the USB Corporation to use only this amount of the product to practice the
claims in said patent solely for activities of end users within the fields of life science research and forensic analysis of genetic material relating to, or
obtained as the result of, criminal investigations or disaster sites conducted either by or for a governmental entity, or for use in or preparation for legal
proceedings, as well as the compilation and indexing of the results of such analysis, and also analysis for parentage determination (the “Forensic and
Genetic Identity Applications Field”). The Forensic and Genetic Identity Applications Field specifically excludes tissue typing related to transplantation or
other medical procedures. Further licensing information may be obtained by contacting the USB Corporation, 26111 Miles Road, Cleveland, OH 44128.
(b)
This product is sold under licensing arrangements with Stratagene. The purchase price of this product includes limited, nontransferable rights under
U.S. Pat. Nos. 5,449,603, 5,605,824, 5,646,019 and 5,773,257 owned by Stratagene to use only this amount of the product to practice the claims in said
patent solely for activities of end users within the fields of life science research and forensic analysis of genetic material relating to, or obtained as the
result of, criminal investigations or disaster sites conducted either by or for a governmental entity, or for use in or preparation for legal proceedings, as
well as the compilation and indexing of the results of such analysis, and also analysis for parentage determination (the “Forensic and Genetic Identity
Applications Field”). The Forensic and Genetic Identity Applications Field specifically excludes tissue typing related to transplantation or other medical
procedures. Further licensing information may be obtained by contacting the Business Development Department, Stratagene California, 11011 North
Torrey Pines Road, La Jolla, CA 92037.
© 2012, 2015 Promega Corporation. All Rights Reserved.
Maxwell, Plexor and PowerPlex are registered trademarks of Promega Corporation. Differex, DNA IQ, PowerTyper and Slicprep are trademarks of
Promega Corporation.
ABI PRISM, GeneMapper and MicroAmp are registered trademarks of Applied Biosystems. GeneScan and Genotyper are registered trademarks of
Applera Corporation. ART is a registered trademark of Molecular Bio-Products, Inc. FTA is a registered trademark of Flinders Technologies, Pty, Ltd., and
is licensed to Whatman. GenBank is a registered trademark of the U.S. Dept. of Health and Human Services. GeneAmp is a registered trademark of
Roche Molecular Systems, Inc. Hi-Di is a trademark of Applera Corporation. POP-4 is a registered trademark of Life Technologies Corporation.
Macintosh is a registered trademark of Apple Computer, Inc. Excel, Windows and Windows NT are registered trademarks of Microsoft Corporation.
Products may be covered by pending or issued patents or may have certain limitations. Please visit our Web site for more information.
All prices and specifications are subject to change without prior notice.
Product claims are subject to change. Please contact Promega Technical Services or access the Promega online catalog for the most up-to-date
information on Promega products.
Promega Corporation · 2800 Woods Hollow Road · Madison, WI 53711-5399 USA · Toll Free in USA 800-356-9526 · 608-274-4330 · Fax 608-277-2516
www.promega.com TMD021 · Revised 11/15
47