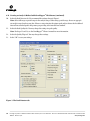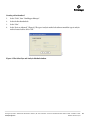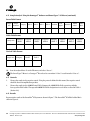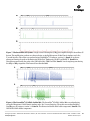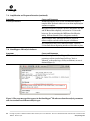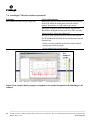
1
4.
Double-click on the Check ILS macro. The macros are listed at the bottom left corner of the active window. A
plots window will be displayed to show the internal lane standard (i.e., ILS 600) in the red dye color. Scroll down
to view and confirm that internal lane standard fragment sizes are correct. If necessary, redefine internal lane
standard fragments and re-analyze samples using the GeneScan® software.
Note: The software uses one ladder sample to determine allele sizes. The macro uses the first ladder sample
imported for allele designations.
5.
Double-click on the POWER macro. The POWER macro identifies alleles in the ladder sample and calculates
offsets for all loci. This process may take several minutes. When completed, a plots window will open to display
the allelic ladders (i.e., D8S1179, D18S51, Amelogenin, etc.).
In general, allelic ladders contain fragments of the same lengths as many known alleles for the locus. Allelic
ladder sizes and repeat units are listed in Table 3 (Section 9.A). Analysis using GeneScan® analysis software and
Genotyper® software allows allele determination by comparing amplified sample fragments with allelic ladders
and internal lane standards. When using an internal lane standard, the calculated lengths of allelic ladder
components may differ from those listed in the table. This is due to differences in migration resulting from
sequence differences between allelic ladder fragments and internal size standard fragments and is not a matter
of concern.
6.
Double-click on the Allelic Ladders macro. A plots window will open to display the blue (fluorescein) dye allelic
ladders (i.e., Amelogenin, D18S51 and D8S1179) and the green (JOE) dye allelic ladders (i.e., TH01). Confirm
that the correct allele designations were assigned to the allelic ladders (Figure 8 in Section 6.G).
Note: The software uses one ladder sample to determine allele sizes. The macro uses the first ladder sample
imported for allele designations. If the POWER macro is run a second time, the software will use the second
ladder; if the POWER macro is run a third time, the software will use the third ladder, etc., until all ladders in
the project are used. If an allelic ladder fails to be analyzed or if many off-ladder alleles are found in the samples,
the samples should be re-analyzed using another ladder from the project.
7.
Double-click on the Display Fluorescein Data macro to display the blue dye for all sample injections. Scroll down
to observe and edit as needed.
8.
Double-click on the Display JOE Data macro to display the green dye for all sample injections. Scroll down to
observe and edit as needed.
9.
Create the appropriate table by selecting the PowerTable, Make Allele Table or Make Vertical Table macro. The
three available table formats are shown below. The PowerTable option allows up to four alleles per sample file.
Additional information such as low peak signal or high peak signal is also included. The Allele Table and Vertical
Table options include only two alleles per locus. If more than two alleles are present at a locus, the smallest
alleles identified are included. The Allele Table format displays the categories (loci) in columns, while the
Vertical table format displays the categories in rows. These tables can be customized to fit needs. To save data in
tables, go to the Table drop-down menu, highlight “Export to File...” and save the file with the desired name and
location. The saved file can be viewed and analyzed using Microsoft Excel®.
Promega Corporation · 2800 Woods Hollow Road · Madison, WI 53711-5399 USA · Toll Free in USA 800-356-9526 · 608-274-4330 · Fax 608-277-2516
www.promega.com TMD021 · Revised 11/15
25