1
EVALUATION OF THE PERFORMANCE OF SOlL MOISTURE SENSORS
IN LABORATORY-SCALE LYSIMETERS
SOPHIE PROULX
A Thesis
Submitted to the Faculty of Graduate Studies
in Partial Fulfillment of the Requirernents
for the Degree of
MASTER OF SCIENCE
Department of Biosystems Engineering
University of Manitoba
Winnipeg, Manitoba
1*1
National Libraiy
.Canada
Bibliothèque nationale
du Canada
Acquisitions and
Bibliographic Services
Acquisitions et
services bibliographiques
395 WeUingion Street
OtlawaON K I A M
395. nie Wellington
ûttawa ON K l A ON4
Canada
Canada
The author has granted a nonexclusive licence ailowing the
National Library of Canada to
reproduce, loan, distriiute or se1
copies of this thesis in rnicroform,
paper or electronic formats.
L'auteur a accordé une licence non
exclusive permettant à la
Bibliothèque nationale du Canada de
reproduire, prêter, distribuer ou
vendre des copies de cette thèse sous
la forme de microfichelfilm, de
reproduction sur papier ou sur format
électronique.
The author retains ownersbip of the
copyright in this thesis. Neither the
thesis nor substantial extracts fiom it
may be printed or othewise
reproduced without the author's
permission.
L'auteur conserve la propriété du
droit d'auteur qui protège cette thèse.
Ni la thèse ni des extraits substantiels
de celle-ci ne doivent être imprimés
ou autrement reproduits sans son
autorisation.
THE UNIVERSITY OF MANITOBA
FACULTY OF GRADUATE STUDIES
*****
COPYRIGHT PERMISSION
EVALUATION OF THE PERFORMANCE OF SOlL MOISTURE SENSORS IN
LABORATORYSCALE LYSWTERS
A Thesis/Practicum snbmitted to the Facdty of Graduate Studies of The University of
Manitoba in partial fuifiiiment of the requirement of the degree
of
MASTER OF SCIENCE
SOPHIE P R O U Q 2001
Permission has been granted to the Librarg of the University of Manitoba to lend or seU copies of
tbis thesis/practicum, to the National Library of Canada to micro6im this thesis and to lend or sell
copies of the fdm, and to University Microfilms Inc.to pnblish an abstract of this thesis/practicnm.
This reproduction or copy of this thesis has k n made avaiIabIe by authority of the copyright
owner solely for the purpose of private study and mearch, and may only be reproduced and
copied as permitted by copyright iaws or with express written authorization from the copyright
n-?Ei*
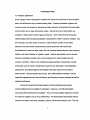
ABSTRACT
Soil moisture sensors were evaluated in laboratory-scale lysimeters. The performances
of tensiometers, granular m a t h sensors (GMS), capacitance sensors, phase
transmission sensors, and of a portable capacitance probe and a frequency-domain
reflectometry (FDR) sensor was observed in loam (31.5% sand, 45.2% silt, and 23.1%
clay) and silt loam (20% sand, 54% siit, and 26% clay) of the Ramada Series. The
experiment was conducted over two drying cycles in loarn for moisture contents
decreasing from 34.0 to 17.0% by volume for the 1999 trial and decreasing from 43.1 to
20.0% by volume for the 2000 trial and over a single drying cycle in silt loam for moisture
decreasing from 45.8 to 19.5% by volume. The lysimeters were designed with hydraulic
weighing systems to facilitate continuous monitoring of the soi1 rnoisture content For
the purpose of comparison, the readings obtained with the sensors were converted to
volumetric water contents. Soil matric potentials obtained with the tensiometers and
GMS were converted using soi-specific moisture characteristic curves. A conversion
equation was developed, based on texturespecific calibration curves published by the
manufacturer, to calibrate the readings of the Aqua-Tel sensors. The procedure
followed for converting the readings of the Aquaterr probe was also partially developed
by the experimenter to obtain more aecuracy.
The FDR sensor was the most accurate instrumentt9 measure soi1 moisture
content in both soils over the entire drying cycle and thus, it is most suitable to monitor
irrigation needs with accuracy, precision, and eass of use. Both capacitance sensors,
the Aquaterr probe and the Aqua-Tel sensors, also performedwell, measunng soi1
moisture content accurately although with l a s precision. Tensiometers and Watermark
sensors although very precise were rnainly inaccurate due to problems with data
conversion, However, they could serve as triggenng devices for initiating an automatic
i
irrigation system for soils in the high moisture range. The evatuation of the VIRRIB
sensors' performance remains inconclusive due to the malfunction of the sensors
resulting from calibration.
ACKNOWLEDGMENTS
I thank the Keystone Vegetable Producers Association and the Association of Im'gators
of Manitoba for their financial support.
I would like to thank Mr. P. Haluschak for his assistance in research site
selection and for providing sail analysis data. Thanks to the stafi at the Manitoba Crop
Diversification Centre, in Carbeny, Manitoba, and to the Wiebes for ailowing me to
conduct research on their property.
I am grateful to my advisor, Dr. R. Sn Ranjan, for his guidance and patience
needed during this research. I also thank Dr. W. E. Muir and Dr. M. Entz for serving on
my advisory ccimmittee and for their valuabte suggestions in reviewing tfiis thesis.
I wish to thank Mr. D. Bourne, Mr. M. McDonatd, and Mr. J. Putnam for their
technical help as well as for their constant encouragement. 1 also wish to thank Mr. G.
Klassen for his valued guidance and for his enthusiasm that helped me throughout this
research.
Thanks are due to my family, friends, and calleagues and al1 staff of the
department of Biosystems Engineering for their friendship and hefp. Special thanks to
Genny, who always knew how to be a gmd friend.
Finally, I wish to express my sincere appreciaüon to Jacques for his love,
understanding, and support
TABLE OF CONTENTS
ABSTRACT . . . . . . . . . . . . . . . . . . . . . . . . . . . . . . . . . . . . . . . . . . . . . . . . . . . . . . . . . . i
ACKNOWLEDGMENTS . . . . . . . . . . . . . . . . . . . . . . . . . . . . . . . . . . . . . . . . . . . . . . . . iii
TABLE OF CONTENTS . . . . . . . . . . . . . . . . . . . . . . . . . . . . . . . . . . . . . . . . . . . . . . .
iv
LIST OF FIGURES . . . . . . . . . . . . . . . . . . . . . . . . . . . . . . . . . . . . . . . . . . . . . . . . . . . vii
LIST OF TABLES . . . . . . . . . . . . . . . . . . . . . . . . . . . . . . . . . . . . . . . . . . . . . . . . . . . .
ix
1.1 Problem statement . . . . . . . . . . . . . . . . . . . . . . . . . . . . . . . . . . . . . . . . . . . 1
1.2 Objectives . . . . . . . . . . . . . . . . . . . . . . . . . . . . . . . . . . . . . . . . . . . . . . . . . . 2
2.1 Review of sensors' performance . . . . . . . . . . . . . . . . . . . . . . . . . . . . . . . . . 5
2.2Backgroundtheory . . . . . . . . . . . . . . . . . . . . . . . . . . . . . . . . . . . . . . . . . . . 7
2.2.1 Gravimetnc method . . . . . . . . . . . . . . . . . . . . . . . . . . . . . . . . . . . 8
2.2.2 Tensiometric method . . . . . . . . . . . . . . . . . . . . . . . . . . . . . . . . . . 8
2.2.3 Electromagnetic methods . . . . . . . . . . . . . . . . . . . . . . . . . . . . . . . 9
2.3 Literature review of lysimetry ................................... 19
3 PRINCIPLES OF SOlL WATER CONTENT MEASUREMENT
................ 23
3.1 Commonly used techniques ................................... 23
3.1 -1 Tensiometric method ................................. 23
3.1.2 Electromagnetic methods . . . . . . . . . . . . . . . . . . . . . . . . . . . . . . 24
3.1.2.1 Resistance sensors ........................... 24
3.1.2.2 Timedomain sensors . . . . . . . . . . . . . . . . . . . . . . . . . . 24
3.1.2.3 Frequency-domain sensors . . . . . . . . . . . . . . . . . . . . . 25
3.1.2.4 Phase-domain sensors ........................ 25
3.2 Sensors tested in this research .................................
3.2.1 Tensiometers .......................................
3.2.2 Waterrnark granular matrix sensors ......................
3.2.3 Aquaterr ...........................................
2
'
A 1111..
v.r.-rr\yua-Taf
...........................................,
26
26
26
27
,
Ci0
3.2.5 VlRRlB . . . . . . . . . . . . . . . . . . . . . . . . . . . . . . . . . . . . . . . . . . . . 29
3.2.6 Thetaprobe ......................................... 29
4 MATERIALS AND METHODS . . . . . . . . . . . . . . . . . . . . . . . . . . . . . . . . . . . . . . . . .
31
4.1 Field study .................................................31
4.1 -1 Experimental site description ........................... 31:
4.1.2 Sensors installation ................................... 32
4.1.2.1 Tensiometers . . . . . . . . . . . . . . . . . . . . . . . . . . . . . . . . 32
4.1.2.2 Watermark GMS . . . . . . . . . . . . . . . . . . . . . . . . . . . . . 33
4.1 .2.3 Aquaterr . . . . . . . . . . . . . . . . . . . . . . . . . . . . . . . . . . . . 33
4.1.2.4 Aqua-Tel . . . . . . . . . . . . . . . . . . . . . . . . . . . . . . . . . . . 33
4.1.2.5 VlRRlB . . . . . . . . . . . . . . . . . . . . . . . . . . . . . . . . . . . . . 33
4.1.3 Data collection . . . . . . . . . . . . . . . . . . . . . . . . . . . . . . . . . . . . . . 34
4.2 Laboratory study . . . . . . . . . . . . . . . . . . . . . . . . . . . . . . . . . . . . . . . . . . . . 34
4.2.1 Lysimeters . . . . . . . . . . . . . . . . . . . . . . . . . . . . . . . . . . . . . . . . . 34
4.2.1.1 Lysimeter design . . . . . . . . . . . . . . . . . . . . . . . . . . . . . 34
4.2.1.2 Lysimeter calibraiion . . . . . . . . . . . . . . . . . . . . . . . . . . 39
4.2.1.3 Soit blocks . . . . . . . . . . . . . . . . . . . . . . . . . . . . . . . . . . 40
4.2.2 Sensors installation and calibration ...................... 41
4.2.3 Data collection . . . . . . . . . . . . . . . . . . . . . . . . . . . . . . . . . . . . . . 45
4.3 Data conversion . . . . . . . . . . . . . . . . . . . . . . . . . . . . . . . . . . . . . . . . . . . .
4.3.1 Tensiometers and Waterrnark granular matBx sensors . . . . . . .
4.3.2 Aquaterr . . . . . . . . . . . . . . . . . . . . . . . . . . . . . . . . . . . . . . . . . . .
4.3.3. Aqua-Tel ..........................................
4.3.4 VIRRIB ............................................
4.3.5 Thetaprobe . . . . . . . . . . . . . . . . . . . . . . . . . . . . . . . . . . . . . . . . .
46
46
46
50
50
50
5 RESULTS and DISCUSSION ...................
5.2 Lysirneter study ............................................. 54
5.2.1 Experimental design .................................. 54
5.2.2 Calibration of the weighing system ....................... 55
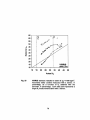
5.2.3 Accuracy and precision of the sensors .................... 56
5.2.3.1 Tensiometers and Watermark GMS ............... 81
5.2.3.2 Aquaterr soi1 moisture meter .................... 84
5.2.3.3 Aqua-Tel capacitance probes ................... 85
5.2.3.4 VIRRIB phase transmission sensors .............. 86
------
r n c TL-&-n-~-ynn
c ) . ~ . ~t I.I Ca~ Q ~ I W U C : r u aetlaur
~
.......................
--
Of
5.3 Functional considerations . . . . . . . . . . . . . . . . . . . . . . . . . . . . . . . . . . . . . 88
5.3.1 Tensiometers ....................................... 89
5.3.2 Watemark GMS ..................................... 89
5.3.3 Aquaterr portable capacitance probe . . . . . . . . . . . . . . . . . . . . . 89
5.3.4 Aqua-Tel capacitance sensors . . . . . . . . . . . . . . . . . . . . . . . . . . 90
5.3.5 VlRRlB phase transmission sensors ...................... 90
5.3.6 Thetaprobe FDR sensor ............................... 90
6 CONCLUSIONS .................................................... 92
6.1 Experimental considerations
................................... 92
6.2 Performance of the sensors . . . . . . . . . . . . . . . . . . . . . . . . . . . . . . . . . . . 92
6.2.1 Accuracy and precision . . . . . . . . . . . . . . . . . . . . . . . . . . . . . . . .92
6.2.2 Ease of use . . . . . . . . . . . . . . . . . . . . . . . . . . . . . . . . . . . . . . . . 94
6.2.3 Overall performance . . . . . . . . . . . . . . . . . . . . . . . . . . . . . . . . . . 96
7.1 Recommended future research . . . . . . . . . . . . . . . . . . . . . . . . . . . . . . . . . 98
7.2 Appiication of research results
. . . . . . . . . . . . . . . . . . . . . . . . . . . . . . . . . 98
LIST OF FIGURES
Soil moisture sensors tested in the field and laboratory trials . . . . . . . . . . . . . . 3
.
View of the Thetaprobe sensor tested in the laboratory trial of 2000 ......... 3
Equivalent circuit of capacitance sensor ............................ 18
Top view and elevation view of the steel grate ........................ 36
Top view of the lysimeter ......................................... 37
Elevation view of the lysimeter . . . . . . . . . . . . . . . . . . . . . . . . . . . . . . . . . . . . . 38
Spatial arrangement of the soi1 moisture sensors inside the soi1 container of
the lysimeter (top view) . . . . . . . . . . . . . . . . . . . . . . . . . . . . . . . . . . . . . . . . . . 42
Top view of the half-filled lysimeter . . . . . . . . . . . . . . . . . . . . . . . . . . . . . . . . . 44
Soil moisture characteristic curve for Loam with p. =l190 kg/m3 ........... 48
Soil moisture characteristic curve for Loam with pb=t150 kglm3 . . . . . . . . . . . 49
Soil rnoisture characteristic curve for Silt Loam with p. =1250 kg/m3 ........ 49
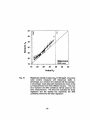
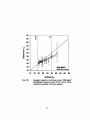
Results from the field study of 1998 in Loarn. in the rain fed experimental plot 53
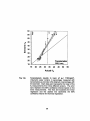
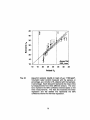
Tensiometers results in Ioam of pb=l190 kglm3
....................... 57
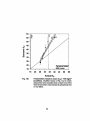
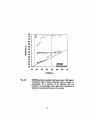
Tensiometers results in loam of p. =Il90 kg/m3(modified)
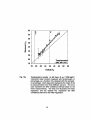
Tensiometers results in loam of p. =t 150 kglm3
............... 58
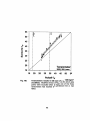
....................... 59
Tensiometers results in Ioam of pb=l150 kglm3(modifieci) ............... 60
Tensiometers results in loam of pb=l250 kglm3 ....................... 61
Tensiometers results in loam of p. =1250 kg/m3(modified) ............... 62
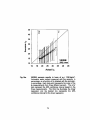
Watennark results in loam of p,=1190 kg/m3
.........................
63
Watemark GMS results in loam of pb=l150 kglm3 ..................... 64
Watermark GMS results in Ioam of pb=1150kglm3(modified) .............65
Watemark GMS results in silt loam of pb4 2 5 0 kglm3
vii
.................. 66
Waterrnark GMS results in silt loam of p. =1250 kg/m3(modified) . . . . . . . . . . 67
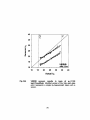
~quaterrresults in Ioam of pb=l190 kglm3 ........................... 68
Aquaterr results in loam of p. =t 150 kglm3 ........................... 69
Aquaterr results in silt loam of ph=1250kglm3 . . . . . . . . . . . . . . . . . . . . . . . . . 70
Aquaterr results in silt loam of ph=1250kglm3(modified) . . . . . . . . . . . . . . . . 71
Aqua-Tel sensors results in loam of p. =Il90 kg/m3 .................... 72
Aqua-Tel sensors results in loam of pb=l150 kglm3 . . . . . . . . . . . . . . . . . . . . 73
VlRRlB sensors results in Ioam of pb=l190 kg/m3 ...................... 74
VlRRlB sensors results in foam of pb=1190kg/m3(modified)
............. 75
VlRRlB sensors results in loam of pb=l150 kglm3 ...................... 76
VlRRlB sensors results in silt toam of p. =1250 kglm3 . . . . . . . . . . . . . . . . . . . 77
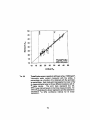
Thetaprobe sensor results in loam of pb=l150 kglm3 ................... 78
Thetaprobe sensor resuits in silt loam of pb=1250kg/m3 ................ 79
viii
LIST OF TABLES
I.
R-values for the Aquaterr at different moisture conditions . . . . . . . . . . . . . . . . 46
II.
Measured values used to calculate a, and a. for loam and silt loam ........ 51
III .
Calculated constants. a.. and a. of Eq.21. for loam and silt loam
IV.
Summary of accuracy and precision of the soi1 moisture sensors .......... 96
V.
Summary of the evaluation of the sensors' ease of use ................. 97
.......... 51
1 INTRODUCTION
1.1 Problem statement
Good irrigation water management requires soi1 moisture content data to ensure higher
water use efftciencies and to achieve better yields. Properly scheduled irrigation can
conserve water and energy for pumping and also minimize the potential for groundwater
contamination due to deep percolation losses. Several sources of information are
available to help growers make irrigation decisions. Both measured and forecasted
meteorological data including precipitation, temperature, relative humidity, radiation, and
wind velocity; soit water status in the form of soi! moisture content or soi1 matric
potential; and plant-based measurements provide producers with useful data.
Combinations of these are often used, with soit moisture status being the most common,
reliable, and direct indicator of irrigation needs. Various approaches such as remote
sensing, hydrological models, and in situ sensing can be used to determine soi1
moisture conditions. Many in situ rnethods including lysimetry, tensiometry, nuclear
techniques such as neutron scattering and gamma ray attenuation, heat dissipation
approaches, and electromagnetic techniques have been used for soi1 moisture
determination. Electromagnetic techniques, also catted dielectric methods, include
capacitive approaches such as timedomain and frequency-domain methods as well as
resistive techniques.
Numerous sensing instruments based on those techniques have been
commercialised and are available to producers. However, very little information
conceming their performance is available. Thus, the most suitable methods to monitor
the need for irrigation are yet to be determined. The best sensing instruments should
measure soi1 water accurately, precisely, quickly, and should be easy to use. The use
of a sensor implies installing and operating the instrument as well as interpreting the
readings obtained, which can require calibraiion or conversion of the measured quantity
to soi1 moisture units.
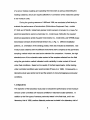
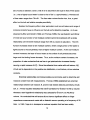
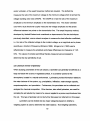
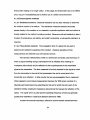
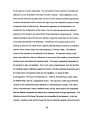
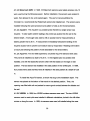
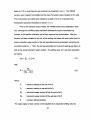
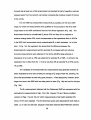
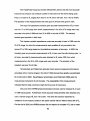
During the growing seasons of 1998 and 1999, we conducted a field study to
evaluate the performance of tensiometers (Soilmoisture Equipment Corp., models
2710AR and 2725AR), Watemark granular matric sensors (Irrometer Co.), Aqua-Tel
electrical capacitance sensors (Automata Inc., model Aqua-Te194-29), the Aquaterr
electrical capacitance probe (Aquaterr Instruments Inc., model200), and VlRRlB phase
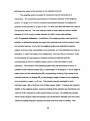
transmission sensors (Environmental Sensors lnc.) ( Fig. 1). Different installation
patterns, i.e. orientation of the sensing probes, were also included as treatments. Soi1
moisture data obtained with the different instruments were campared to the gravimetric
sampling method which was used as the stafiu'ard for comparison. However, the high
standard error of the volumetric water content of the samples collected from the field
using the gravimetric method indicated a wide variability in water content of the soi1
under field conditions. Based on the resuIts of the fieid experiments, further testing
under controlled conditions was recornmended (Proulx et al. 1998). Consequently, a
laboratory study was camed out to test the sensors in more-homogeneous soil-water
conditions.
1.2 Objectives
The objective of the laboratory study was to evaluate the performance of soi1 rnoisture
sensors under controlled soi1 rnoistwe conditions in laboratory-scale lysimeters. In
addition to the five types of sensors previously tested in the field trials, and in the
laboratory trial of 1999, another dielectric probe was inciuded in the laboratory trial of
Tonsiorneter
B6
VlRRlB phase
tnnsmlsslon sensor
matrlr
fi
capacitance -.
probe .!!=
rii
L
Y
.i-
r
SI
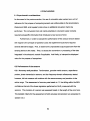
Fig. 1 Soil moisture sensors tested in the field and laboratory
trials. Tensiometers, Watermark GMS, VlRRlB sensors,
Aqua-Tel sensors, and the Aquaterr probe were tested.
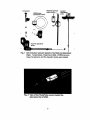
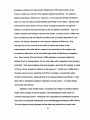
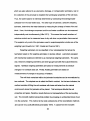
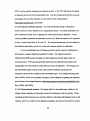
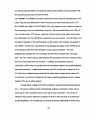
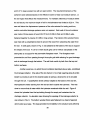
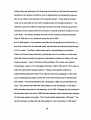
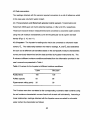
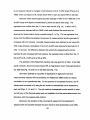
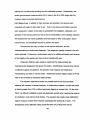
Fig. 2 View of the Thetaprobe sensor tested the
laboratory trial of 2000.
2000. The Thetaprobe (Delta-T Oevices Ltd, type ME), shown in Fig. 2, which can also
be buried permanently in the soil, was used as a portable sensor. The performance of
the sensors was evaluated in loam and silt Ioam soils of the Ramada Series taken from
the experimental plots located at the Manitoba Crop DiversificationCentre, Carbeny,
Manitoba.
1.3 Scope
This thesis presents only a brief overview of the field testing conducted in 1998 and
1999. Because the main focus of the research was the evaluation of soi1 moisture
sensors under controlled moisture conditions, a detailed description of the lysimeter
study is given. The literature review describes the basic theory behind various soil
moisture measurement techniques, the principles of operation of the instruments tested,
as well as the performance of similar soil-moisture-measurement equipment reported in
the literature. The experimental rnethods of the field and Iaboratory study are presented,
followed by results. The results from the Iysimeter study are then discussed and
conclusions are presented. Finally, recommendations addressed to both producers and
researchers are stated.
2 LITERATURE REVIEW
2.1 Review of sensors' performance
Despite the wide array of soi1 moisture measuring devices available in the market, very
few studies comparing the performance of the sensors investigated in the present study
have been reported in the Iiterature. Yoder et al. (1998) compared the performance of
the Troxler neutron gage, Troxler Sentry 200-AP capacitance probe, Aqua-Tel
capacitance sensors, timedomain reflectometry (TDR) probes, gypsum blocks,
Watermark granular matrix sensors (GMS), and Agwatronics heat dissipation blocks
under controlled soi1 moisture conditions. Their study was conducted in loam and sandy
loam using 0.61 -m deep soi1 columns equipped with a tensioncontrolled drainage
system and weighed with Ioad cells. Their results showed that, in order of decreasing
performance, Aqua-Tel sensors, the Sentry probe, the Troxler neutron gauge, and
Watermark sensors perfomied best when considering accuracy, reliability, durability,
and ease of installation.
Ripley et al. (1998) evaluated the performance of various types of soi1 moisture
sensors, including time-domain reflectometry probes, the ThetaProbe (Mode1ML-?),
capacitance sensors, and neutron probes at three locations. They reported that the
TDR probes and the ThetaProbe performed satisfactorily and were well suited for
unattended operation as opposed to neutron probes that require constant assistance.
They recommended the ThetaProbe over TDR probes because it was insensitive to
temperature, bulk density, and soi1 texture.
Hanson (1999) evaluated the performance of tensiorneters, Watermark GMS,
gypsum blocks, and the dielectric instruments Sentry 200-AP, TRIME, TRACE,
Enviroscan, Aquaterr, and ThetaProbe. The investigator reported that both
tensiometers and GMS showed good response to changes in moisture content except in
loarny sand where they failed to respond. The response of the GMS, however, tended
to lag that of tensiometers. The Thetaprobe performed very accurately and cansistentiy
over a wide range of soi1 textures and was the only dielectric sensor to perfom well.
Eldredge et al. (1993) compared GMS readings to sail water rneasurements
obtained with tensiometers, a neutron probe, and gravimetric sampling. The expenment
was conducted in a potato field in a silt loam soil. They reported that the Watermark
GMS rneasurements were closely related to those obtained with the other techniques.
They also established that, when calibrated against tensiorneters, the Watermark meter
model30KTC had a linear response over the range from O to -80 kJkg represented by
the following relationship with a significance of 89%: lV-6.44-0.738.R. where iV is the
soil matric potential in Jikg and R is the meter's readings in dimensionless units.
However, because GMS measure soi1 matnc potential rather than soil moisture content,
they were found to be more suited for automatic irrigation triggering based on preset soi1
matric values.
Phene et al. (1989) reported the use of a soi1 matic potential sensor (SMPS) for
automatically initiating irrigation when the soi1 matric potential has reached a preset
level. They found a linear response between -10
* 3.3 and -300 I5.5 Jkg (Jlkg = kPa
= cBars).
Research conducted by Stieber and Shock (1995) established that the
performance of Watemark sensors in silt loam, in a potato field, was largely dependent
on the depth of installation of the sensor. They found the ideal location of the sensors to
be 0.15 rn offset frorn the centre of the hill and buried at a depth of 0.1 to 0.2 m. The
sensors responded within four hours of wetting and within 12 hours of drying. Sensors
placed deeper than 0.3 m responded slowiy and inconsistently.
6
McCann et al. (1992) evaluated the static and dynamic response characteristics
of the Watermark model 200 using the pressure plate method and experiments
conducted in greenhouses. They found the sensor's resistance to respond nearly
Iinearly to water potential over the range from O to -200 kPa. They also concluded that
the Watermark model 200 did not fully respond to rapid drying or partial re-wetting of the
soil.
Lischmann (1991) evaluated the performance of the VlRRlB phase transmission
sensor in the laboratory by installing the sensor and a gypsum resistance block in an
isolated block of soi1 placed on a scale. The VlRRlB readings were monitored over
several drying cycles and compared to the total mass on the scale and to the gypsum
block measurements. Vinegar and sulfuric acid were added to the soi1 block to evaluate
the effect of the soil solution's composition on the VlRRlB performance. A field study
was also conducted to determine the performance of the sensor under field conditions.
At completion of both studies, it was concluded that VlRRlB sensors can be used to
monitor irrigation needs.
Tensiometers and granular matrix sensors have been widely used and several
research projects evaluated their performance as a tool for triggering events (Phene et
al. 1989; McCann et al. 1992; Shock and Bamum 1993; Stieber and Shock 1995).
Information reporting the performance of the Aquaterr soi1 moisture meter, Aqua-Tel
capacitance sensors, VlRRlB phase transmission sensors, and the Thetaprobe,
however, remains scarce. The present study provides more information on these
sensors.
2.2 Background theory
2.2.1 Gravimetric method The gravimetric method first requires sampling of the soil
and immediate weighing of the moist sample. The sample is then dried at 105°C for 24
h in a convection oven and weighed again after cooling in a desiccator. The mass basis
water content of the sample is calculated using:
where:
8,
= gravimetric water content (mass fraction),
m,
= mass of water contained in the sample (kg),
ms
= mass of dry soi1 in the sample (kg).
To determine the volumetric water content of the soil, the gravimetric water content is
multiplied by the apparent specific gravity (ASG) of the soil. The ASG is defined as the
ratio of the soil bulk density to the density of water. The relationship is simplified as
follows:
6, = 8,rASG
(2)
where:
0,
= volumetric water content (volume fraction),
ASG
= apparent specific gravity (decimal fraction).
2.2.2 Tensiometric method The tensiometric method relies on the relationship that
exists between the soi1 matric potential and its rnoisture content. The soi1 matric
potential, which can also be called matric suction or tension, is the resultant of the
combination of capillary and adsorptive forces occumng in porous media. CapiIIary
iarces are mainiy surface lension forces causea Dy ine aa"nesion or'waier ana [ne soi
and by the narrowness of the pores (Smedema and Rycroft 1983). The capillary
pressure is a function of the size of the pores and c m be approximated using:
where:
PCaP
D
= capillary pressure (m),
= diameter of the pore (pm).
Adsorption forces comprise van der Waals and electrostatic forces exerted on the water
by the negatively charged colloidal surfaces of the soi1 particles. Tensiometers are used
to measure the matric potential of soils.
2.2.3 Electromagnetic methods Techniques that rely on the propagation of
electromagnetic waves through a medium to measure its electrical properties fall into
the category of electromagnetic methods. Those methods, often referred to as
dielectric techniques, comprise various type of instruments, probes, or sensors that
differ from each other mainly by the characteristics of the signal sent and the
measurement quantities. For example, voltage steps are commonly used to measure
travel tirne in a medium whereas sine waves may be used to measure frequency shift or
amplitude variation.
The principle behind the use of electromagnetic waves to measure the electdcal
characteristics of the medium through which they travel is based on the propagation of
electromagnetic waves in transmission lines. The velocity of propagation is described
by the following equation:
for which
and
where:
v
= velocity of propagation (mis),
II,
= relative pemeability constant (decimal fraction),
Cr
= absolute pemeability of the medium (Hlrn),
Po
= permeability of free space (= 1.257~10'~
Hlrn),
Er
= relative pennittivity or dielectric constant (decimal fraction),
&
= absolute permittivity of the medium (Flm),
&O
= absolute permittivity of free space (= 8.854xIO-'* Flm),
C
= velocity of light in free space (= 3x10' mls).
The velocity of wave propagation in a transmission Iine can also be expressed by
10
where:
d
= distance of travel (m),
t
= propagation time to travel the distance, d, (s).
Although the physical configuration of sensing instruments can Vary greatly, they
al1 require that the medium be placed somewhere within the electric field produced
either by simple electrodes or by a transmission line. In the most simple configuration,
the porous medium is positioned behveen two electrodes which form the plates of a
capacitor. In more complex systerns, the medium forms either a portion or the whole
dielectrics of a transmission fine, which can itself Vary in its configuration. The electrical
properties of the surrounding medium therefore directly affect the propagation of the
electromagnetic signal through the media.
In this case, the medium consists of moist soil. Electrical properties of moist soi1
can be described by the relative complex dielectric permittivity function:
where:
~ ( f ) = relative complex dielectrïc permittivity of the moist bulk soil
(dimensionless),
e'(9
= real part of ~ ( f(dimensionless),
)
~ " ( f ) = relaxation losses (dimensionlesç),
f
= measurement frequency (Hz),
I
= square root of -1,
CS
= conductivity of the moist buIk soi1 (Slm).
The real part of the relative complex permittivity function is a measure of the energy
stored by the dipoles aligned in the applied electromagnetic field. In other words, &'(f)is
a measure of the polarization and in tum a measure of the capacitance of the media. In
soils, because most of the dipoles that are free to respond to polarization are water
) closely correlated to the water volume fraction. The imaginary part of
molecules, ~ ' ( fis
~ ( fis) a measure of the energy losses caused by relaxation losses, ~"(f),and
conductivity losses, 0/(2rrf&J. The dependence of the relative wmplex dieledric
permittivity of bulk soi1 on frequency is due to the frequency dependence of free water's
dielectric properties. The Cole-Cole function describes the frequency dependent
as follows:
relative complex dielectric permittivity of free water, Uf),
where:
cg,W = high-frequency Iimit of the real dielectric pemittivrty (=4.22),
E,,
= static value of the real dielectric permittivity (=80.1 O),
faw
= relaxation frequency of water (=17.113 GHz),
f
= measurement frequency (Hz),
I
= square root of -1,
k
= parameter accaunting for a spread in relaxationfrequency (=0.013!:
a
,
= conductivity of free water (Sim).
Those values are given at 25°C (Heimovaara et al. 1994). Values of the relative
complex dielectric permittivity of free water as a function of frequency are given by
Thomas (1966). The real part of &(f)is nearly independent of the measurement
frequency over the range from about 50 to 1000 MHz and it varies merely from 81 to 78
over the temperature range of 15 to 25°C. The imaginary part of &(O, for free water
without dissolved impurities, has a value of about 20 at I O MHz which decreases as
frequency increases to reach 2 at 100 MHz. Energy losses in that frequency range are
mostly due to conductivity losses. Conductivity losses can be substantial at
measurement frequencies below 50 MHz in soils due to conductive solids and dissolved
impurities such as soluble salts. The cut-off frequency value below which conductivity
losses can be important is not well defined and values ranging from 20 to 50 MHz were
reported in the literature reviewed (Thomas 1966; Heimovaara et al. 1994; Topp et al.
1980 ). As the frequency increases to the GHz range, relaxation losses become
important reaching a value of about 30 at 10 GHz. Consequently, because both the real
dielectric permittivity and the conductivity tosses are functions of frequency and do not
Vary at the same rate nor reach the same maxima and minima, a measurement
frequency can be chosen, depending on the application, to obtain significant
measurement quantities. For example, to measure soi1 salinity which is determined by
measuring the soi1 conductivity, a frequency of 10 MHz would be more appropriate than
one of 100 MHz.
Moist bulk soi1 is a mixture of solids, air, and bound and free water. The relative
complex permittivity of the bulk soit is therefore a function of e(f) of each constituent and
their respective volume fraction. For non-conducthe solids, low salts concentration,
temperature ranging from 15 to 25*C, and at irequencies between 50 MHz and 1 GHZ,
13
~ ( fof
) solids is between 2 and 5, that of air is assumed ta be equal to that of free space
i.e.1, that of tightly bound water is close to that of ice Le. approximately 3, whereas ~ ( f )
of free water ranges from 78 to 81. The free water volume fraction has, thus, a great
effect on the bulk soi1 relative complex permittivity.
Besides the frequency effect, other parameters such as soi1 texture and range of
moisture contents have an influence on the bulk soil's dielectric properties. As it was
observed by Eller and Denoth (1996) and Thomas (1966), the real dielectric permittivity
of moist soi1 as a function of soi1 moisture content cannat be expressed with a single
relationship over the entire moisture range from 0% by volume to saturation. The &'(f)
function increases slower at low moisture content, where a large portion of the water is
tightly bound to the soi1 particles, than at higher moisture content. As the soi1 moisture
content increases, the layer of bound water at the surface of soi1 particles becomes
larger and the binding forces decrease. Thus, as the rnoisture content increases, the
proportion of water molecules that are free to get polarized also increases thereby
causing a rapid increase of &'(f). Since the adhesive force varies with sail texture, &'(f)
of bulk soi1 is dependent on the particle size distribution, or soi1 texture, at low moisture
contents.
Empirical relationships and mixing models are cornmonly used to detemine soil
moisture content from &(f) rneasurements. Thomas (1966) established two ernpirical
relationships between soi1 moisture, 8, and the real relative dielectric pemittivity of bulk
soil, es. A linear equation described the cs(fj-9correlation for 8 below 10.0% by volume
whereas a semi-logarithmic relationship was selected for 8 from 4.5 to 45.0% by
volume. He concluded that soi1 texture did not have a significant effect on fringe
capacitance measurements made with a dielectric sensor operating at a frequency of 30
MHz In 1980, Topp et al. developed a naniinear equation that has been widely
14
accepted as reference for timedomain reflectarnetry (TDR) determination of soi1
moisture conterit as a function of the apparent dielectric permittivity. The apparent
dielectic permittivity, referred to by Topp et al., is the measured dielectric permittivity
which is in fact the relative complex dielectric permittivity of the medium. Because their
measurements were made in low-loss. nearly homagenous material, the apparent
dielectric conductivity was assumed equal ta the real dielectric permittivity. Topp et al.
(1980) compared their findings to several other studies, inctuding Thomas' (1966) work,
and concluded that bulk soi1 dielectric pennittivity was only weakly dependent on sail
texture, bulk density, temperature, and frequency, between 20 MHz and 1 GHz
Although they did not conclude on the effect of soluble salt content on the
measurements, they noted that an increase in the conductivity of the medium also
increased the attenuation of the transmitted signal while not affecting its propagation
time. More recently, EIler and Denoth (1996) developed a nonlinear relationship
behveen 0 and c' measurements, for four soils, taken with a capacitive probe operating
at 35 MHz. Their seconddegree polynomiaI equation, which held for 8 greater or equal
to 3% by volume, showed no influence of soi1 types on E'. Perdok et al. (1996) used a
frequency domain sensor operating at 20 MHz to correlate E' to gravimetric water
content and bulk density. Measurements of the complex dielectric permittivity, E, were
taken with an impedance analyser for labaratory use from which E' and the electric
conductivity were derived.
Dielectric mixing models range in complexity from Wagner's dielectrk spheres
model, which wnsists of oniy two phases, to the semidisperse mode!, which is a
compiex rnulti-phase system. Wobschall(1977) described the semidisperse model as
well as the chronological development of the HanailBruggelmanMlagner (HBW) theory.
The semidisperse mode1 proposed that the water and particles are mutually inter15
dispersed. It can be simplified to a moist particle phase consisting of a solid particie
within which water-filled micropores are dispersed and around which is a water layer. In
soils, the moist particles and air are dispersed in the remaining water. This multi-phase
model used the two-phase HBW theory to partially solve each portion of the more
complex model. Three-phase (solids, air, and water) and four-phase (solids, air, and
bound and free water) models have been widely used to correlate bulk soi1 complex
dielectric permittivity to the cornplex dielectric permittivity and the volume fraction of
each of the soil's constituents (Heimovaara et al. 1994; Gardner et al. 1998).
Various characteristics of the electromagnetic signal sent through the soi1 can be
observed to obtain dielectric permittivity measurements. The amplitude and phase of
the reflected signal or the combination of the incident and reflected signals, the
propagation time of a signal and of its reflection, and the frequency shift can be
observed to measure dielectric properties of a medium. Soil moisture sensors are made
of a wide range of electronic devices used with various configurations of sensing
probes. At frequencies below 200 MHz, vector impedance meters and radio-frequency
bridges can be used. Thomas (1966) used a Wayne-Kerr very high frequency (V.H.F.)
admittance bridge which measured capacitance and conductance to determine soi1
moisture content by fringe capacitance at 30 MHz. Fringe capacitance can be defined
as the capacitance measured by the fringing field generated by two electrodes. In the
case of two flat electrodes facing each other, the fringing field is essentially the part of
the field not included between the two plates. For coplanar electrodes, !he fringing field
is the entire field generated (Thomas 1966). Eller and Denoth (1996) determined soi1
moisture content by measuring the impedance at 32 MHz using a twin T-bridge which
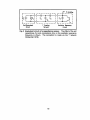
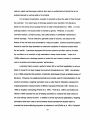
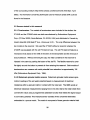
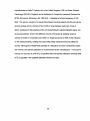
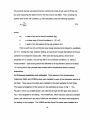
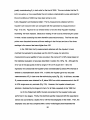
had been modified to cover a large range of pennittivities. Wobschall (1978) described
a frequency snifi dieiectric soii moisture sensor operating at 31 MHz that used a
16
capacitor T network to connect the electrodes to the frequency determining resonance
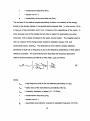
LC network (Fig. 3). The capacitor forms part of the feedback loop of the oscillator.
The resonance frequency can be expressed as a function of the change in capacitance
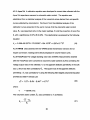
due to Csand G, (Eq. 10).
with:
and
Co = Cdt Cr
where:
f
= resonance frequency (Hz),
f~
= resonance frequency for Csand G, equal zero (Hz),
AC, = change in capacitance due to Csand G, (F),
Co
= total capacitance of the oscillator circuit (F),
Cd
= capacitance in the oscillator circuit (F),
Cr
= capacitance in the oscillator circuit due to L,(F),
1
= inductance in the oscillator circuit (H).
The frequency shift method was also used by Dean et al. (1987) and Gardner et al.
(1998).
Fer gozkr frpque~&s. me=-=ment
rpchniqii~sSE!
2s the s!&!&
!Le, the
Fig. 3 Equivalent circuit of a capacitance sensor. The effect of the soit
and conductance (G,)on the oscillator resonance
capacitance (Cs)
frequency is shown. The connection is made via the T network
(Wobschall 4978).
vector voltmeter, or the swept frequency method are required. The slotted line
measures the ratio of the maximum voltage to the minimum voltage which is termed the
voltage standing wave ratio (VSWR). The VSWR is in fact the ratio of the maximum
amplitude to the minimum amplitude on the transmission line. The vector voltmeter
used with a dual directional coupler measures the voltage amplitude and the phase
difference between two points on the transmission line. The swept frequency method,
developed by Hewlett-Packardand considered an improvement of the two techniques
previously described, uses a network analyser ta measure the load reflection coefficient,
Le. the ratio of the reflected voltage to the incident voltage, as a magnitude and a phase
quantity as a function of frequency (Sinnema 1988). Morgan et al. (1993) used a
reflectometer to measure the amplitude and phase differences at a frequency of 1.25
GHz. The values of complex permittivity thereby measured were processed to
detenine the real permittivity of soil.
2.3 Literature review of lysimetry
When studying parameters of the soi1 solution, a lysimeter can generally be defined as a
large soi1 block with a bare or vegetated surface, in a container opened to the
atmosphere, located in a natural environment. Lysirneters provide information related to
the water balance of the systern, e.g. precipitation, infiltration, water storage capacity,
evapotranspiration, and percolation. Furthemore, the percolates can be collected and
analyzed for chemical composition. Other devices, also called lysimeters, are used for
sampling the soi1 solution by means of a vacuum applied to a porous cup introduced into
the soil. This type of lysimeter will not be further discussed nor referred to in this paper.
Lysimeters can be divided into two major categories based on whether a
weighing system is used to determine the water balance. Non-weighing lysimeters,
19
which are also referred to as volumetric, drainage, or compensation lysirneters, rely on
the collection of the percolate to establish the hydrological properties of the soi1 block.
Thus, the water balance is indirectly determined by subtracting the drainage water
collected from the total water input, The other type of lysimeter, called the weighing
lysimeter, determines the water balance by measuring the change of mass of the soi1
block. Here, the drainage component and the soi1 water conditions can be measured
independently and simultaneously (Hillel 1971). This means that small variations of
moisture content can be measured even in dry soi1 when no percolation has occurred.
This explains why rnost of the lysimeters used in evapotranspiration studies are of the
weighing type (Howell et al. 1991; Grebet and Cuenca 1991).
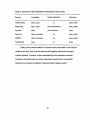
Weighing lysimeters can be classified in four subcategories that group the
lysimeters based on the weighing principles or devices utilized. Lysimeters equipped
with mechanical scales are referred to as mechanical weighing lysirneters. The same
way, electronic weighing lysimeters use strain-gauge load-ceils that output electronic
signals. Hydraulic weighing lysimeters are based on measurements of pressure
changes in a hydraulic load cell. Finally, floating lysimeters are based on
measurements of changes in buoyancy or fiotation.
The soi1 block contained within the lysimeter boundaries can be reconstituted by
two methods. The simplest one is called the filled-in method. As the terrn indicates, the
method consists of filling the soi1 container with loose soi1 taken from the natural
environment where the lysimeter will be placed. This technique disturbs the soi1
properties and gives, therefore, results that are not representative of the surrounding
soil. The monolith method salves that problem by encasing an undisturbed block of soi1
into the container. This rnethod is the most cumbersome of the reconstitution methods
and can be very costly (Bhardwaj and Sastry 1979). A variant from the monolith
20
method, called the Ebermeyer rnethod, also uses an undisturbed soi1 block that is not
isolated laterally by vertical walls of a container.
For al1 types of lysimeters, a system is required to ailow the water to flow through
the lysimeter. Two basic types of drainage systems were reported in the literature
based on the driving force causing the flow of water (Aboukhaled et al. 1982). In a freedrainage system, the excess water is drained by gravity. Whereas, in a suctioncontrolled system, constant suction, also called tension, is artificially maintained to
control drainage. Porous colleetors, generally made of ceramic, are placed at the
bottom of the soi1 block and connected to a vacuum system. Suction-controlled systems
should be used for deep lysimeters to overwme variations of moisture content within
the soi1 profile. Lysimeters equipped with tension systems are often used to simulate
dry conditions or to maintain a high watertable in water stress studies. Yoder et al.
(1998) utilized such a drainage system to control the soi1 moisture content in a lysimeter
used to evaluate soi1 moisture sensors' performance,
Lysirneter history covers a period of about 300 yr and their application in various
fields of research has been largely documented (Aboukhaled et al. 1982). Aboukhaled
et al. (1982) presented the evolution of lysimetry techniques through a detailed review of
Iiterature. Whereas non-weighing lysimeters are mostly used for characterization of soi1
solution percolates, weighing Iysimeters cover a wider field of utilizations ranging from
evapotranspirationmeasurements of different canopies (Fritschen 1991; Klocke et al.
1985) to irrigation scheduling (Phene et al. 1991). Pruitt et al. (1991) and Kutilek and
Niefsen (1994) reported the use of floating Iysimeters to measure the shear stress on
the crop canopy caused by wind. In addition to those agricultural applications, weighing
lysimeters have been used in environmental impact assessrnent studies either to
quantii the factors affecting migration of pollutants in soi1 (Phillip et al. 1991; Campbell
21
et al. 1991) or to evaluate remediation technologies
(http:llwww.pharm.arizona.edulcentersAox~center/superfundlprojectslcore~cl.html,
February 1999).
3 PRINCIPLES OF SOlL WATER CONTENT MEASUREMENT
3.1 Commonly used techniques
3.1.1 Tensiometric method Tensiorneters give direct measurements of the soil water
potential which can also be called soi1water tension or soil matric potential. The
tensiometer consists of a ceramic cup connected to a vacuum gauge by a rigid tube.
The tube can Vary in length allowing for rneasurement at various depths in the soil.
Prior to installation, the tube is filled with de-aired water and the water is allowed
to saturate the porous tip of the tensiometer. A suction pump is then attached to the
tube to remove the dissolved air from the porous tip as well as the water column within
the tensiometer to insure that most of the dissolved air is evacuated from the system.
De-aired water is poured into the stem to fiIl it up to the O-ring seal. The cap is screwed
into place carefully without trapping any air in the tensiometer. The tensiometer is then
sealed and ready to be installed.
Once buried in the soil, the water contained in the porous cup reaches
equilibrium with the soi1 water in the pore space. Thus, in a completely saturated soil,
the gauge of the tensiometer would indicate zero since the free soi1 water would be in
equilibrium with the water contained in the tip. Under unsaturated conditions, the soil
contains less water and consequently has a higher capillary tension. This creates a
tension on the water contained within the porous ceramic cup which releases water until
the tension within the cup is equal to the tension existing in the surrounding soil, The
reading on the gauge of the tensiometer thus indicates the soi1 water tension.
When the soil water potential exceeds the air entry pressure of the porous
ceramic cup causing air to break tbrough the largest pores in the cup, the tensiometer
has reached its limit of operation. At this point, the gauge will indicate zero and the
tensiometer reading is no longer useful. At this stage, the tensiometer has to be refilled
and a vacuum re-established prior to further use in a wetter soi1 environment.
3.1.2 Electromagnetic methods
3.1.2.1 Resistance sensors: Electrical resistance can be used indirectly to detemine
the moisture content of a medium. The resistance measured between electrodes
placed directly in the medium or in a material in hydraulic equilibrium with the medium is
directly related to the medium's moisture content. Because moist soi1 resistivity is also a
function of temperature, soi1 salinity, and solids' conductivity, a soil-specific calibration is
required.
3.1.2.2 Time-domain sensors: The propagation time of a signal can be used to
determine the dielectric properties of the medium. Systems operating on time
measurements are referred to as time-domain sensors.
Timedomain reflectometry (TDR) is a well-known and widely used technique in
which a signal travelling along a transmission line is reflected when meeting an
irnpedance discontinuity and its reflection is then superimposed on the transmitted
signal at the transmitter. The time measured is the time required for the signal to travel
frorn the transmitter to the end of the transmission line and to corne back to the
transmitter as a reflection. In other words, the two-way propagation time is measured.
When applied to soi1 moisture measurement devices, the TDR sensor consists of a
discontinued transmission line extending into the soi1 for which the sail is part of the
dielectric thereby creating the impedance diswntinuity that causes the reflection of the
signal. The signal sent is a pulse and the operating frequency is fixed and generally
greater than 250 MHz in cable fault detection (Sinnema 1988).
Another timedomain technique, referred to as time-domain transmissometry
(TDT), can be used to measure soi1 moisture content. In the TDT technique, the signal
is observed at the end of the transmission Iine. The time measured is thus the one-way
propagation time and the reflection is not involved in the rneasurements
(htt~://www.en~~ens.c~m,
April2000).
3.1.2.3
Freqrencydomain sensors: The most elementary design of frequency-
domain sensors is also referred to as a capacitance sensor. It consists essentially of a
pair of electrodes which form a capacitor for which the soit acts as dielectric, A free
running oscillator generates an alternative current (AC) field and adjusts to the capacitor
to form a tuned circuit (Eqs. 9, 10, and I l ) . The resonance frequency is then related to
the dielectric pemittivity, and in turn to the soi1 moisture content, by calibration.
A more sophisticated type of frequency-dornain sensor uses the reflectometry
technique to measure dielectric properties of media. This frequencydomain
reflectometry (FOR) sensor operates at a fixed frequency and the signal used is a
sinusoidal wave. FDR sensors generally have the same extended transmission Iine
configuration as TDR probes for which the bulk soi1 a d as dielectric. The frequency of
the transmitted signal is swept under control and the reflection caused by the
irnpedance discontinuity is added to the trançrnitted signal, The voltage standing wave
ratio (VSWR), which is the quanti@ of interest, is then obtained by plotting the reflection
as a function of the swept frequency (htt~:flwww.sowacs.corn/sensorsiwhatistdrfdt.html,
Smit (1996), April2000).
3.1.2.4 Phasedomain sensors: The phase shift of a sinusoidal wave, relative to its
original phase, depends on the len~thof travel, the frequency, and the velocity. When
operating at fixed frequency over a known distance, the phase shift depends only on the
velocity, which is a function of the dielectric properties, and thus of the moisture content
of the surrounding medium (http:lhrvww.sowacç.comlsensorslvimb.html Starr, April
2000). No information conceming techniques used to measure phase shift could be
found in the literature.
3.2 Sensors tested in this research
3.2.1 Tensiometers Two models of tensiometers were included in the studies: the
271OAR and the 2725AR which are both manufactured by Soilmoisture Equipment
Corp. (PO Box 30025, Santa Barbara, CA 93105, USA) and distributed in Canada by
Hoskin Scientific (239 East 6" Ave., Vancouver, B.C.). The only difference between the
two models is the reservoir. We used the 2710AR without a reservoir whereas the
2725AR was equipped with the Jet FiII reservoir cap. The Jet FiII reservoir features a
mechanism that allows for the refill of the stem of the tensiometer and the removal of
accumulated air. Without removing the cap, the water contained in the reservoir is
injected in the stem by pushing the button of the Jet Fill. The flexible reservoir's cover
fits tightly around the button to prevent air from entering the reservoir. 80th models of
tensiorneters can measure soi1 rnatnc potential frorn saturation to approxirnately '85
kPa (Soilmoisture Equipment Corp., 1984) .
3.2.2 Watemark granular rnatrix sensors Watermark granular matrix sensors give
indirect readings of the soil water potential based on measurement of electrical
resistance within a granular rnatnx in contact with the moist soil. The GMS sends an
electrical resistance measurements ranging from 0.5 to 30.0 k R to the rneter which then
converts the value using a prograrnmed calibration function that relates the signal output
to soi1 matric potential. This moisture sensor consists of two concentric electrodes
embedded in a porous matrix. The matnx is composed of loose granular material held
in place with a pemeable membrane covered by a perforated metal case. A solid
gypsum wafer divides the granular material in two sections. In the lower section of the
sensor, the soil solution is allowed to move freely in and out of the sensor. In the upper
section, however, the granular material is isolated from the surrounding soil. This way,
the soil solution has to travel through the lower section and the gypsurn wafer, which will
buffer the effect of salinity, before entering the section that contains the electrodes. The
granular matrix sensor operates on the principles that the movement of water in a
porous medium is a function of the pore sizes of the material and the electrical
resistance of that medium is a function of its water content, which can also be
expressed as water potential. Therefore, the movement of water in a granular matrix
with pore sites still remaining wet similar to that of the surrounding soi1 closely
represents the sail water potential of the soil. The electrical resistance of the sensor is
therefore an indirect measurement of the soi1 water potential, Watermark sensors cover
a range of water potentials from O to 200 kPa (Irrometer Co,, Box 2424, Riverside, CA
92516, USA).
3.2.3 Aquaterr The Aquaterr (Aquaterr Instruments Inc., 3459 Edison Way, Fremont,
CA 94538, USA) is a portable electrical capacitance probe, The electrodes are
encapsulated in the tip of a rigid metal stem attached to the meter. The electrical
capacitance (C) measured at the tip of the instrument is converted in the meter to a
value (R) ranging from O to 100 that is then displayed on the meter, No information
conceming the principle of operation of the Aquaterr was found in the literature. An onsite calibration against moisture content requires that the reading be set to 100 M i l e the
sensing tip is submerged in water. It can therefore be assumed from the calibration
procedure and the colour-mded legend shown on the meter that the C-to-R conversion
is not based on a linear relationship. The conversion function seems to resembles the
calibration curves illustrated in the Aqua-Tel user's manual. Those calibration curves
show that the measured quantity does not Vary a lot for moisture contents approaching
or above soil saturation which is due to the high vatue of the dielectric constant of water
compared to that of soiids and air. Because the geometry of the electrodes is not
revealed by the configuration of the probe, it can only be assumed that the dielectric
properties of the medium are derived from fringe capacitance measurements. The flatshaped sensing tip does not have any opening or gap that would allow for the medium
to be positioned between the electrodes. Furthemore, the exposed portion of the
sensing tip seems to be made of h o coplanar plate-electrodes covered by a protective
polymer which closely match the probe designed by Thomas (1966). The effective
volume of the Aquaterr is not specified in the literature. The effective volume of the
probe, also called the volume of influence, is the volume of the medium surrounding the
sensing device that affects the measurements. The range of operating frequencies of
the Aquaterr is also not specified. Thus, it can only be hypothesised, from the fact that
the readings require calibration against soi1 texture, that the operating frequencies are in
the range where conductivity losses are not negligible, i.e. below 50 MHz.
3.2.4 Aqua-Tel The Aqua-Tel (Automata Inc., 10551 E. Bennett Road, Grass Valley,
CA 95945-7806, USA) is a capacitance sensor. The Aqua-Tel, mode1Aqua-Te194-29,
consists of two parallel electrodes attached to a small electronic module, The 0.83-m
(29 in) long electrodes, made of stainless steel, are flat, which leads to the hypothesis
that the dielectric properties are derived from measurements of fringe capacitance. The
effective volume of the Aqua-Tel sensors is not specified in the literature. As for the
Aquaterr, readings made with the Aqua-Tel require calibration against soil texture which
can demonstrate the effect of conductivity Iosses and thus leads to the assumption that
the operating frequencies are below 50 MHz.
3.2.5 VlRRlB The VIRRIB is a phase transmission sensor that was manufactured in the
Czech Republic and distributed in North America by Environmental Sensors Inc. (PO
Box 720698, San Diego, CA 92172-0698, USA), who seems to have bought the rights to
the technology but are not distributing it anymore. Environmental Sensors Inc. (ESI) is
now manufacturing a TDT sensor, called the GroPoint, that has the same transmission
line configuration as the VlRRlB but is presented as a new product. For that reason, the
principle of operation of the GroPoint given by ES1 cannot, with certainty, be applied to
the VIRRIB. Furthermore, descriptions of the operating principles of the VlRRlB found
in the literature differ from the information conceming the GroPoint. The main
disagreement between the TDT and phase-domain (PD) technique lies in the signal
sent. The TDT method uses a pulse whereas the description of the PD methods implies
that only a sinusoida1wave can be used. In addition, the description given by
Litschmann (1991) does not provide technical information related to the electromagnetic
technique employed. It States that the sensor uses DC current with a voltage of 12 to
20 Volts from an externat source and that the output data is measured by means of a
current loop, for which the intensity of the output is directly proportional to the moisture
content of the surrounding medium.
It reads within a range of O to 55% of water by volume (Environmental Sensors
Inc.). The sensor consists of two rod electrodes shaped as concentric circles with an
outer ring of 0.28 m diameter and an inner ring of 0.20 m diameter. The volume of
influence of the sensor extends to a distance of 0.06 m from the rings in al1 directions.
3.2.6 Thetaprobe The Thetaprobe is a frequencydomain reflectometry (FDR) sensor
manufactured by Delta-T Devices Ltd. in the United Kingdom (128 Low Road, Burwell,
Cambridge CB5 OEJ, England) and is distributed in Canada by Lakewood Systerns Ltd.
(8709,50 Avenue, Edmonton, AB, T6E 5H4). It operates at a fixed frequency of A00
MHz. The sensor consists of a coaxial transmission Iine that extends into the soi1 via the
sensing probes which is formed of four 0.050-m long stainless steel rods, three of
which, positioned in the periphery of the rod transmitting the electromagnetic signal, are
at ground potential. Even if the effective volume of the probe is relatively srnall (a
cylinder of 0,025 rn in diameter and 0.060 m in length accounts for 90% of the influence
on the measurements), holding the probe white taking measurements may affect the
results. Although the Thetaprobe operates at a frequency for which conductivity losses
are minimal, soil-specific calibration is recommended by the manufacturer. In the user's
rnanual, an accuracy of 12% of 0, is specified after soil-specific calibration whereas *5%
of 8, is specified if the supplied calibration factors are used.
4 MATERIALS AND METHODS
4.1 Field study
During the growing season of 1998, we conducted a field experiment to determine the
most suitable methods to measure soil moisture in potato fields under Manitoba
conditions. Moreover, this first trial was intended to help develop a protocol for proper
instailation, calibration, and use of tensiometers, Watermark granular matrix sensors,
the Aquaterr soil moisture meter, Aqua-Tel capacitance sensors, and VlRRlB phase
transmission sensors. At the completion of the field trial of 1998, it was recommended
that a laboratory study under controlled soil moisture conditions be conducted. A first
laboratory trial was therefore carried out during the winter of 1999 following the protocol
for installation, calibration, and use of the sensors established from the first field study.
During the growing season of 1999, another field trial was conducted hoping to obtain
more information concerning the performance of the soil moisture sensors previously
tested. The results from the second field trial, as those from the 1998 trial, were not
conclusive due to soil heterogeneity and high soil moisture variability within the
experimental plot and thus, laboratory testing was resumed in the winter of 2000.
4.1 .lExperimental site description For both seasons, the experiment was carried out
at the Manitoba Crop Diversification Centre in Carbeny, Manitoba. The soil in that area
is from the Ramada senes. For the experimental plots of 1998, the first 0.4 m of the soi1
profile was composed of loam (31-5% sand, 45.2% silt, and 23.1% clay) whereas the
underiying layer, from 0.4 to 0.6 ml consisted of silt loam (20% sand, 54% silt, and 26%
clay). For the 1999 trial, the plot was located in an area where the loam layer was on
average 0.50-m thick. Potatoes (Solanum tuberosum L CV. Russet Burbank) were
grown on hills.
For the first field triai, the sensors were installed on two plots exposed to
different water treatments. Plot A was irrigated when the soi1 moisture content,
monitored with neutron gauges, was Iess than 35% of the available water, which
represented a volumetric water content of approximately 25% whereas plot B was
rainfed. The available water content is the water that can be used by the plant and it is
equal to the difference between the moisture content at field capacity (FC) and at the
permanent wilting point (PWP). Field capacity is the water content that a given soi1
attains after it has been fully saturated and allowed to drain for 2 d. The permanent
wilting point is the water content that a soi1 reaches at the time water extraction by plants
has ceased (Hanks and Ashcroft 1980). For the second field trial, the sensors were
installed on a single plot which was irrigated m e n needed and did not follow any preestablished conditions.
4.1.2 Sensors installation
4.1.2.1 Tensiorneters: In 1998, a total of 17 tensiometers was used for the experiment:
9 on plot A and 8 on plot B. The tensiometers were grouped in sets of three sensors
installed at three different depths, 0.20, 0.30, and 0.50 m below the soi1 surface. This
way, each set covered the whole root zone. A middle-length tensiometer was broken
during the installation. Thus, one set on plot B lacked a meter at the 0.3-m depth. In
1999, 12 tensiometers were used. They were grouped in pairs, installed at 0.25 and
0.45 m below the soi1 surface. Thus, in 1999, al1sensors were tested in loam only.
To install tensiometers, an auger hole with a smaller diameter than the
tensiometers was made to the required depth. The resulting hole was then partially
filled with water and the tensiometer inserted into it. The soi1 surface was lightly packed
around the tensiometer to prevent preferential ffow along the stem.
4.1.2.2 Watermark GMS: In 7498, 18 Watermark sensors were tested whereas only 12
were used during the following season. Before installation, the sensors were soaked in
water, then allowed to dry, and soaked again. The user's manual published by
lrrometer Co. recommends that Watermark sensors be installed wet. The sensors were
installed following the same procedure and pattern of sets as for the tensiometers.
4.1.2.3 Aquaterr: The Aquaterr is a portable probe therefore a single sensor was
required. To take water content readings, the probe was pushed into the soi1 to the
desired depth. A sail auger was used to drill an access hole for measurements at
depths greater than 0.30 m. A measurement immediately followed the drilling of the
required access hole to prevent soi1 moisture loss by evaporation Readings were taken
on each plot following the pattern of sets described for the tensiorneters.
4.1.2.4 Aqua-Tel: For the 1998 expriment, only three Aqua-Tel sensors were used.
They were al1 installed at a depth of 0.20 m. In the imgated plot, two probes were
installed, one with the blades Rat and the other with the blades on the edge or side
position. The last sensor was installed in the side position in the rainfed plot. In 1999,
four probes were used and they were al1 instalied in the side position at a depth of 0.25
m.
To install the Aqua-Tel sensor, a trench was dug to the installation depth. The
sensor was placed at the bottorn of the trench in the desired position. Then, the
opening was filled with soi1 and packed to ensure good contact between the blades and
the soil.
4.1.2.5
VIRRIB: In 1998, four VlRRlS moisture sensors were used. The two VlRRlB
sensors used on each plot were installed in different orientations, buried in the hill either
across or along the rows. In f 999, six sensors were used, al1 installed along the rows.
To cover the whole sensor, a trench 0.30 m deep was dug, the sensor positioned, and
the trench filled.
4.1.3 Data collection In 1998, data were collected over a period of 8 wk on five
occasions for the irrigated plot and on four occasions for the rainfed plot. In 1999, data
were collected on seven occasions over a penod of 25 d. Soil samples for the
gravimetric method were taken following the same pattern of sets described for the
tensiometers, Le. a total of 9 samples were taken. triplicates at each of the three depths.
The location of each set was randomly determined and documented on each occasion
to ensure the sampling of undisturbed soil. The Aquaterr required onsite calibration
against moisture content. The probe was submerged into a bucket of water and the
meter set to 100 between each set of readings. The Watemark sensors required that
soil temperature be measured at the three depths at which the sensors are installed,
which was done by inserting a stainless steel thennometer at proxirnity of the sensors.
Then, the soil temperatures measured at each depth were entered in the meter
accordingly, so that it automatically calibrated the sensor against temperature. The
other moisture sensors did not require any on-site calibration as stated by their
respective manufacturers.
4.2 Laboratory study
4.2.1 Lysimeters
4.2.1.1 Lysirneter design: The lysimeters were designed with hydraulic weighing
systems to facilitate continuous monitoring of the soit moisture content. This design was
preferred to the other weighing systems because of its simplicity and low cost.
The soil container was an open box, consisting of a 1.10 m long, 1.10 m wide,
and 0.27 m deep wooden box with an open bottom. The required dimensions of the
container were selected based on the effective volume of each soil moisture sensor, Le.
the soil region that affects the measurements. To maintain uniformity of moisture within
the soil blocks, the maximum depth of soi1 in the lysimeters was limited to 0.20 m. This
was well below the displacement pressure of the soils selected for testing and thus,
suction-controlled drainage systems were not required. Each wall of the soil container
was made of three pieces of wood (S-P-F N0.2) 0.038-rn thick and 0.089-m wide,
fastened together by means of 0,050-rn long screws. The interior of the wooden frame
was lined with a polyethylene sheet to prevent the wood from absorbing the water from
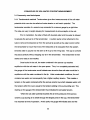
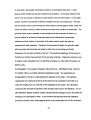
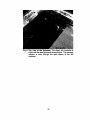
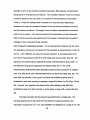
the soil. A steel grate, shown in Fig. 4, was attached to the bottom of the box to support
the weight of the soil. A 0.013 m mesh acrylicgrid, 0.013 m thick, was placed on the
steel grate as a support for the permeable fibreglass mesh. The fibreglass mesh
prevented the soi1 from passing through the acrylic grid while allowing for good drainage
and air exchange through the bottom. The soi1 block wuld dry both from the top and
bottorn surfaces.
Another wood box, on which the sail container descnbed above rests, wnstituted
the drainage collector. One side of the box had an 0.14-rn high opening along its entire
length to provide an exit for the drained water as well as a channel for air to circulate
through the soil. A polyethylene sheet collector stapled to the bottom of the soil bin,
intercepted the water draining from the soi1 and led it outside the lysimeter. This was
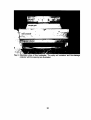
done to ensure that al1 water within the lysimeter remained within the soil. Figure 5
shows the lysimeter from the top looking through the empty soif container into the
drainzge collector. An elevation view showing the opening of the drainage collector is
also shown in Fig. 6. The bottom wooden frarne was fastened to a sheet of plywood
which acted as a base. The base provided more stabilii to the structure and unifomly
35
Plan view
Fig. 4 Top view and elevation vie-# of the steel grate. The top view also
illustrates the dimensions of the soi1 block.
Fig. 5 Top view of the lysimeter. The empty soi1 container is
shown with the steel grate and the acrylic grid. The drainage
collecter is seen through the open bottom of the soi1
container.
Fig. 6 Elevation view of the lysimeter. The empty
. - soi/ container and the drainarie
collecter with the openhg are illustrated.
distrïbuted the weight of the lysimeter on the hydraulic load cell.
The weighing system consisted of a hydraulic load cell connected to a
manometer. The manometer was indined to increase the precision of the weighing
system. An angle of 15"from the horizontal was selected because it increased the
precision of the lysimeter by a factor of four. An inner tube filied with water was used as
the hydraulic load cell. The inner tube was made of butyl rubber and had an outside
diameter of 0.915 rn and an inside diameter of 0.485 rn when totally deftated.
4.2.1.2 Lysimeter calibration: A calibration of the weighing system was required to
establish a relationship between the mass of the fysimeter and the fîuid pressure inside
the hydraulic load cell. First of all, the weighing system was calibrated by placing
weights of known mass incrementally on the lysimeter, up to the estimated soi1 mass at
saturation, to verify the Iinearity of the relationship. We found that an increase in mass
of the Iysimeter of 5 kg caused an increase of pressure inside the load cell
corresponding to 52 mm in height of water column on the manorneterfor both
lysimeters. The precision of the weighing system was then determined in terrns of
variation of soi1 moisture content (AB,), in percentage, for a change of 1 mm in height of
water colurnn by first calculating the A0, corresponding to adding 5 kg of water to the
lysimeter and üten, by dividing de, by the change in height of water column caused by
such a variation in mass, Le. 52 mm. The precision thereby calculated for both
lysimeters was a Ag, of 0.4% per mm of water column height To assess the long-tenn
stability of the weighing system, maximum loading of the lysimeter was maintained over
a period of 96 h followed by a 96-h period without any load. The stability test showed
that the fluid pressure inside the hydraulic load ceII tended to decrease over time under
maximum Ioading whereas it tended to increase over time under no Ioading. This
drifting effect was attributed to the stretching and shrinking of the load cell membrane.
Variations of the ambient conditions, such as temperature and atmospheric pressure,
also had an effect on the precision of the weighing system. Those factors, however,
could not be controlled and thus were considered part of the experimental error. The
calibration was also verified by measuring the actual soii water content by gravimetric
sampling at three locations within the soi1 block on several occasions during the course
of the study. Gravimetric sampling was done on five occasions during the lysimeter
study of 1999 and on four occasions during the trial of 2000.
4.2.1.3 Soi1 blocks: The lysimeters were filled with soi1 brought from the field site, i.e.
loam and silt loam from the Rarnada series, that had been air dried and sieved through
a 0.01-m mesh. The filled-in method was used for reconstituting the soi1 blocks.
Uniform bulk densrS, was achieved by packing the soi1 in the container in small equal
sized Iifts thereby providing homogenous hydrological conditions for testing of the soil
moisture sensors. Layers of toose soil, approximately 0.05-m deep, were packed
consecutively using a 0.75-m long piece of lumber, 0.038-m thick and 0.178-m wide, on
which the experimenter applied pressure. Pressure was applied uniformly by
systematically placing the lurnber on an area of Ioose soii, by stepping on it 50 times.
and by repeating this process unti! the soi1 of the entire surface area of the lysirneter
was packed. For the first laboratory trial, wnducted in 1999, only one lysimeter was
used. The lysimeter was fiiled with toam packed to a dry bulk density of 1190 kglm3.
Both lysimeters were used for the laboratory trial of 2000. Because the soi1 contained in
the lysimeter used in the trial of 1999 had k e n disturbed by the removal of the sensors,
the loam was packed once again. The dry bulk density reached was 1150 kg/m3. The
second iysimeter was filled with silt loam packed to a dry bulk density of 1250 kglm3.
The soil bulk density was deterrnined by monitory the mass of soi1 used to fil1 the soil
box and measuring the depth of soil in the box once it was filled. Then, knowing the
surface area of the soil container, p, was calculated using the following equation:
where:
ms
= mass of dry soi1 in the soi1 container (kg),
A
= surface area of the soi1 container (= 1.21 mZ),
h
= depth of dry soi1 packed in the soi1 container (m).
Prior to each trial, the soi1 blocks were slowly saturated and allowed to equilibrate
for 72 h. During the trials, between testing, air was blown through the bottom of the soi1
container to increase the drying rate. After each fandrying period, which never
exceeded 2 h in duration, the soil was left to dry at ambient conditions, i.e. without
forced aeration. Each drying period was followed by an equilibration period of at feast
12 h during which the lysimeter was covered with a polyethylene sheet to prevent
evaporation.
4.2.2 Sensors installation and calibration Three sensors of the tensiometers,
Waterrnark GMS, and VlRRlB probes were installed in each of the lysimeters used in al1
the trials. Three Aqua-Tel probes were installed in the loam lysimeter for both trials.
The spatial arrangement of the sensors in the lysimeters is shown in Fig. 7. The
Aquaterr, which is a portable probe, was used for al1 trials and the grey area s h o w in
Fig. 7 was assigned for its testing. The Thetaprobe, which was also used as a portable
probe, was introduced in the trial of 2000 and was tested in the sarne area assigned to
the testing of the Aauaterr- The VlRRlB and the Aaua-Tel probes were installed at a
A-Lwm-
0 - Silt Loam -
Fig. 7 Spatial arrangement of the soi1moisture sensors inside the soi1container
of the lysimeter (top view). The area reserved to tensiometers (T),
Watennark GMS 0,
and VIRRIB sensors Mis identified with the darker grey
whereas the area allocated for testing the portable probes (Aquaterr and
Thetaprobe) is in Iighter grey. The Aqua-Tel sensors (Al) were instailed only
in loam.
depth of 0.1O m while filling the soi1 container as presented in Fig. 8. The VlRRlB
sensors were installed horizontally and the Aqua-Tel sensors were installed on the side.
The tensiometers and GMS were installed at a depth of 0.13 m in saturated soil,
following the procedure described in section 4.1 -2.1.
Prior to the lysimeter study of 2000,the VlRRlB probes were calibrated in each
s o t Although the VlRRlB probes had been calibrated during the manufacturing
process, a soil-specific calibration would likely improve their performance. After the
sensors had been installed in dry soil, a first reading was taken with each probe and the
actual volumetric water content of the soi1 was determined by gravimetric sampling and
converted using Eq. 1. Then, the soi1 was saturated and a second reading was taken as
well as the actual volumetric water content. The setting value, SV, was then calculated
as follows:
SV = (F, - F,). K
where:
FI
= sensor's reading in dry soi1 (m3/m3),
F2
= sensor's reading in wet soit (rn3/m3),
W,
= volumetric water content of the dry soi1 (m3/m3),
W2
= volumetric water content of the wet soi1 (m3/m3),
K
= constant (dimensionless).
The output signal of each sensor is then adjusted to its respective setting value by
43
Fig. 8 Top view of the half-filled lysimeter. The installation position of the
VlRRlB and Aqua-Tel sensors are shown.
tuming the resistive trimmer capacitor labelled 'OFFSET, located on the back of the
sensing probe. To access the "OFFSET button, a trench was dug to uncover the
electronic module without uncovering the rods of the probe. The protective seal was
open and the setting value was set by tuming the button using a screw driver. The
second resistive trimmer capacitor, labelled 'AMPLIFICATION", which is also located at
the back of the sensing probe on the electronic module, was used to adjust the signal
gain by setting the probe's reading to the actuat volumetric water content, W,. Finally,
the "OFFSET and "AMPLIFICATION" buttons were filled with caulking paste and
covered with electrical tape to prevent moisture frorn entering the electronic module.
4.2.3 Data collection Data were collected 24 times over a period of 34 dl in 1999, and
17 times over a period of 51 d, in 2000. The location where each reading was taken
with the portable probes, Le. Aquaterr and ThetaProbe, as well as each sampling
location was randomly chosen and documented to ensure that measurements and
samples be taken in undisturbed soil. Watemark GMS and the Aquaterr were
calibrated as described in section 4.1.3. To follow the recommendationsmade in
conclusion of the field study, a period of 90 s was allowed for temperature equilibration
before each Aquaterr reading. Furthermore, the temperature of the water used for
calibration was monitored and kept within 3 O C of the soi1 temperature. A voltmeter and
a power supply were used with the ThetaProbe instead of a data logger. Once the
probe had k e n inserted into the soil, an input voltage of I O V DC at about 19 mA was
provided to the probe and the VSWR read by the probe was displayed on the voltmeter
and manually recorded. Although Delta-T Devices Ltd stated that for complete stability
a warrn-up time of 5 s is sufficient, a period of 90 s was allowed for stabilization for each
measurement.
4.3 Data conversion
The readings obtained with the sensors required conversion to a unit of reference, which
in this case was volumetric water content.
4.3.1 Tensiometers and Watermark granular matrix sensors Tensiometers and
Watermark GMS gave soi1 matric potential readings, in cBar and kPa, respectively.
Those soi1 moisture tension measurements were converted to volumetric water contents
using the soi1 moisture characteristic curve for the particular soi1 at a given soi1 bulk
density (Figs. 9, 10, and 11).
4.3.2 Aquaterr The Aquaterr's readings also had to be converted to volumetric water
content, 0,. The relationship between the meter's readings, R, and 0, was established
for each soi1 at different bulk densities based on the soil-specific moisture characteristic
curves previously detemined and the data provided by Aquaterr Instruments Inc. The
R-values at different moisture conditions estimated from the information provided in the
user's manual are presented in Table 1.
Table 1. R-values for the Aquaterr at different moisture conditions.
Loam
Silt Loam
R(saturati0n)
1O0
100
R(field capacity
93
95
R(pennanent wilting point)
25
30
The R-values were then correlated to the corresponding volumetric water contents using
the soi1 moisture characteristic curves of each soi1 at each soi1 bulk density. Assuming a
linear relationship, readings obtained with the Aquaterr were converted to volumetric
water content by interpolation as follows:
for R>R(FC),
for R(PWP)5 R<R(FC),
eV = 0"(PWP) + (R - NPWP))
0"(FC) - Ov(PW P)
R(FC)- R(PWP)
and for R<R(PWP),
where:
w@)
= R(saturation) referred to in Table 1,
= meter's reading at saturation (dimensionless),
WC)
= R(field capacity) referred to in Table 1,
= meter's reading at field capacity (dimensionless),
R(PWP)
= R(permanentwilting point) referred to in Table 1,
= meter's reading at permanent wilting point (dimensionless),
eV(@>
= volumetric water content of the sail at saturation (m3/m3),
ev(Fc)
= volumetnc water content of the soit at field capacity (m3/m3),
&(PWP)
= volumetric water content of the soil at permanent wilting point
(m3/m3).
50
1O0
150
capillaiy pressure (kPa)
Fig. 9 Soil moisture characteristic curve for Loam with p,=ii90 kglm3.
0
50
100
150
capitlary pressure (kPa)
200
Soil moisture characteristic curve for Loam with
pb=li50 kglm3.
Fig. 10
O
50
100
150
capiIlaty pressure (kPa)
200
4.3.3. Aqua-Tel A calibration equation was developed to convert data collected with the
Aqua-Tel capacitance sensors to volumetric water content. The equation was
established from a statistical analysis of the numencal values derived from soil-specific
curves published by Automata Inc. We found, from the statistical analysis of the
calibration curves presented in the user's manual, that the volumetric water content
value,
O,, was dependent only on the meter readings, R, and the proportion of sand (%),
S, with a significance of 97% (R=0.976). This relationship is expressed by the following
equation:
8, = - 2 . 6 9 8 + 6 6 . 2 3 7 ~ - 1 7 0 . 0 0 3t~154.1
~ 97R4i 4 . 2 5 7 ~ o
1 - S4
~
(19)
4.3.4 VlRRlB Data obtained with the VIRRIB phase transmission sensors did not
require conversion; readings were directiy displayed in volume fraction units.
4.3.5 ThetaProbe The voltage standing wave ratio (VSWR) measurements obtained
with the ThetaProbe were converted to volumetric water contents by first correlating the
voltage output read on the voltmeter, V, to the apparent dielectric pemittivity of the bulk
soil, E , which was then correlated to 8,. The square root of the apparent dielectric
permittivity, JE,was correlated to V using the following third degree polynomial equation
provided by Delta-T Devices Ltd:
= 1.07 t 6.4V - 6.4V2 t 4.N3
where:
V
= VSWR (mV).
The volumetric water content,
eV,was correlated to JEas follows:
where:
a, a,
= soil-specific constants (dimensionless).
To determine a, and a,, the probe was inserted into dry soil, a VSWR measurement was
taken, V,, and the volumetric water content of the dry soil,
fl,, was determined by
gravimetric sampling followed by conversion using Eq. 1. A first Jevalue was obtained
from Eq. 20, which was then substituted in Eq. 21, for which 0, was equal to 8,. The
probe was then inserted in wet soil, a second VSWR measurement, V,, was taken, and
the volumetric water content of the wet soil,
O,, was detemined. A new Je-value was
calculated with Eq. 20 and substituted in Eq. 21, for which 8, was replaced by 0,. The
values used to calculate the constants a, and a, are shown in Table II. Finally, the two
equations were solved to obtain values of a, and a, for each soi1 (Table III).
Table II. Measured values used to calculate a, and a, for loam and silt loam.
Loam
0.1 277
4.372
0.8747
39.304
Silt Loam
0.1 373
4.031
0.8820
41.506
Table III.Calculated constants, a, and a, of Eq. 21, for loam and silt loam.
Loam
Silt Loam
5 RESULTS and DISCUSSION
5.4 Field study
For both field trials, the standard error of the volumetric water content measurements
obtained by gravirnetnc sampling exceeded 8%. which was attributed to the
heterogeneity of the soi1 properties, such as bulk density (p,), soil structure, and
moisture conditions, within each experimental plot. We observed that soi1 moisture
contents also vaned within small sampling areas due to variation in soi1 moisture intake
by plants and variations in evaporation from the soil surface due to the irregular
coverage by potato plant canopy. Since the gravimetnc method was used as a
reference to evaluate the performance of the sensors, this wide variability in soil
moisture contents led us to question the validity of the field study results.
Furthemore, we questioned the validity of the field study with regards to the
testing conditions required for the Aquaterr probe, Aqua-Tel sensors, and VlRRlB
sensors. These sensors required uniforrn soi1 conditions within their effective volume in
order to give measurements representative of the surrounding soil, Consequently, the
presence of roots, potato tubes, and air pockets in the proximity of these probes
caused erroneous measurements. The erosion resulting from an intense rain or water
application also contributed to the disturbance of the soi1 along the slopes of the growing
hills, creating air gaps and sometimes exposing the soi1 moisture probes.
Finally, due to the high amount of precipitation received dunng the growing
seasons of 1998 and 1999, the performance of the sensors could not be evaluated over
a wide range of soi1 moisture contents in the field study. Consequently, we decided that
the field study was inconclusive and that further testing, under controlled soi1 and water
conditions, was required. An example of the field results is s h o w in Fig. 12.
Actual volumetrfc water content {%)
Fig. 12
Results from the field study of 1998 in Loam, in the rain fed
experimental plot Horizontal error bars illustrate the 95%
confidence intenraI calculated on the average of three 8,
measurements obtained with gravirnetric sampling. Vertical error
bars show the 95% confidence interval calculatedon the average
of three 8, rneasurernents obtained with the sensors (when no
error bar, only one 0, is represented). The thin lines offset frorn
the 1:1 Iineshows the maximum standard errorcalculated for the
gravimetric method.
5.2 Lysimeter study
5.2.1 Experimental design ln the 2000 test, al1 sensors responded to variations in soi1
moisture content within their specified operational lirnits except for the VlRRlB sensors .
If the method or, in other words, the principie of operation alone had been the focus of
the experiment, we could have concluded that al1 those sensing methods were adequate
to measure soi1 rnoisture variations. However. the objective of this experiment was to
evaluate the performance of various soit moisture sensors with regard to accuracy;
precision; quickness of the response to rnoisture variation; and ease of use, which
encompasses installing and operating the instrument as well as interpreting the
readings. The main difficulty of evaluating the performance of the sensors was in
understanding the readings obtained with the instruments. In rnost cases, the readings
had to be converted to a meaningful soil-water value that can be used for calculating the
imgation water requirements. Furthemore, the assessrnents of an instrument's
accuracy and precision were based on the converted quantities, Le., soi1 rnoisture data.
In sorne instances, the conversion required other soi1 properties that were difficult to
measure reliably, thereby, adding the error caused by the conversion process to the
errors attributed to the sensor.
Over the entire course of the expenment, tensiometers, Watermark GMS, VlRRlB
sensors, and the Aquaterr were tested over two drying cycles in loam (in 1999,
volumetric water contents (0,) ranging from 34.0 to 17.0%;in 2000, 0, ranging frorn 43.1
to 20.0%) and over one drying cycle in silt loam (in 2000,8, from 45.8 to 19.5%). The
Aqua-Tel probes were installed in loam only for both years whereas the Thetaprobe was
tested in both lysimeters but only in the trial of 2000. Because the response tirne, i.e.,
the tirne required by an instrument to respond to a moisture variation, is essential in
field applications such as imgation scheduling, an experiment designed over short
hydrologie cycles would be required to assess the adequacy of the sensors for real-time
field applications. As stated in the literature for the Watermark sensors, some
instruments might not respond to partial rewetting (McCann et al. 1992). Becauçe this
experiment was designed to test the sensors under uniform soi1 moisture conditions, it
was assumed that a 12-h period between drying periods was sufficient for the system to
reach equilibrium; thereby, assuming that al1 instruments had sufficient time to respond
to the moisture depletion.
5.2.2 Calibration of the weighing system Because the calibration relationship is a
direct conversion of the height of the water column on the manometer to the voiumetric
water content, its accuracy is affected by variations of the ambient conditions, i.e.,
temperature and atmospheric pressure; fluctuation of the load cell volume; and soi1
moisture variation within the lysimeter.
To lessen the effect of the fluctuation of ambient temperature, the readings were
taken around the same time of day on each occasion at the proximity of the lysimeters,
using a mercury thennometer. The ambient temperature varied from 18 to 25 OC for the
trial of 1999 and from 19 to 25 ' C for the trial of 2000. Fluctuations of atmospheric
pressure have a direct effect on the height of the water column due to the surface area
of the lysimeter compared to the surface area of the water column. Stretching and
shrinking of the load cell membrane, as it was observed during the calibration of the
fysimeter, also affected the pressure read on the manometer. Pnor to the trial, a 72-h
period was allowed for equilibration of the soil moisture conditions and thus, this time
period was assumed sufficient for the membrane to stabilize. Furthemore, the
calibration relationship was compared periodicaliy with gravirnetric sampling of the soil
from the lysimeter.
55
5.2.3 Accuracy and precision of the sensors The term accuracy means the
conforrnity of an indicated value to an accepted standard or true value (CSA 1979). The
term precision means the quality of being sharply defined or stated (CSA 1979), it can
also be defined as the repeatability of the measurernent. Sensors' readings were
compared with soi1 moisture contents determined with the lysimeters. The volumetric
water content measurements obtained with the various sensors, expressed as a
percentage and labelled sensors 8,,were plotted against the volumetric water contents
derived from the hydraulic weighing system of the lysirneters, also expressed as a
percentage and labelled lysimeter 0, (Figs. 13a to 28).
ln the present study, the accuracy of an instrument is an evaluation of the
to the soi1 moisture content
conformity of the 8, obtained with the sensor, sensors €IV,
measured with the lysirneter, Iysimeter 0,. The assessment of accuracy was based on
the 95% confidence interval of the linear regression performed on the $ measured with
the sensors (Figs. 13a to 24b, 27, and 28). Measurements were qualified as very
accurate in a given 8, range when the 1:l line was contained within the dashed lines
delimiting the 95% confidence interval of the Iinear regression. For cases where the 1:I
line did not fall within the 95% confidence interval of the Iinear regression but the data
points or the error bars were touching the 1:l line, the measurements were qualified as
accurate. Finally, the measurements were qualified as inaccurate in a given 8, range
when these conditions were not met.
The precision of a sensor was assessed based on the 95% confidence interval
calculated for each data point illustrated by the error bars in S. 13a to 24b, 27, and 28.
The precision was qualified as excellent when the error bars corresponded to a range of
8, of less that 2% for most data points over the entire drying cycle; as very good when
the error bars covered a range of 8, of less that 4%; as good when they represented a
56
15
20
25
30
35
40
45
Actual eV
Fig. 13a
Tensiometers results in loam of p,= 1190 kglm3.
Volumetric water content, in percentage, measured with
tensiometers as a function of 8,. in percentage, obtainedwith
the lysimeter. Each data point represents the mean of the
0;measurements from three difïerent sensors. The error
bars represent the 95% confidence interval based on the
three measurements. The thick Iine illustrates the Iinear
regression and the dashed Iine represents the 95%
confidence interval for the linear regression.
Actual 8"
Fig. 13b
Tensiometers results in loam of p,= 1190 kglm3
(modified). Modified version of Fig. 13a for which data
points were excluded when at least one of the three
tensiometers had reached its operational limit or had failed.
Tensiometei
20
2000, Loam
15
15
20
25
30
35
40
45
50
55
Actual O,,
Fig. 14a
Tensiometers results in loam of p,= 1150 kglm3.
Volumetric water content, in percentage, measured with
tensiometers as a function of e,obtained, in percentage, with
the lysirneter. Each data point represents the mean of the
8,-measurements from three different sensors. The error
bars represent the 95% confidence interval based on the
three measurements. The thick Iine illustrates the Iinear
regression and the dashed Iine represents the 95%
confidence interval for the linear regression.
Fig. 14b
Tensiometers results in loam of p,= 1150 kglmJ
(modified). Modified version of Fig. 14a for which
data points were excluded when at least one of the
three tensiometers had reached its operational limit
or had failed.
:
I
-
1
1
Tensiometet
2000, Silt Loam
l " " l " " l ' ' " l " ' ' I ' ' " I ' ' ' r .
Fig. 15a
Tensiometen results in silt loam of p,= 1250 kglmJ.
Volumetric water content measured with tensiometers, in
percentage, as a function of 0, obtained with the lysimeter,
in percentage. Each data point represents the mean of the
0,-measurements from three different sensors. The error
bars represent the 95% confidence interval based on the
three measurements. The thick Iine illustrates the linear
regression and the dashed line represents the 95%
confidence interval for the Iinear regression.
I
I
I
I
Tensiometer
2000, Silt Loam
l " ' ' l ' E r ' l ' " ' l " ' ' l " " I " " [ " ' '
Actual €IV
Fig. 15b
Tensiometers results in silt loam of p,= 1250 kg/mt
(modified). Modified version of Fig. 15a for which data
points were excluded when at least one of the three
temiorneters had reached its operational limit or had
failed.
/
1999, Loam
l " " l " " i " ' r l " ~ ' i " " l " "
Fig. 16
Watermark results in loam of p,,= 1190 kglm3.Volumetric
water content measured with Watemark GMS, in
percentage, as a function of 8, obtained with the Iysimeter,
in percentage. Each data point represents the mean of the
0~rneasurementsfrom three dÏÏerent sensors. The error
bars represent the 95% confidence interval based on the
three measurements. The thick Iine illustrates the linear
regression and the dashed line represents the 95%
confidence interval for the linear regression.
Fig. 17a
Watermark OMS results in loam of p,= 1150 kglml.
Volumetric water content measured with the sensors, in
percentage, as a function of 0, obtained with the lysimeter,
in percentage. Each data point represents the mean of the
8,-measurements from three different sensors. The error
bars represent the 95% confidence interval based on the
three measurements. The thick line illustrates the linear
regression and the dashed line represents the 95%
confidence interval for the linear regression.
Fig. 17b
Watermark GMS results in loam of p,= 1150 kgIm3
(modified). Modified version of Fig. 17a for which Ymeasurements below 1O kPa were rejected.
55
50
45
24
O
V)
35
E
4
30
25
20
Watennark
15
Fig. 18a
Watemark GMS results in silt loam of p,= 1250 kglm5.
Volumetric water content measured with the sensors, in
percentage, as a function of 0, obtained with the lysimeter,
in percentage. Each data point represents the mean of the
8,-measurements from three diierent sensors. The error
bars represent the 95% confidence interval based on the
three measurements. The thick Iine iilustrates the linear
regression and the dashed line represents the 95%
confidence interval for the linear regression.
15
20
25
30
35
40 45
50
55
Actual 0,,
Fig. 18b
Watemark GMS results in silt loam of ph= 1250 kglm3
(modified). Modified version of Fig. 18a for which Vimeasurements below 10 kPa were rejected.
15
20
25
30
35
40
45
Actual &
Fig. 19
Aquaterr results in Ioam of p,= 1190 kglm3.Volumetric
water content measured with the probe, in percentage, as a
function of 8, obtained with the lysimeter, in percentage.
Each data point represents the mean of the 8,measurements taken at three diierent locations with the
portable device. The error bars represent the 95%
confidence interval based on the three measurements. The
thick line iltustratesthe linearregressionand the dashed line
represents the 95% confidence interval for the linear
regression.
Fig. 20
Aquaterr results in Ioam of p,= 1150 kglm3. Volurnetric
water content measured with the probe, in percentage, as a
function of 8, obtained with the lysimeter, in percentage.
Each data point represents the mean of the 8,measurements taken at three different locations with the
portable device. The error bars represent the 95%
confidence interval based on the three measurements. The
thick line illustratesthe Iinearregression and the dashed line
represents the 95% confidence interval for the linear
regression.
Fig. 21a
Aquaterr results in silt loam of p,= 1250 kglm3.Volumetnc
water content measured with the probe, in percentage, as a
function of 8, obtained with the lysimeter, in percentage.
Each data point represents the mean of the 8"measurements taken at three different locations with the
portable device. The error bars represent the 95%
confidence interval based on the three measurements. The
thick Iine illustratesthe Iinear regression and the dashed line
represents the 95% confidence interval for the Iinear
regression.
Actual O,,
Fig. 21b
Aquaterr results in silt Ioam of p,= 1250 kglmJ
(modified). Revised version of Fig. 21a for which
readings exceeding 100 were rejected.
Actual By
Fig. 22
Aqua-Tel sensors results in loam of p,= 1190 kglm3.
Volumetric water content measured with the sensors, in
percentage, as a function of 0, obtained with the lysimeter,
in percentage. Each data point represents the mean of the
0,-measurements from three diierent sensors. The error
bars represent the 95Oh confidence interval based on the
three measurements. The thick Iine illustrates the linear
regression and the dashed line represents the 95%
confidence interval for the Iinear regression.
Fig. 23
Aqua-Tel sensors results in loarn of p,= 1150 kglm3.
Volumetric water content measured with the sensors, in
percentage, as a function of 8, obtained with the lysimeter,
in percentage. Each data point represents the mean of the
B;measurements frorn three different sensors. The error
bars represent the 95% confidence intenral based on the
three measurements. The thick Iine illustrates the Iinear
regression and the dashed Iine represents the 95%
confidence interval for the Iinear regression.
10
15
20
25
30
35
40
45
Actual
Fig. 24a
VlRRlB sensors results in loam of p,= 1190 kg/m3.
Volumetric water content rneasured with the sensors, in
percentage, as a function of 0, obtained with the lysimeter,
in percentage. Each data point represents the mean of the
8,-measurements from three different sensors. The error
bars represent the 95% confidence inteml baseci on the
three measunments. The thick line illustrates the Iinear
regression and the dashed line represents the 95%
confidence interval for the linear regression.
Fig. 24b
VlRRlB sensors results in loam of p,= 1190
kglm3(modified). Modified version of Fig. 24a: each data
point represents a single &measurement taken with a
sensor.
Fig. 25
VIRRIB sensors results in loam of ph= 1150 kgIm3.
Volumetrïc water content rneasured with a sensor, in
percentage, as a function of 0, obtained with the
lysimeter, in percentage. Each data point represents a
single 0,-measurement taken with a sensor.
15
20
25
30
35
40
45
50
Actual O,,
Fig. 26
VIRRIB sensors results in silt loam of p,= 1250 kglm3.
Volumetric water content measured with a sensor, in
percentage, as a function of 8, obtained with the
lysimeter, in percentage. Each data point represents a
single Bymeasurement taken with a sensor.
Fig. 27
Thetaprobe sensor results in loam of p,= 1150 kglm3.
Volumetrie water content measured with the probe, in
percentage, as a function of 8, obtained with the lysirneter,
as percentage. Each data point represents the mean of the
8,-measurements taken at three different locations with the
portable device. The error bars represent the 95%
confidence interval based on the three measurernents. The
thick line illustratesthe linear regression and the dashed line
represents the 95% confidence interval for the Iinear
regression.
IO
15
20
25
30
35
40
45
50
Actual
Fig. 28
Thetaprobe sensor results in silt loam of p,= 1250 kglm3.
Volumetric water content measured with the probe, in
percentage, as a function of 8, obtained with the lysimeter,
as percentage. Each data point representsthe mean of the
8,measurements taken at three different locations with the
portable device. The error bars represent the 95%
confidence interval based on the three measurements, The
thick line illustratesthe linear regression and the dashed line
represents the 95% confidence interval for the Iinear
regression.
range of 8, of 6% or less; and as poorwhen they corresponded to a range of 8, greater
than 6%.
During the first lysimeter trial, tensiometers, Watermark sensors, the Aquaterr
soil moisture meter, Aqua-Tel sensors, and VIRRIB sensors were tested in loarn with a
p, of 1190 kg/rn3over one drying cycle for moisture contents ranging from 34.0 to
17.0% (Figs. 13a, 13b, 16, 19, 22, 24a, and 24b). The standard errors calculated on the
lysimeter O,, Le. the volumetric water content obtained by gravimetric sampling used to
calibrate the lysirneter readings, did not exceed 0.6%During the lysimeter trial of 2000, the performance of tensiorneten, Watermark
sensors, the Aquaterr soi1 moisture rneter, Aqua-Tel sensors, VIRRIB sensors, and the
ThetaProbe FDR sensor was evaluated in toam with a p, of 1150 kglm3over a range of
moisture contents frorn 43.1 to 20.0°/6 (Figs. 14a, 14b, 17a, 17b, 18, 23, 25, and 28).
The standard errors calculated on the Iysimeter 8, did not exceed 1.2% except for the
first sampling event where it was 5.5%. The performance of tensiometen, Watermark
sensors, the Aquaterr soil moisture meter, VlRRlB sensors, and the ThetaProbe FDR
sensor was also assessed in silt loam with a p, of 1250 kg/m3for moisture contents
ranging frorn 45.8 to 19.5% (Figs. 15a, 15b, 18a, 18b, 21a, 21b, 26, and 28). The
standard errors calculated for the lysimeter 0, did not exceed 0.3%.
Each of the data point shown in Figs. 13a. 13b, 14a, 14b, 15a, 15b, 16, Va,
17b. 18a. 18b, 22,23,and 24a represents the average of the 0,nieasurements from
three different sensors. In Figs. 19, 20,21 a, 21b, 27, and 28, each data point
represents the mean of 8v-measurementstaken with one of the portable probes, Le.
Aquaterr or ThetaProbe, at three diierent locations within a lysimeter on a given
occasion. The error bars represent the 95% confidence intervat based on the three
measuremenis for eacn type of sensor. Whenever the error bar is not visible in Figs.
80
13a, 13b. 15a. 15b, 16,17a, 18a, 18b. 19.20,and 28, the symbol is larger than the
error bar itself. The tinear regression, represented by the thick line, was done on the
average of the three 8"measurements taken on each occasion for each type of sensor. The dashed line
represents the 95% confidence interval for the linear regression.
In Figs. 24b, 25, and 26,each data point represents a single 0,-measurement
taken with a sensor on a given occasion, which explains why there is no error bar.
Moreover, in Fig. 24b, the Iinear regression was done for the 6,-measurernents taken
with each sensor, giving three linear regression lines. No linear regression was
perfonned in Figs. 25 and 26 since the sensors response was not iinear over the entire
range of soi1 moisture contents.
As mentioned earlier, the challenge of evaluating the performance of soi1
moisture sensors lied mostly in the task of understanding the readings obtained from the
various instruments, which in many cases required conversion to more meaningful soilwater information. The conversion can require several steps that are for some
instruments perfonned in part by the device but mostiy requires that the user be familiar
with the quantity displayed by the meter, which in itself might require conversion. All
these conversions may induce error that has to be considered when evaluating the
performance of the various soil moisture sensors,
5.2.3.1 Tensiometers and Watennark GMS: The ermeasurernents obtained with the
tensiometers are compared with the lysimeter 8;measurements
in Figs. 13a to 15b;
Figures 73a, I4a, and 15a present the wmplete data collecteci during the iysimeter
studies whereas Figs. 13b, 14b, and 15b are the respective modified versions for which
some data points were excluded. A data point was rejected when at least one of the
three water tension readings did not show a decrease of soi1 moisture content because
81
it meant that at least one of the tensiometers had reached its Iimit of operation and had
released water from the ceramic cup thereby increasing the moisture content of the soi1
in the vicinity.
For the 1999 trial, tensiometers measured 6, accurately over the 23 to 30%
range, for which the measurernents were qualified of very accurate in the 26 to 30%
range based on the 95% confidence interval of the linear regression (Fig. 13b). The
tensiometers tended to overestimate 0, above 30% and they did not respond to
moisture change below 23%, which corresponded to their operational limit of -85 kPa.
In the 2000 trial, tensiometers mainly overestimated $ in both lysimeters, Le. in both
soils. In Fig. 14b, the regression line shows that the difference between the
tensiometers 8,-measurements and the Iysimeter 8, increased with soi1 moisture.
Accurate measurements were obtained in the narrow 25-28% range whereas a
divergence of as much as 18% was obsewed for lysimeter 8, of 38%. In silt loam, the
regression line is offset from the 1:1 line by iess than 3% at Iysimeter 8, of 27% and by
7% at 45%.
The variability of the tensiometers $-measurements was generally small for al1
trials, illustrated by error bars wvering on average a 8, range of less 4%, and thus, we
found the tensiometers to have very good precision. A few data points, however, show
large error bars in the 2000 trial: two data points for loarn (Ftg. i4b) and one for silt loam
(Fig. 15b).
The 8v-measurementsobtained with the Watermark GMS are wmpared with the
lysimeters 6,-measurements in Figs. 16 to 18b. Figures 17b and 18b are modified
versions of Figs. 17a and 18a, for which measurements of soi1 matric potential (V)
below 10 kPa were rejected. The first three data points were discarded for both trials in
2000, i-e. in Ioam and silt loam, because it had been obsewed that Watermark sensors
82
do not respond linearly to changes in soi1 moisture in the 0-10 kPa range [Phene et al.
1989), which correspond to 8,-values above 55% in Ioam and above 50% in silt loam.
Granutar matrix sensors gave accurate readings in Ioam for the 1999 trial in the
20-26% range and slightly overestimated 0, below and above that range.
The
regression line is offset from the 1:iIine by less that 3% (Fig. 16). In 2000, the 8,measurements obtained with the OMS in both soils followed the same trend as
observed for tensiometers, mainty overestimating 0, In Fig. 17b, the regression line
shows that the difference between the sensors 8,-measurernents and the Iysimeter 8,
increased with soi1 moisture. Accurate rneasurements were obtained in the narrow 20-
23% range whereas a divergence of as much as 20% was observed at lysimeter 0, of
34%. ln silt loam, the difference between the sensors 8,-measurernents and the
lysimeter 0, also increased with soi1 moisture; the regression Iine is offset from the 1:1
line by 5% at 8, of 20% and by 9% at 45%.
The precision of the Watemark sensors was very good for al1 trials. A few data
points, however, show error bars of about 5% in magnitude in Ioam: three data points in
the 1999 trial (Fig. 16) and four in the 2000 trial (Fig. 17b).
Soil rnatric potential is a quantity of significance in agriculture and thus
measurements obtained with tensiometers and Watennark GMS would not require
conversion for an experienced user. For the purpose of cornparison however, the UJvalues were converted to $ using the sail moisture characteristic cuwe respective to
each soi1 (Figs. 9, I O , and 11).
The soi[ moisture characteristic wrves specific to Ioam
and silt Ioam of the Ramada series were not available, thus they were determined in the
Iaboratory with the pressure plate method.
Moreover, the deviaüon of the converted 0,-values from the lysimeter 0,
obtained Mth the lysimeter foilowed the same trend for both tensiometers and GMS,
83
greatly overestimating 8, in both soils for the trial of 2000. This can indicate that the
u-
to-8, conversion or more specifically the soi1 moisture characteristic curves estimated for
the soi1 conditions of 2000 may have been prone to error.
5.2.3.2 Aquaterr soi1 moisture meter: The 8,-measurements obtained with the
Aquaterr soi1 moisture meter are compared with the lysimeters 8,-measurements in
Figs. 19 to 21b. Figure 21b is a revised version of 21a for which Aquaterr readings
exceeding 100 were rejected. Because a reading of 100 is set by immersing the probe
in water, values exceeding that were therefore assurned erroneous. The first two data
points were discarded because al1three readings in the first test and h o of the three
readings in the second test were higher than 100.
In the 1999 trial, the 8,-measurements obtained with the Aquaterr in loam
matched the lysimeter 8, accurately over the 23-31% range, for which the
measurements were qualified of vev accurate in the narrow 27 to 30% range based on
the statistical evaluation of accuracy described in section 5.2.3 (Fig. 19). Although the
error bar of the data points in the 8, range of 19 to 31% touch the 1:1 Iine, the
regression Iine shows that the Aquaterr probe overestimated 8, below 24% whereas it
tended to underestimate it above 31%. In 2000, the Aquaterr gave very accurate
measurements of 8, in loam over the entire drying cycle (Fig. 20). In silt loam, accurate
8,-measurements were obtained for 8, below 28% from which measurements in the 20
to 24% range were very accurate (Fig. 21b). However, the Aquaterr showed poor
precision, illustrated by the large error bars, for ail trials, especially in the 1999 trial.
As for the Waterrnark GMS, the data conversion for the Aquaterr probe was
perfonned in two stages. Firstly, the electrical quantii measured with the capacitance
sensor was converted to a scale of O to 100 that was displayed on the meter. Then, the
aispiayed value (R) was compared with a calour-caded legend that interpreted the
84
readings in terrns of soil moisture conditions (saturation, field capacity, and permanent
wilting point) for three general soil textures. The correlation between R and the moisture
conditions specific to the soils used in the experiment was estimated by interpolation
(Table 1). Finally the readings were converted to 8, using the linear relationships
developed from both the correlation between R and the moisture conditions and the 8,
and the moisture conditions. Once again, the soi1 moisture characteristic cunres were
used in the conversion. As it was discussed for the tensiometers and the Watermark
GMS, the final conversion was performed for the purpose of comparing the Aquaterr's
readings to the 8, obtained with the lysirneter.
5.2.3.3 Aqua-Tel capacitance probes: The 8,-measurements obtained with the AquaTel capacitance sensors are compared with the lysimeters 8,-measurements in Figs. 22
and 23. In the 1999 trial, the Aqua-Tel sensors measured 8, accurately below 31%
from which measurements in the 20 to 27% range were very accurate (Fig. 22). The
regression line shows that the capacitance probes underestimated 8, above 30%. In
the 2000 trial, although the regression line follows closely the 1:1 line, the 8"measurements obtained with these capacitance sensors were accurate for 8, ranging
from 22 to 38% and 0, was underestimated below and above that range (Fig. 23). For
both trials, the precision of the Aqua-Tel sensors was qualified as good which is
illustrated by error bars covering on average a range of 8, before 4 to 6% (Figs. 22 and
23). However, poor precision was observed for a few readings in the 2000 trial,
illustrated by large error bars covering, in some cases, a range of 8, of about 9% (Fig.
23).
The data conversion for the Aqua-Tel was perfomed in a single step. The
electrïcal quantity sent to the meter from the electronic module wnnected to the
electrodes, ranging from O to 1 mA, was amplified to be displayed on a scale of O to 100
85
on the meter. The calibration equation (Eq. 19) used to convert the reading displayed
was developed with a statistical analysis of texture-specific calibration curves pubfished
by Automata Inc. Equation 19 represents the data points of al1 the curves with a Rsquared value of 97.6%. When plotted against readings from 0.0 to 100.0 however, the
maximum volumetric water content returned was 47.8% which does not match 8, at
saturation of the soi1 tested (for loam: in 1999, 55.1% and in 2000, 56.6%). This was
due to the fact that only 9% of the data points from the manufacturer's calibration curves
represented moisture contents above 35%.
5.2.3.4 VlRRlB phase transmission sensors: The VlRRlB readings are compared
with the lysimeters' 8,-rneasurements in Figs. 24a to 26. In 1999, the VlRRlB sensors
gave average readings that were about 3 to 7% less than the lysimeter 0, (Fig. 24a).
Figure 24b shows the readings of each of the three probes as a function of the lysimeter
8., One VlRRlB sensor gave very accurate measurements of $ in the 18 to 23%
range. In 2000, only one of the six probes tested gave accurate measurements of 0,
over the 20 to 30% range. In loam, al1 three VlRRlB sensors gave measurements
following the same trend at volumetric water content below 30%. Two of the three
sensors, however, greatly overestirnated 8,; one by about 15% and the other by close to
30%. In silt loam, one sensor did not respond to changes in soi1 moisture content giving
8,sreadings of about 43% over the entire trial. Another sensor did not respond to soi1
moisture variations above 29% and overestimated 0, by as much as 50% in that range.
The third sensor tested in silt loam gave accurate measurements of 8, in the 20-30%
range and overestimated 6,by about 5% above that range.
As for the Aqua-Tel sensors, the data conversion for the VlRRlB sensors was
performed in a single step. In the case of the VlRRlB sensors the electronic module
ic~eiiesZn eiecinlnagneiic qüanUtythen c ü i i t ~ r t sit tü a iia;Üe ün a SC&
86
?üni Û iü 55
which is then sent to the meter to be displayed as volumetric water content. The
conversion equation that is used can be caiibrated by first calculating the amplification
and offset required and then adjusting the sensor by turning the specific resistive
trimmer capacitor located on the electronic module for each sensing device. In 1999,
the manufacturer's setting was used and it was concluded from the results obtained that
a calibration specific to each soi1 was required, The calibration was done prior to the
trial of 2000. Although the electronic module was resealed after the adjustment of the
resistive trimmer capacitors, water entered al1 sensors despite the caulking and
electrical tape used. The water intrusion caused the malfunction of the sensors for the
first part of the drying cycle down to 0, of 30%. Five of the sensors responded to
variations of soif moisture below 30% whereas one sensor did not respond over the
entire test. A single sensor however, gave accurate rneasurements in the 20 to 30%
range which led to conclude that the calibration perforrned was inadequate for five
sensors out of six.
5.2.3.5 ThetaProbe FDR sensor: The &rneasurements obtained with the ThetaProbe
FDR sensor are compared to the lysimeters' 8v-rneasurementsin Figs. 27 and 28. In
loam, the ThetaProbe measured accurately $ over the entire soi1 moisture range (Fig.
27). The regression line shows that the probe responded Iineariy to moisture changes
with an offset from the 1:1 line of Iess than 3%. In silt loam, the probe gave very
accurate measurements. The Iinear regression follows the 1:1 line perfectly (Fig. 28).
Greater variability was observed for measurements made in loam than for those
made in silt loarn. Based on the 95% confidence interval of the mean of the three
measurements taken on each occasion, the ThetaProbe had good precision in loam and
very good precision in silt loam. However, a few measurements showed very high
variability; in loam, three data points have an error bar covenng a range of 8, larger than
14% whereas only one data points has an error bar larger than 8% in silt Ioam.
The data conversion for the Thetaprobe frequency-domain reflectometry sensor
was performed in a single step. Because a voltmeter and a power supply were used
instead of the programmable data logger manufactured by Delta Devices Ltd., the
texture-specific calibration equation was used by the experimenter to convert the value
displayed on the voltmeter to volumetric water content. The calibration equation was
developed by first correlating the voltage output read to the apparent permittivity of the
soi1 which was then correlated to the soi1 moisture content.
Two distinct sources of error are associated with developing the calibration
equation. One is related to gravimetric sampling and the other, to the electronic circuitry
made of the power supply, the voltmeter, the probe, the soil, and al1 the cables and
wires. The maximum standard error calculated for gravimetric sampling performed to
determine the calibration equation was 0.44% in loarn and 0.65% in silt loarn. Because
the output voltage kept oscillating even after a petiod of 120 s was allowed for
stabilization, we assumed that the signal would not stabilize thus, the readings were
taken precisely 90 s after the transmission of the signal had begun for al1 tests. By
doing sol the experimenter tried to counter the error associated with the electronic
circuitry by measuring the output voltage at the same location on the output signal with
regard to the phase of the electromagnetic signal.
5.3 Functional considerations
Several functional aspects of the various instruments tested should be considered when
evaluating their suitability for field applications. The following considerations are based
on obsenrations made in both the field and the laboratory trials of the present study.
88
5.3.1 Tensiometers Tensiometers require continuous monitoring to ensure that they
are adequately filled with water and air entry has not taken place. They also need to be
handled with care since the porous cup made of cerarnic can be easily damaged and
any material corning in contact with the cup could block its pores. Furthermore, the
operational limit of the tensiometers (-85 csar) is not sufficient for certain crops or
applications.
5.3.2 Watermark GMS Granular rnatrix sensors are not as brittle as tensiometers but
they can Wear out. The membrane covering the granular matrix may become clogged
and irnpede water flow through the sensing device. The gypsum wafer used to buffer
the effect of soi1 solution's salinity will dissolve over tirne. These factors contribute to the
loss of sensitivity to moisture changes. Watermark sensors are affected by temperature
and thus, soi1 temperature rnust be independently monitored and entered anto the rneter
for calibration purposes. When sail moisture is measured deep below the sail surface,
sail temperature measurements can be difficult. Watermark GMS do not fully respond
to rapid drjing or partial rewetting of the soi1 (McCann et al. 1992). This can result in
underestimating the actual soi1 moisture content and thus to increasing the cost of
irrigation due to over application.
5.3.3 Aquaterr portable capacitance probe The Aquaten capacitance probe was
found to be affected by temperature variations between the water used for the
calibration and the soil. To Iessen this effect, the temperature of the calibration water
shouid be kept within 3°C of that of the soil, which can becbme a difficult task in the field
on a warrn summer day.
Measurements at shallow depths in Ioose-stnictured soil are difficuit due to the
configuration of the instrument.
to a meter and two handles.
The electrodes are ai the tip of the long stem attached
The mass of the meter coupled with the length of the stem
89
makes it difftcult to maintain a good contact between the electrodes and the soil.
However, for deeper measurements, the probe is more stable and a firm soil-sensor
contact is easy to establish and sustain. Aithough the Aquaterr is built to be pushed into
the soi1 to the desired depth, it was found that for most soils an access hole was
required to insert the probe to depths greater than 0.30 m.
5.3.4 Aqua-Tel capacitance sensors The Aqua-Tel sensors consist of electrodes of
0.83-m in length and therefore can sample a large area. Although this can De an
advantage for certain applications, large sensing devices can also be a disadvantage
when used for crops which have tubers such as potatoes. Disturbances and air pockets
in the effective volume of the sensor will greatly affect the measurements.
5.3.5 VIRRIB phase transmission sensors As for the Aqua-Tel sensors, the
dimensions of the VlRRlB sensors can be too large for crops like potatoes. In addition,
the configuration of the probe with regard to the calibration procedure is awkward. The
calibration requires the adjustment of the resistive trimmer capacitors located on the
electronic module which has to be buried in the soil white the adjustment is cam-edout.
The VlRRlB sensor is affected by interferences from transmission lines. The
body of the operator can also interfere with the measurements. It was observed that the
distance from the body of the operator to which the meter was held influenced the
readings. Furthemore, the distance between the operator and the sensor's electrodes
also affected the readings. For this reason, the operator should always hold the meter
in the same manner to sustain the same distance between his body and the meter each
time measurements are taken. The operator should also position himself at the same
distance from the sensor's electrodes.
5.3.6 ThetaProbe FDR sensor As for the VlRRlB sensors, the ThetaProbe
measurements were affected by interferences caused by the experimenter's body.
90
Although the Thetaprobe was used as a portable sensor, it can also be installed
permanently. In both cases, care shoufd be taken to avoid disturbances and air pockets
in the effective volume of the instrument which can greatly affect the measurements.
6 CONCLUSIONS
6.1 Experimental considerations
As discussed in the previous section, the use of volumetnc water content as a unit of
reference for the purpose of cornparing sensors was unfavourable to the tensiometers,
Watemark GMS, and Aquaterr probe since an additional conversion had to be
performed. The conversion from soi1 matric potentials to votumetric water contents
required soil-specific information that introduced a new source of error.
Furthermore, in order ta evaluate the performance of the various sensors tested
with regard to the principle of operation used, the experiment would have required
several distinctive stages. Ftrst, to observe the unprocessed output signal sent from the
sensing device to the meter, Then, to assess the conversion or processing of the data
integrated in the electronic module if applicable. And finalIy, to interpret the displayed
value for the purpose of comparison.
6.2 Performance of the sensors
6.2.1 Accuracy and precision Tensiometers, granular matrix sensors, capacitance
probes, phase transmission sensors, and the frequencydomain reflectometry tested
however, did not measure soi1 moisture with the same accuracy and precision in the
entire range. The assessment of accuracy was based on 1:t Iine falling within the 95%
confidence interval of the linear regression performed on the 8, measured with the
sensors. The precision of a sensor was assessed based an the length of the error bars.
The detailed criteria for the assessment of both accuracy and precision are presented in
section 5.2.3.
The Thetaprobe frequencydomain reflectometry sensor was the most accurate
instrument to measure soi1 moisture content in both soils over the entire drying cycle.
That is. in loam for 8, ranging from 20.0 to 43.1% and in silt loam, from 19.5 to 45.8%.
The precision of the measurements was very good in silt loam and good in loam.
The Aqua-Tel capacitance sensors gave accurate measurements of 8, in loam
over the 17 to 30% range from which measurements in the 20 to 27% range were very
accurate in the trial of 1999 and from 22 to 38% in the trial of 2000. The sensors
showed good precision in both trials.
The Aquaterr portable capacitance probe was accurate in loam in 1999 over the
23-31% range, for which the measurements were qualified of very accurate in the
narrow 27 to 30% range based on the statistical evaluation of accuracy. In 2000, the
Aquaterr gave very accurate measurements of 0, in loam over the entire drying cycle. In
silt Ioam, accurate 8,-measurements were obtained for 8, below 28% from which
measurements in the 20 to 24% range were very accurate. The precision of the
Aquaterr was poor for al1 trials.
Tensiometers and Watemark granular matrix sensors measured soil moisture
accurately only in narrow ranges in the trial of 1999 whereas they greatly overestimated
8, in both soils in 2000. Nevertheless, tensiometers and Watermark GMS were the
most precise instruments for al1 the tests. The repeatability of the measurements
indicated that the data conversion might be the source of inaccuracy.
Only one of the VlRRlB phase transmission sensors used to measure 8, in loam
in 1999 was accurate. Furthemore, those accurate measurements were obtained onIy
over a narrow range of 8, from 18 to 23%. The other two sensors responded to
variations of soil moisture content in the same manner with an offset of about 5% of 8.,
For the trial of 2000, the VlRRlB sensors did not respond to changes in 8, due to water
93
teaking into the electronicç resulting from the calibration process. Nonetheless, one
sensor gave accurate measurements of 8, in loam in the 20 to 30% range after the
moisture inside the module had dried out.
6.2.2 Ease of use In addition to their accuracy and precision, the sensors were
evaluated with regard to their ease of use. That is, the various soi1 rnoisture sensors
were assessed in relation to the tasks to accomplish the installation, calibration, and
operation of the sensing device as well as for the interpretationof the readings obtained.
The assessment was mostly qualitative and was based on time consumption, labour
intensiveness, and knowledge required to perform the tasks.
Tensiometers are easy to install, do not require calibration, and the
measurements are continuously displayed. The rneasured quantity however is the soi1
matric potential. Furthermore, tensiorneters need to be refilled periodically and because
of the fragility of the sensing tip, they must be handled with are.
Watemark GMS are also simple to install and the measurements are
instantaneously displayed at the press of a button. Nevertheless, because they require
a calibration against temperature, the operator must measure soi1 temperature
independently and enter it ont0 the meter. Watermark sensors display values of W that
need to be converted to volumetric water content.
The Aquaterr capacitance probe is a portable device and thus can easily
measure soi1 moisture in several locations. It is labourious however, to Risert the probe
at depths greater than 0.30 m without previousiy digging an access hole. On the other
hand, it is difficult to establish a good soil-electrodes contact when inserting the sensing
tip shallowly in soils with low bulk density. The Aquaterr also needs onsite caiibrations
against moisture content which requires submerging the sensing tip in water, The
temperature of the calibration water should be within 3°C of that of the soit as
94
temperature was found to have an effect on the measurements. The readings are
interpreted based on a cotour code specific to three general soi1 textures, Le., sand,
loam, and clay, provided on the meter. To achieve a certain level of accuracy though,
the operator needs to correlate the displayed value to soi1 rnoisture content which
requires soit-specific information such as texture and moisture characteristics.
The Aqua-Tel capacitance sensors do not need onsite calibrations and the
measurements are obtained instantaneousfy by pressing a button, The installation of
the 0.83-111 long electrodes requires that a trench be dug. The readings rnust be
converted using texture-specific calibration curves published by the manufacturer or with
the equation developed by the experimenters for which texture only has minimal
influence on the conversion.
The VlRRlB phase transmission sensors display a reading of 8, directly at the
trigger of a button. Due to the size and configuration of the sensing device, the
installation requires digging trenches as for the Aqua-Tel sensors. The VlRRlB sensors
also need a calibration which is time consurning and labour intensive due to the location
of the adjustment knobs.
The ThetaProbe FDR sensor was used as a portable probe in this experiment
but can also be permanentiy installed. An access hole is required to insert the sensing
device in the soit without compacting it excessively. The user's manual specifies an
accuracy of 15% of 8, when calibration constants provided by the manufacturer are
used. However, a specified accuracy of 12% of 0, can be achieved when a soit-specific
calibration is performed. The ThetaProbe can be used with a hand-held rneter or a data
logger both manufactured specially for the use with the sensor. In this experiment,
measurernents were made using a power supply and a voltmeter. The data logger is
programmable so that the readings can be conveneu to Û,automaticaiiy.
95
HOWeVer,
when the rneter is used. the output voltage must be converted by the user with the aid of
a calibration equation.
6.2.3 Overall performance A summary of the quantitative evatuation of the
performance with regards to the accuracy and the precision of the sensors, based on the
criteria described in section 5.2.3,is presented in Table IV.
Table IV.
Sensors
Summary of accuracy and precision of the soi1 moisture sensors,
Accuracy
Precision
--
-
- - -
Tensiometers
inaccurate
very good
Watermark
inaccurate
very good
Aquaterr
accurate
poor
Aqua-Tel
accurate
good
VIRRIB
inaccurate
poor
ThetaProbe
very accurate
good (loam); very good (silt loam)
A summary of the qualitative evaluation of the performance with regards to the ease of
use of the sensors, based on the d e r i a described in section 6.2.2, is presented in
Table V. From both aspects of performance evaluation, Le. quantitative and qualitative,
we conclude that the ThetaProbe FDR sensor is most suitable to monitor irrigation
needs with accuracy, precision, and ease of use. Both capacitance sensors, the
Aquaterr probe and the Aqua-Tei sensors, also performed well, rneasunng soi1 moisture
content accurately altfiough with less precision. Tensiometers and Watermark sensors
although very precise were mainly inaccurate due to problems with data conversion.
The evaluation of the VlRRlB sensors' performance remains inconclusive due to the
malfunction of the sensors resutting from calibration.
Table V. Summary of the evaluation of the sensors' ease of use.
Sensors
Installation
Onsite calibration
Operation
Tensiometers
easy, quick
no
easy, quick
Watermark
easy, quick
yes (temperature)
easy, quick
Aquaterr
easy
yes (moisture)
easy
Aqua-Tel
labour intensive
no
easy, quick
VIRRIB
labour intensive
no
easy, quick
ThetaProbe
easy
no
easy
Finally, al1 the sensors tested in the present study responded to soi1 moisture
variations and thus, they could be used as good triggering devices for tuming on
irrigation systems. However, a clear understanding of the calibration and data
conversion associated with the various instruments coupled with a soil-specific
calibration are required to establish a fully automated imgation systern.
7 RECOMMENDATIONS
7.1 Recornmended future research
The following are recommendations addressed to researchers who are interested in
evaluating the performance of soi1 rnoisture çensors more effectivefy:
1) To evaluate the perfannance of the soi1 moisture sensors over subsequent drying
cycles to observe their sensitivity to partial rewetting and their response time;
2) To determine systematically the effective volume measured by each sensor and to
adjust the dimensions of the lysirneter accordingly.
7.2 Application of research results
The following recomrnendations are based on the evaluation of the performance of
tensiometers (Sailmoisture Equipment Corp., mode[ 2725AR), Watennark granular
matrix sensors (Irrometer Co.), the Aquaterrelecîrical capacitance probe (Aquaterr
Instruments Inc,, model 200),Aqua-Tel electrical capacitance sensors (Automata Inc.,
model Aqua-Te194-29), VIRRIB phase transmission sensors (Environmental Sensors
Inc.), and the ThetaProbe FDR sensor (Delta-T Devices Ltd, type MU). These
recommendations are addressed to both producers and researchers for the selection of
a sensing device assuming that there are no cost limitations,
First, t recommend the ThetaProbe be used as a portable device for application
requiring very accurate measurements of soit moisture content and several sampling
locations.
Assuming the soi1 moisture characteristics specific to the field are known, I also
recornmendthe use of tensiometers and Watermark granuiar matrix sensors, because
they are easy to install and operate and they are very precise. Moreover, I recommend
the use of the Watemark sensors assuming that soil temperature can be monitored as
required for the calibration. As for the tensiorneters, their use is recomrnended with the
assurnption that rneasurementswill be perforrned for rnoisture contents within their
operational limits of O to -85 kPa.
Finally, 1 recommend the Aquaterr for applications that do not need high
accuracy and precision and that require numerous sampling locations (e.g. to determine
the uniformity of soil rnoisture within a garden or the infiltration depth afier applying
water) because it is relatively easy to use and portable.
8 REFERENCES
Aboukhaled, A., A Alfaro, and M. Smith. 1982. Lysimeters. FA0 Irrigation and
Drainage Paper No.39. Rome, ltaly: FAO.
Aquaterr Instuments. -.
Aquaterrlnstruments User Manual. Aquaterr Instruments.
Fremont, CA.
Automata Inc. 1996. Remotely Measure Soil Moisture with Aqua-Tel94. Automata Inc.
Grass Valley, CA.
Bhardwaj, S.P. and G. Sastry. 1979. Development and installation of a simple
mechanical weighing type Iysimeter. Transactions of the ASAE, 22(4):797-802.
Campbell, M.D., G.W. Gee, R.R. Kirkham, S.J. Phillips, and N.R. Wing. 1991. Water
balance lysirnetry at nvclear waste site. In Proceedings of the International
Symposium on Lysimetry, 125-1 32. Honolulu, Hawaii: Irrigation and Drainage
Division of the American Society of Civil Engineers.
Canadian Standards Association. 1979. Canadian Metnc Practice Guide. CSA.
Dean, T.J., J.P. Bell, and A.J.B. Baty. 1987. Soil moisture measurements by an
improved capacitance technique, part 1. Sensor design and performance.
Journal of Hydmlogy 93: 67-78.
Delta-T Devices Ltd. 1998. Thetaprobe Soi/ Moisture Sensor Type ML2 User Manual.
Delta-T Devices Ltd. Cambridge, UK.
Eldredge, E.P., C.C. Schock, and T.D. Stieber. 1993. Calibration of granular matrix
sensors for irrigation management Agronomy Journal 85:1228-1232.
Eller, H. and A. Denoth. 1996. A capacitive soit moisture sensor. Journal of Hydmlogy
185: 137-146.
Environmental Sensors Inc.
-.
VIRRIB@Soi/ Moisture Sensor Operating Manual for
Imgation Management. Environmental Sensors Inc. San Diego, CA.
Environmental Sensors lnc. -.
Moisture measurement system, vlRRIBQ.
htto://www.envsens.com, Apri12000.
Fritschen, L.J. 1991. Transpiration by Douglas fir using lysimeters. In Proceedings of
the lntemational Symposium on Lysimetry, 246-253. Honolulu, Hawaii: Irrigation
and Drainage Division of the American Society of Civil Engineers.
Gardner, C.M.K., T.J. Dean, and J.D. Cooper. 1998. Soil water content measurement
with a high-frequency capacitance sensor. AgnCultural Engineerfng Research
71: 395-403.
Grebet, P and R.H. Cuenca. 1991. Historj of lysimeter design and effects of
environmental disturbances. In Pmceedings of the lntemational Symposium on
Lysimetry, 10-18. Honolulu, Hawaii: Imgation and Drainage Division of the
American Society of Civil Engineers.
Hanks, R.J. and G.L. Ashcroft. 1980. Applied Soil Physii: Soil Water and Temperature
Applications, Logan, UT: Springer-Verlag.
Hanson, B. 1999. Soil moisture instruments.
Heimovaara, T.J., W. Bouten, and J.M. Verstraten. 1994. Frequency domain analysis of
time domain reflectometry waveforms, 1, A four-component complex dielectric
mixing mode1for soils. Water Resources Research 30(2): 201-209.
Hillel. D. 1971. Soil and Waferr Physical Pnnciples and Processes. NewYork, NY:
Academic Press.
Howell, T A , A.D. Scheinder, and M.€. Jensen. 1991. History of lysimeter design and
use for evapotranspiration measurements. In Proceedings of the International
101
Symposium on Lysimetry, 1-9. Honolulu, Hawaii: Irrigation and Drainage
Division of the American Society of Civil Engineers.
lrrometer Co.
-. Watermark, Operation and Installation Soi1 Moisture Measurernent-
Irrometer Co. Riverside, CA.
Klocke, N.L., D.F. Heemann, and H.R. Duke. 1985. Measurement of evaporation and
transpiration with lysimeter. Transactions of the ASAE 28(I):l83-189 and 192.
Kutilek, M. and D.R. Nielsen. 1994. Soil Hydrology. Cremlingen-Destedt, Germany:
Catena Verlab.
Litschmann, T. 1991. VIRRIBQ:A soil moisture sensor and its application in agriculture.
Communications in Soil Science and Plant Analysis 22(5&6): 409-418.
McCann, I.R., D.C. Kincaid, and D. Wang. 1992. Operational characteristics of the
Waterrnark model 200 soil water potential sensor for irrigation management.
Applied Engineering in Agriculture 8(5):603-609.
Morgan, M.T., R.K. Wood, and R.G. Holmes. 1993. Dielectric moisture rneasurement of
soi1 cores. Transactionsof the ASAE 36(1): 17-22.
Perdok, U.D., B. Kroesbergen, and M.A. Hilhorst. 1996. Influence of gravimetric water
content and bulk density on dielectric properties of soil. European Journal of Soil
Science 47: 367-371.
Phene, C.J., C.P. Allee, and J.D. Piero. 1989. Soil matric potential sensor
measurements in real-time irrigation scheduling. Agncultuml Water
Management 16:173-185.
Phene, C.J., G.J. Hoffman, T.A. Howell, DA. Clark, R.M. Mead, R.S. Johnson, and LE.
Williams. 1991. Automated lysimeter for irrigation and drainage control. In
Proceedings of the International Symposium on Lysimetry, 28-36. Honolulu,
Hawaii: Irrigation and Drainage Division of the American Society of Civil
102
Engineers.
Phillips, S.J., J.F. Relyea, C.J.Kemp, N.R. Wing, M.D. Campbell, G.W. Gee, M.J.
Graham, R.R. Kirkham, M.S. Ruben. 1991. Development of Hanford site
lysimeter facilities. In Proceedings of the International Symposium on Lysimetry,
19-27. Honolulu, Hawaii: Irrigation and Drainage Division of the American
Society of Civil Engineers.
Proulx, S., R. Sri Ranjan, and G. Klassen. 1998. Evaluation of soi1 moisture sensors in
potato fields. ASAE Paper No. SD98-118. StJoseph, MI: ASAE.
Pruitt, W.O., F.J. Lourence, C.B. Tanner, and P. Lal. 1991. The U.C.D. drag-plate
lysimeter, momentum and mass transfers. In Proceedings of the International
Symposium on Lysimetry, 46-60. Honolulu, Hawaii: lmgation and Drainage
Division of the Arnerican Society of Civil Engineers.
Ripley, E., M. Savage, G. Lukangu, and C. Everson. 1998. Comparison of soil-water
measurements using TDR and other techniques in Kwazulu Natal, South Africa.
htt~:/lmarathon.usask~ca/-eri~leyAheta.hl
ApriI 2000.
Shock, C.C. and J.M. Bamum. 1993. Calibration of soi1 sensors for potato irrigation.
(Abstract) Amefican Potato Journal 70340.
Sinnema, W. 1988. Electronic Transmission Technology. Lines, Waves, and Antennas.
2""ed. Englewood Cliffs, NJ: Prentice Hall.
Smedema, L.K. and D.W. Rycroft. f 983. Land Drainage: Planning and Design of
Agricultural Drainage Systerns. Ithaca, NY: Cornell University Press.
Smit, J. 1996. TDR vs FDR vs capacitance: M a t exactly are these?
htt~:llwwwsowacs.comlsens~~~Ewhatistd~html
April2000.
Soilmoisture Equipment Corp. 1984. 2725 Senes Jet Fil1 Tensjometers. Soilmoisture
Equipment Corp. Santa Barbara, C A
1O3
Star. G. -.
The vIRRIBQsensor. htt~:llwww.sowacç.comlsensorslvim'b.htrnlApril
2000.
Stieber, T.D. and C.C. Schock. 1995. Placement of soil moisture sensors in sprinkler
irrigated potatoes. American Potato Journal 72533-543.
Thomas, A.M. 1966. In situ rneasurements of moisture in soi1 and similar substances by
"ftingencapacitance. Journal of Scientific Instruments 43: 21-27.
Topp, G.C., J.L. Davis, and A.P. Anna. 1980. Electromagnetic determination of soil
water content: measurements in coaxial transmission Iine. Water Resources
Research 16: 574-582.
Wobschall, D. 1977. A theory of the complex dielectric permittivity of soi1 containing
water. the semidisperse model. IEEE Transactionson Geoscience Electronics
GE-15(1): 49-58.
Wobschall, D. 1978. A frequency shift dielectric soil moisture sensor. IEEE
Transactions on Geoscience Electronics GE-16(2): 112-1 18.
Yoder, R.E., D.L. Johnson, J.B. Wilkerson, and D.C. Yoder. 1998. Soi1 water sensor
performance. Applied Engineering in Agriculture l4(2):121-133.