1
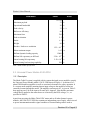
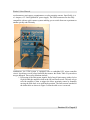
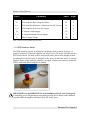
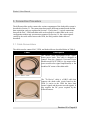
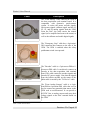
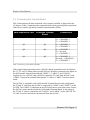
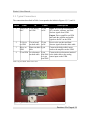
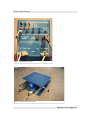
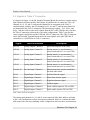
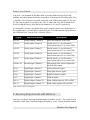
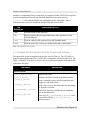
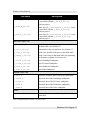
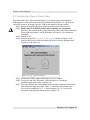
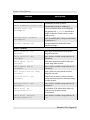
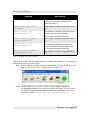
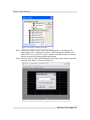
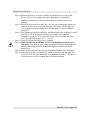
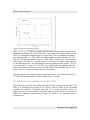
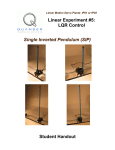
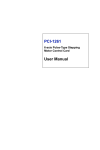
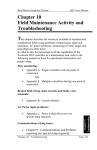
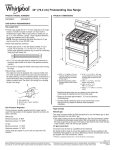
Quanser Specialty Experiment Series: Shake Table II: User Manual Shake Table II User Manual Table of Contents 1. Introduction......................................................................................................................1 2.System Specifications and Description.............................................................................1 2.1. Shake Table...................................................................................................................1 2.2. Universal Power Module 50-25-3PHI..........................................................................2 2.3. Data Acquisition System..............................................................................................7 2.4. Control Software...........................................................................................................8 3. Connection Procedure......................................................................................................9 3.1. Cable Nomenclature......................................................................................................9 3.2. Connecting the Terminal Board..................................................................................11 3.3. Typical Connections...................................................................................................12 3.4. Signals in 'Table X' Connection..................................................................................15 4. Running Experiments with WinCon..............................................................................16 4.1. Supplied Simulink Models, WinCon Projects and Software......................................17 4.2. Calibrating Table to 'Home'........................................................................................19 4.3. Sending Sine Wave to Shake Table............................................................................20 4.4. Variables Available for Plotting.................................................................................21 4.5.Finding Frequency Response of a Structure Floor......................................................25 4.6. Performing Analysis on Collected Data.....................................................................26 4.7. Running a Standard Earthquake.................................................................................26 4.8. Scaling a Real Earthquake..........................................................................................27 4.9. Compiling a New Earthquake.....................................................................................29 5. Troubleshooting Guide..................................................................................................31 Appendix A........................................................................................................................33 A.1.Signals used to Initialize 50-25-3PHI UPM...............................................................33 A.2.Signals used to Enable 50-25-3PHI UPM..................................................................33 A.3.Signals used to Calibrate 50-25-3PHI UPM...............................................................34 Shake II User Manual 1. Introduction Shake Table II is an instructional shake table developed for the University Consortium on Instructional Shake Tables (UCIST). The system is comprised of a shake table, a universal power module (UPM), a data acquisition card (DAC) along with its external terminal board, and a PC running control software. The PC sends and receives signals through the data acquisition card using WinCon. Consider the signal transitions when sending a sine wave to the shake table and reading its resulting acceleration. The sine wave is generated by the PC using WinCon and is sent through the DAC to the UPM. The signal is then amplified by the power amplifier in the UPM and a voltage is applied to the motor connected to the shake table. The table moves back and forth at the position and frequency of the commanded sine wave. The acceleration of the table is read from the accelerometer sensor attached to the table. The accelerometer is connected to the DAC through the UPM and the acceleration is read using WinCon on the computer. The data can be viewed in real-time and saved for later analysis. The next section describes the various components of the system and lists their specifications. In Section 3 the typical wiring setup of the shake table is described when using a single x-axis table and when using two shake tables to actuate xy motions. The software programs supplied with the shake table are then explained in Section 4. 2.System Specifications and Description The specifications and components of the shake table, the UPM, and the DAC will be explained in section 2.1, 2.2, and 2.3, respectively. The computer and the software used to control the shake table are described in Section 2.4. The last section explains the safety features integrated in the UPM device. 2.1. Shake Table The shake table consists of a 1 Hp brushless servo motor driving a ½ in lead screw. The lead screw circulates through a ball nut that is attached to the 18 × 18 in2 table platform. The table slides on low friction linear ball bearings on two ground hardened shafts. The specifications of Shake Table II are given in Table 1. Revision: 02 Page # 1 Shake II User Manual Parameter Table dimensions Value Units 2 18 ×18 in Maximum payload 33 lb Operational bandwidth 20 Hz Peak velocity 33 in/s Ball screw efficiency 90 % Maximum force 700 N Peak acceleration 2.5 g Stroke ± 3 in Weight 60 lb Encoder / lead screw resolution Motor maximum torque Ball nut dynamic loading capacity 1.25 × 10⁻⁴ in 1.65 N⋅m 12000 N Ball nut life expectancy at full load 2.50 × 10¹⁰ in Linear bearing life expectancy 2.50 × 10⁸ in Linear bearing load carrying capability 290 lb Table 1 Shake II Table Specifications 2.2. Universal Power Module 50-25-3PHI 2.2.1 Description The Shake Table II system is supplied with its custom-designed power amplifier, namely the Universal Power Module model # 50-25-3PHI shown in Figure 1. It consists of a 3phase PWM brushless amplifier as well as associated electronics for safety operation. It is a current mode amplifier meaning that an input voltage to the amplifier results in a controlled current through the motor. The amplifier current gain, Ka, is given in Table 2: thus applying one Volt at the input will result in Ka Amperes. Note that the maximum voltage that is applied to the motor however is limited by the BUS voltage, Vbus, as specified in Table 2. Apart from powering the Shake Table II DC motor and as all other Quanser's power modules, the UPM 50-25-3PHI also contains an independent power supply, which is used to power instrumentation and/or signal condition of external analog sensors such as Revision: 02 Page # 2 Shake II User Manual accelerometers, strain gages, potentiometers, or also proximity sensors. Specifically, it is a 1-Ampere, ±12-Volt regulated DC power supply. The UPM connectors are also fully compatible with our quick connect system enabling you to switch from one experiment to another quickly and efficiently. Figure 1 Front Panel of UPM Furthermore, the UPM system is equipped with an embedded PIC micro-controller circuit. It performs several safety functions that ensures the Shake Table II system does not get damaged. These safety functions include: 1. Processing of the limit sensor signals. End of travel limit sensors (either Left or Right) disable the amplifier when in the OK and Enable mode. The only way to reset the amplifier is then to trigger the Home proximity sensor by manually moving the table back to its mid-stroke position. The limit sensors attached to the shake table are shown in Figure 2 when the table cover is removed. Revision: 02 Page # 3 Shake II User Manual Figure 2 Limit Sensors 2. Conversely when the UPM is in calibration mode the amplifier is instead disabled when the table reaches the Home sensor. In this mode, the amplifier remains enabled when the Left or Right sensors are triggered, since it uses those for auto-centering. The calibration procedure is explained further in Section 4. 3. After power up, the amplifier is enabled only if a sequence of pulses originating from the DAC board (through Digital Output #8 and #9) is applied to the micro-controller. Refer to the following UPM Starting Procedure and Initialization Section for more details. Keep the Safety Override switch in the OFF position. Turning it on enables the UPM independently of any safety circuitry. It is intended only if the safety circuitry fails and you still want to perform some experiments. With Safety Override ON, nothing protects the table from damage! 2.2.2Specifications Table 2 lists and characterizes the main specifications associated with the UPM 50-253PHI system. Some of these parameters can be used for mathematical modeling of the system. Revision: 02 Page # 4 Shake II User Manual Parameter Symbol Value Units Ka PWM Amplifier Current Gain 5 A/V Vbus PWM Amplifier Bus Voltage Per Phase 48 V Ia_max PWM Amplifier Maximum Continuous Line DC Current 10 A Ia_peak PWM Amplifier Peak Line DC Current 25 A DC Output Voltage Supply ±12 V 1 A 120 V Vdc Idc_max Vin DC Output Maximum Current Supply UPM AC Input Voltage Table 2 Universal Power Module Specifications 2.2.3UPM Deadman Switch The UPM amplifier can only be enabled if a deadman switch as shown in Figure 3 is properly connected. Further the amplifier can only drive the DC motor when the switch is NOT pressed down. The knob in the E-stop switch can be placed in the upright position by rotating the knob clockwise, as indicated by the arrows on the knob, until it is released upwards. Again, in this mode the amplifier can supply voltage to the motor given that the UPM is initialized and the amplifier is enabled. Figure 3 Deadman Switch PRESS DOWN on the RED BUTTON of the deadman switch in case of emergency. If something goes wrong during an experiment, pressing the red button of the deadman switch disables the amplifier and shuts off the DC motor power. Revision: 02 Page # 5 Shake II User Manual 2.2.4UPM Starting Procedure and Initialization Before being able to run an experiment, the UPM 50-25-3PHI must be started in the following sequence: 1. Ensure that the Safety Override switch, located on the UPM front panel, is OFF. 2. Ensure that the Emergency Stop, shown in Table 3, is properly connected into the side of the UPM, as previously described. Pull up on the red knob until released in the upright position. 3. Ensure that the UPM is plugged into the AC outlet and turn on the main power switch (at the back of the unit). The red LED on the top-left corner should be lit. 4. After power up, the UPM system is still not ready as there is no guarantee that it is connected to a computer. The Left and Right LEDs, on the UPM front panel, should flash. If the lights are NOT flashing disconnect the "Terminal Board-To-UPM" cable, turn off the power on the UPM, and then turn it back on again. The two LEDs should flash. If so, re-connect the "Terminal Board-To-UPM" cable and proceed to Step 5. 5. Load WinCon Server. 6. Open the q_boot_upm_ZZ.wcp WinCon project, where 'ZZ' corresponds to the type of data acquisition card being used – either Q4 or Q8. 7. Start WinCon by clicking on the green START button on the WinCon Server Window. 8. The Left and Right LEDs should stop flashing and the window shown in Figure 4 should be prompted. This implies the UPM amplifier is ready to be enabled. Figure 4 Message prompt after running q_boot_upm_ZZ 9. Another (and not recommended!) way to stop the flashing of the LEDs is to push the Reset button located on the UPM front panel. This bypasses the need for the previously described UPM initialization procedure. However, this is not the recommended way of operation as it overrides the UPM safety watchdog put in place to detect whether the UPM system is properly connected to your computer. 10.PRESS DOWN on the RED BUTTON of the deadman switch in case of emergency. If something goes wrong during an experiment, pressing the red button of the deadman switch disables the amplifier and shuts off the the DC motor power. Note that this initialization procedure does not enable the amplifier and therefore the motor cannot be driven yet. The amplifier is only enabled when running an actual supplied WinCon laboratory controller. The amplifier is disabled when the WinCon controller terminates. The digital signals required to initialize the UPM and the signals used to enable the amplifier are described in Appendix A. Revision: 02 Page # 6 Shake II User Manual 2.3. Data Acquisition System The system supplied may consists of either a Q4 or Q8 data acquisition card along with either a Q4 or Q8 extended terminal board card. Figure 5 depicts a Q8 Extended Terminal Card attached to a Q8 Data Acquisition Card (DAC) inside the computer. The DAC is equipped with eight analog input channels, eight analog output channels, and eight encoder channels. The analog outputs channels #0 and #4, all the analog input channels, and the encoder channels #0 and #4 are integrated in the Table X and Table Y connectors on the terminal board. The signals carried by the Table X and Table Y cables are listed in Section 3.4. The Q8 DAQ specifications are given in Table 3. Figure 5 Q8 Extended Terminal Board Revision: 02 Page # 7 Shake II User Manual Parameter Value Units Analog Input Channels Number Range Resolution 8 ± 10 V 14 bit Analog Output Channels Number Range Resolution 8 ± 10 V 12 bit Encoder Channels Number Maximum Count 8 32 bit Other Counters Digital I/O 2 × 32 bit 32 Table 3 Q8 DAC Specifications As mentioned before, there is a Q4 Data Acquisition Card and a Q4 Extended Terminal Card that may have been supplied with the shake table system. The Q4 DAC has the same channel and clock/counter specifications but instead has four encoder inputs, four analog inputs, and four analog outputs. The Table X connector carries analog output channel #0, encoder channel #0, and analog input channels #0 to #3. The Q4 Extended Terminal Card is compatible with the Q8 DAC. The wiring procedure between the various DACs and the terminal boards is described in Section 3.2. 2.4. Control Software The WinCon program supplied is a control software that runs Simulink diagrams in realtime. The standard controllers included with the systems allows the user to command preset trajectories and historical earthquake data. The following additional software is needed if the user wishes to change the standard controllers or create new ones: Matlab Simulink Control Systems Toolbox Realtime Workshop and Visual C++ Computers with this software pre-installed and tested can be supplied. Revision: 02 Page # 8 Shake II User Manual 3. Connection Procedure The different cables used to connect the various components of the shake table system is described in Section 3.1. The connections between the different terminal boards and the data acquisition cards are explained in Section 3.2. In Section 3.3, typical connections between the DAC, UPM, and shake table are described for a shake table in the x-axis configuration without any test structures mounted. In Section 3.4, the various signals carried by the serial cables between the UPM, the DAQ, and the shake table are described. 3.1. Cable Nomenclature The cables used to connect DAC, UPM, and shake table are described below in Table 4. Cable Description The "Motor" cable corresponds to the 3-phase motor power leads. This cable is designed to connect from the Quanser's Universal Power Module model 50-25-3PHI (i.e. the output of the power module after signal amplification) to the brushless DC motor of the shake table. Figure 6 "Motor" Cable The "To Device" cable is a DB15 cable that connects the shake table circuit board to the UPM. It carries to the UPM the three limit sensors' signals and the motor encoder signals. It also supplies the DC power required by the different sensors. Figure 7 "To Device" Cable Revision: 02 Page # 9 Shake II User Manual Cable Description The "From MultiQ" cable connects the UPM to the data acquisition card terminal board. It is compatible with Quanser's quick-connect system. It carries the motor encoder signals, limit sensor signals, calibrate signal, and the S1, S2, S3, and S4 analog signals from the UPM. From the DAC, the cable carries the control signal (to be amplified and sent to the motor) as well as the calibrate and enable digital signals Figure 8 "From MultiQ" Cable The "Emergency Stop" cable has a 6-pin-miniDIN connector that connects to the side of the UPM. The UPM is enabled when the safety pushbutton switch is not pressed. Figure 9 "Emergency Stop" Cable Figure 10 "Encoder" Cable Figure 11 "From Analog Sensors" Cable The "Encoder" cable is a 5-pin-stereo-DIN-to-5pin-stereo-DIN cable. It can directly connect an encoder to the data acquisition card terminal board. This cable carries the encoder signals and encoder DC power supply. Note that the signals from the built-in encoder on the motor of the shake table is carried by the "To Device" cable. The "From Analog Sensors" cable is a 6-pinmini-DIN-to-6-pin-mini-DIN cable that can be used to connect any potential plant sensor to the UPM such as accelerometers. It can provide a ±12VDC bias to analog sensors and carry their voltage signals to the DAC terminal board via the UPM. Table 4 Cable Nomenclature Revision: 02 Page # 10 Shake II User Manual 3.2. Connecting the Terminal Board This section assumes the data acquisition card is properly installed, as discussed in the Q8 Manual. Table 5 summarizes the connections between the Q4 and Q8 data acquisition cards (DACs) and the Q4 and Q8 extended terminal boards (ETBs). Data Acquisition Card Extended Terminal Board Connections Q8 Q8 J1 -> CHANNEL 1 J2 -> CHANNEL 2 J3 -> CHANNEL 3 Q4 Q4 J1 -> CHANNEL 1 J3 -> CHANNEL 3 Q8 Q4 J1 -> CHANNEL 1 J2 -> Not used J3 -> CHANNEL 3 Q4 Q8 J1 -> CHANNEL 1 Not used -> CHANNEL 2 J3 -> CHANNEL 3 Table 5 Connecting various DACs and ETBs If the supplied data acquisition card is a Q8 DAC and the terminal board is also Q8 then the 'J1', 'J2', and 'J3' ribbon cables from the Q8 DAC should be connected to the inputs on the Q8 Extended Terminal Board labeled 'CABLE 1', 'CABLE 2', and 'CABLE 3', respectively. For a Q4 DAC and a Q4 ETB, connect the 'J1' cable from the DAC to the 'CABLE 1' input on the terminal board and the 'J3' cable to 'CABLE 3' on the terminal board. The Q4 DAC is compatible with a Q8 Extended Terminal Board. In this configuration, the 'J1' and 'J3' cable from the Q4 DAC is connected to 'CABLE 1' and 'CABLE 3' on the Q8 ETB. The 'CABLE 2' connection on the ETB would not be used in this setup. Further, the Q8 DAC can be interfaced with the Q4 Extended Terminal Board. In this scenario, the 'J1' and 'J3' cable is connected to the 'CABLE 1' and 'CABLE 3' on the Q4 ETB. The 'J2' cable is not used and may be disconnected from the Q8 DAC. Revision: 02 Page # 11 Shake II User Manual 3.3. Typical Connections The connections described in Table 6 correspond to the labels in Figures 12, 13, and 14 . Cable 1 From To Table X on From MultiQ on UPM DAC Cable 25-pin serial Description Input: Receives the accelerometer (S1), encoder, calibrate, and limit detector signals from UPM. Output: Drives amplifier on UPM and sends the calibrate and enable signals to the PIC on the UPM. 2 To Device on UPM Circuit board on shake table 3 Motor on UPM Motor on shake 4-pin table 4 S1 on UPM Accelerometer 6-pin Connects the accelerometer attached on shake table mini DIN to the shake table to the analog to 6-pin sensor input on the UPM. mini DIN 15-pin serial Receives the encoder and limit detector signals from the shake table. Connects the shake table's motor leads to the amplifier on the UPM. Table 6 Typical Shake Table Connections Figure 12 Q8 Extended Terminal Board Revision: 02 Page # 12 Shake II User Manual Figure 13 Front Panel of UPM Figure 14 Shake Table Connections Revision: 02 Page # 13 Shake II User Manual 3.4. Signals in 'Table X' Connection As depicted in Figure 12, the Q8 Extended Terminal Board does not have separate analog input channels and does not have the Encoder #0 and Encoder #4 connectors. The A/D channels #0, #1, #2, and #3, and encoder channel #0 are integrated in the Table X connection and, similarly, the A/D channels #4, #5, #6, and #7, and encoder channel #4 are integrated in the Table Y connection. The limit detector signals – Left , Home, and Right – and the calibrate and enable signals from the PIC in the UPM are also carried in the Table X connection (when in the x-axis table configuration). Table 7 specifies the various signals carried between the UPM and Table X connection. The Table X connector on the Q4 Extended Terminal Board carries the same signals as the Q8 ETB Table X connection (i.e. Q4 ETB has no Table Y connector). Signal WinCon Interface Description D/A #0 Analog Output: Channel 0 Drives the amplifier in the UPM. A/D #0 Analog Input: Channel 0 Analog sensor (i.e. accelerometer) sensor connected to S1 on x-axis UPM. A/D #1 Analog Input: Channel 1 Analog sensor (i.e. accelerometer) sensor connected to S2 on x-axis UPM. A/D #2 Analog Input: Channel 2 Analog sensor (i.e. accelerometer) sensor connected to S3 on x-axis UPM. A/D #3 Analog Input: Channel 3 Analog sensor (i.e. accelerometer) sensor connected to S4 on x-axis UPM. Encoder #0 Encoder Input: Channel 4 Measurement from encoder attached to the shake table motor. DI #0 Digital Input: Channel 0 Left limit detector signal. DI #1 Digital Input: Channel 1 Home limit detector signal. DI #2 Digital Input: Channel 2 Right limit detector signal. DI #3 Digital Input: Channel 3 Calibrate signal. DO #0 Digital Output: Channel 8 Sends calibrate signal to PIC on UPM. DO #1 Digital Output: Channel 9 Sends enable signal to PIC on UPM. Table 7 Table X Connection Signals The analog input channels #1, #2, and #3 are not required if the shake table is used only in the x-axis configuration with no test structures attached. However, consider the shake table setup with a two story building. In this configuration, there are three accelerometers Revision: 02 Page # 14 Shake II User Manual to be read – one mounted on the shake table, a second attached on first floor of the building, and a third fastened onto the second floor of the structure. The shake table, floor 1, and floor 2 accelerometers would be connected to the UPM analog inputs S1, S2, and S3. Since these signals are carried by the Table X connection, they can be interfaced in WinCon using the Analog Input block with channels #0, #1, and #2, respectively. As mentioned, a second y-axis shake table can be coupled with an x-axis shake table. In this configuration, a second UPM is required for the y-axis table and the signals between this UPM and Table Y on the DAC is listed in Table 8. Signal WinCon Interface Description D/A #4 Analog Output: Channel 4 Drives the amplifier in the UPM. A/D #4 Analog Input: Channel 4 Analog sensor (i.e. accelerometer) sensor connected to S1 on y-axis UPM. A/D #5 Analog Input: Channel 5 Analog sensor (i.e. accelerometer) sensor connected to S2 on y-axis UPM. A/D #6 Analog Input: Channel 6 Analog sensor (i.e. accelerometer) sensor connected to S3 on y-axis UPM. A/D #7 Analog Input: Channel 7 Analog sensor (i.e. accelerometer) sensor connected to S4 on y-axis UPM. Encoder #4 Encoder Input: Channel 4 Measurement from encoder attached to the shake table motor. DI #4 Digital Input: Channel 4 Left limit detector signal. DI #5 Digital Input: Channel 5 Home limit detector signal. DI #6 Digital Input: Channel 6 Right limit detector signal. DI #7 Digital Input: Channel 7 Calibrate signal. DO #4 Digital Output: Channel 10 Sends calibrate signal to PIC on UPM. DO #5 Digital Output: Channel 11 Sends enable signal to PIC on UPM. Table 8 Table Y Connection Signals 4. Running Experiments with WinCon WinCon is a software that runs Simulink models in realtime on a PC. The actual WinCon controller is built from a Simulink diagram designed by a user. Various Simulink models Revision: 02 Page # 15 Shake II User Manual and their corresponding WinCon controllers are supplied. Further, MATLAB script files used to load parameters used by the Simulink diagrams are given as well as a q_scale.dll file used to simulate real earthquakes on the shake table. Table 9 summarizes the various file extensions and describes the associated file. File Extension Description of File *.mdl Simulink model of the controller. *.m Matlab script file that sets gains and various other parameters in the Simulink diagram. *.wcl WinCon controller file generated from the Simulink model. *.wcp WinCon project file contains pre-defined plots and a control panel. Table 9 File Extensions Description 4.1. Supplied Simulink Models, WinCon Projects and Software The shake table system is supplied with the files listed in Table 10. The 'ZZ' suffix of some file names denotes the DAC card the file is compatible with and is either 'Q4', 'Q8', 'MQ3', or 'MQPCI'. The WinCon Project files were generated using the Simulink model of the same file name. File Name Description Simulink Model q_boot_upm_ZZ.mdl Initializes the UPM. q_cal_x_ZZ.mdl Calibrates the table to return to the home position. q_sine_x_ZZ.mdl Sends a sinusoidal with a specified amplitude and frequency to the shake table. q_sweep_x_ZZ.mdl Sends a sine sweep to the shake table for generating the frequency response. q_earthquake_x_ZZ.mdl General file that runs scaled historical earthquake data on the shake table. q_elcen_x_ZZ.mdl Exact copy of q_earthquake_x_ZZ.mdl but it is associated with the q_elcen_x_ZZ.wcp WinCon project. Revision: 02 Page # 16 Shake II User Manual File Name Description q_hach_x_ZZ.mdl Exact copy of q_earthquake_x_ZZ.mdl but it is associated with the q_hach_x_ZZ.wcp WinCon project. q_kobe_x_ZZ.mdl Exact copy of q_earthquake_x_ZZ.mdl but it is associated with the q_kobe_x_ZZ.wcp WinCon project. q_north_x_ZZ.mdl Exact copy of q_earthquake_x_ZZ.mdl but it is associated with the q_north_x_ZZ.wcp WinCon project. WinCon Project File q_boot_upm_ZZ.wcp Run before performing any experiments to initialize the shake table. See Section 4.2. q_cal_x_ZZ.wcp Return table to the zero position. See Section 4.3. q_sine_x_ZZ.wcp Sends a use-specified sine wave to the shake table. q_sweep_x_ZZ.wcp Sends a sine sweep to the shake table for generating the frequency response. See Section 4.4. q_north_x_ZZ.wcp Runs Northridge Earthquake. q_elcen_x_ZZ.wcp Runs El Centro Earthquake. q_hach_x_ZZ.wcp Runs Hachimoto Earthquake. q_kobe_x_ZZ.wcp Runs Kobe Earthquake. Matlab Script Files q_gain.m Calculates feedback gains used by the shake table. o_north.m Historical data of the Northridge earthquake. o_elcen.m Historical data of the El Centro earthquake. o_hach.m Historical data of the Hachimoto earthquake. o_kobe.m Historical data of the Kobe earthquake. Other q_scale.dll File that scales down actual earthquake data to fit the shake table. Table 10 Supplied Matlab, Simulink, and WinCon Files Revision: 02 Page # 17 Shake II User Manual 4.2. Calibrating Table to 'Home' The table should initially begin at the center or Home position before running any experiment. The table can be calibrated to the Home position using WinCon and the limit sensors installed on the shake table. Follow these steps to calibrate the table: Step 1. Ensure the UPM 50-25-PHI has been initialized as instructed in Section 2.2.4. Step 2. Load WinCon. Step 3. Open the project file 'q_cal_x_ZZ.wcp'. Step 4. Click on the START button in the WinCon Server window. Step 5. The UPM LEDs Cal, OK, and Enable LEDs should all be lit as the table slowly moves from its left or right position to the mid-stroke position. Depending on its starting position, the table may initially move towards the left or right limit, reverse directions, and then move towards the mid-stroke position. The table should stop moving when it is approximately in the center at which point the Home LED on the UPM will go ON and the message prompt shown in Figure 15 is displayed. Figure 15 Message prompt after running q_cal_x_ZZ Step 6. PRESS DOWN on the RED BUTTON of the deadman switch in case of emergency. If something goes wrong during an experiment, pressing the red button of the deadman switch disables the amplifier and shuts off the DC motor power. Step 7. Alternatively, the knurled knob at the end of the table can be used to manually return the table to its home position. The Home LED on the UPM will be lit when this position is reached. Step 8. If the table is not moving consult the troubleshooting guide at the end of this reference manual. Note that when the UPM is placed in the calibration mode, that is when the Cal, OK, and Enable LEDs are lit, the amplifier remains enabled when the Left or Right proximity sensor are triggered but is disabled when the Home limit sensor is activated. In contrast, the amplifier is disabled if the Left or Right sensor is triggered when the UPM is in the enabled state. The UPM is in the enabled state when the OK and Enable LEDs are lit and the UPM is placed in this state when running earthquakes and other laboratory files. Revision: 02 Page # 18 Shake II User Manual 4.3. Sending Sine Wave to Shake Table The shake table can be fed a sinusoidal signal of varying frequency and amplitude. Although there is not much analysis that can be made on the results, it is a good test to ensure the system is operating correctly. Follow this method to run the project: Step 1. Ensure the amplifier has been initialized as discussed in Section 2.2.4. Step 2. Ensure table is at HOME position before running any experiment. Otherwise the experiment may stop prematurely because the table reached the left or right limit sensors. See the procedure in Section 4.2 for calibration procedure. Step 3. Load WinCon. Step 4. Open the project file 'q_sine_x_ZZ.wcp'. As shown in Figure 16, the control panel has two knobs that enable the user to vary the amplitude and frequency of the sine wave. Figure 16 q_sine_x_ZZ Control Panel Step 5. Click on the START button in the WinCon Server window. Step 6. The Enable and OK LEDs on the UPM should be lit. Consult the troubleshooting guide if this is not the case. Step 7. The scope displays the commanded position and the resulting position of the table measured using its encoder. Figure 17 shows the scope when a sine wave with an amplitude of 0.5 in and a frequency of 5 Hz is given (by setting the control panel knobs as shown in Figure 16). Revision: 02 Page # 19 Shake II User Manual Figure 17 Shake Table Commanded and Measured Sine Position (in) Step 8. PRESS DOWN on the RED BUTTON of the deadman switch in case of emergency. If something goes wrong during an experiment, pressing the red button of the deadman switch disables the amplifier and shuts off the DC motor power. Step 9. Click on the STOP button in the WinCon Server window to terminate sine wave controller. 4.4. Variables Available for Plotting In Figure 17, two variables were observed on the plot – 'Table Command Position (in)' and 'Table Position (in) <encoder>'. The variable label includes a name describing the data, its units, and the corresponding sensor indicated in the <...> brackets. For example, the 'Table Position (in) <encoder>' is the position of the shake table in inches attained using an encoder. The <...> is not included for input variables such as the reference position signal 'Table Command Position (in)'. Table 11 lists all the input and output variables available for plotting in the 'q_sine_x_ZZ.wcp', 'q_sweep_x_ZZ.wcp', 'q_north_x_ZZ.wcp', 'q_elcen_x_ZZ.wcp', 'q_hach_x_ZZ.wcp', and 'q_kobe_x_ZZ.wcp' projects. Note that some variables are given in both imperial and metric units. Revision: 02 Page # 20 Shake II User Manual Variable Description Input Variables Table Command Position (in) Commanded position in inches. Table Command Position (cm) Commanded position in centimeters. Desired Accel (g) <workspace> Scaled acceleration from real earthquake data generated by q_scale and stored in Matlab workspace in units relative to the Earth's gravity. Desired Accel (m/sec2) <workspace> Same as variable above except accelerations are stored in m/s2. Current Command (A) Current outputted to shake table from controller in amps. Output Variables Table Position (in) <encoder> Shake table position measured in inches using table encoder. Table Position (cm) <encoder> Same as above variable except units are in centimeters. Table Speed (in/s) <encoder> Shake table speed measured in inches per second using table encoder. Table Speed (cm/s) <encoder> Same as above variable except units are in centimeters. Ball Screw Position (deg) <encoder> Angle of ball screw measured in inches using table encoder. Position Error (in) <encoder> Control error in inches between reference position and actual position measured using the table encoder. Position Error (cm) <encoder> Same as above variable except units are in centimeters. Table Accel (g) <accelerometer 0> Acceleration of the shake table relative to Earth's gravity measured using accelerometer. Table Accel (m/sec2) <accelerometer 0> Same as above variable except units are in m/s2. Revision: 02 Page # 21 Shake II User Manual Variable Description Table Accel (g) <encoder> Acceleration of the shake table relative to Earth's gravity measured using encoder (double derivative). Table Accel (m/sec2) <encoder> Same as above variable except units are in m/s2. Floor 1 Accel (g) <accelerometer 1> Acceleration of structure's first floor relative to Earth's gravity measured using accelerometer fastened to that floor. Floor 1 Accel (m/sec2) <accelerometer 1> Same as above variable except units are in m/s2. Floor 2 Accel (g) <accelerometer 2> Acceleration of structure's second floor relative to Earth's gravity measured using accelerometer fastened to that floor. Floor 2 Accel (m/sec2) <accelerometer 2> Same as above variable except units are in m/s2. Table 11 Variables Available for Plotting Follow the procedure below to open plot a new variable, add variables to an existing plot, and adjust the time scale of the scope: Step 1. Open the list of available variables to be plotted by clicking on the Open Plot button in the WinCon Server window shown in Figure 18. Figure 18 WinCon Server Window Step 2. Open the plots to be viewed in real-time by selecting the appropriate corresponding variables. For example, as depicted in Figure 19, to view the acceleration of the shake table measured from the accelerometer in g units select the variable Table Accel (g) <accelerometer 0>. Revision: 02 Page # 22 Shake II User Manual Figure 19 Variables Available for Plotting Step 3. Additional variables can be viewed on the same plot by selecting the File menu on the scope, clicking on Variables, and choosing the variables to be added. The Select variables to display window is similar to Figure 19 and can also be accessed by clicking right on the plot area. Step 4. The time scale of a plot can be adjusted by selecting Update on the scope and choosing Time Buffer, as shown in Figure 20. Figure 20 Changing Time Buffer Size on Scope Revision: 02 Page # 23 Shake II User Manual 4.5.Finding Frequency Response of a Structure Floor The frequency response of a structure's floor can be found by applying a sine sweep from 1 Hz to 15 Hz in 30 s with a 0.2 cm amplitude to the table and measuring the resulting accelerations. Follow the procedure below to find the frequency response: Step 1. Ensure the amplifier has been initialized as discussed in Section 2.2.4. Step 2. Ensure table is at HOME position before running any experiment. Otherwise the experiment may stop prematurely because the table reached the left or right limit sensors. See the procedure in Section 4.2 for calibration procedure. Step 3. Load WinCon. Step 4. Open the project file 'q_sweep_x_ZZ.wcp'. As shown in Figure 21, the control panel has a knob that allows the user to change how much the amplitude increments during the sweep. Figure 21 Sine Sweep Control Panel Step 5. Click on the START button in the WinCon Server window. By default the project opens with a scope showing the response of the table accelerometer. Step 6. PRESS DOWN on the RED BUTTON of the deadman switch in case of emergency. If something goes wrong during an experiment, pressing the red button of the deadman switch disables the amplifier and shuts off the DC motor power. Step 7. WinCon will restart the sine sweep after it is complete in 30 seconds. Click on the STOP button in the WinCon Server window to end the WinCon session. The data read from the sensors can be saved in Matlab for analysis. For example, the supplied script 'freq1_15.m' uses FFT commands and the frequency response measured for floor structures to calculate the transfer function. Revision: 02 Page # 24 Shake II User Manual 4.6. Performing Analysis on Collected Data The data shown in a scope can be saved as a Matlab script file and used for analysis later. The scope is saved by choosing Save As M-File under the Save item in the File menu of the scope. The plot can be viewed by running the script in Matlab. The script also loads the time and data values of the plot, called plot_time and plot_data, into the workspace. This can be used for analysis or generating other plots. When running the system in real-time the data in the scope is constantly being updated. The scope can be frozen by clicking on Update and selecting Freeze Plot. This halts the updating and makes it easier for the correct data to be captured. The scope can be unfrozen by selecting Real-Time under the Update menu on the scope. 4.7. Running a Standard Earthquake Actual earthquake data can be scaled and ran on the shake table. There are four standard historical earthquakes that are already scaled for the user to test on the shake table. They are the Northridge, El Centro, Hachimoto, and Kobe earthquakes. Follow the procedure below to simulate one of these earthquakes on the shake table: Step 1. Ensure the amplifier has been initialized as discussed in Section 2.2.4. Step 2. Ensure table is at HOME position before running any experiment. Otherwise the experiment may stop prematurely because the table reached the left or right limit sensors. See the procedure in Section 4.2 for calibration procedure. Step 3. Load WinCon. Step 4. Open the earthquake project file. For example, open 'q_north_x_ZZ.wcp' to run the Northridge earthquake. The earthquakes' corresponding project file names are: Northridge – q_north_x_ZZ.wcp El Centro – q_elcen_x_ZZ.wcp Hachimoto – q_hach_x_ZZ.wcp Kobe – q_kobe_x_ZZ.wcp Step 5. Click on the START button in the WinCon Server window. Step 6. PRESS DOWN on the RED BUTTON of the deadman switch in case of emergency. If something goes wrong during an experiment, pressing the red button of the deadman switch disables the amplifier and shuts off the DC motor power. Step 7. WinCon stops automatically after the earthquake data has run through. The duration of the session depends on the earthquake project selected. The data read from the sensors can be saved in Matlab for analysis, as discussed in Section 4.7. Revision: 02 Page # 25 Shake II User Manual 4.8. Scaling a Real Earthquake New earthquake data can also be ran on the shake table. However, it must first be scaled down to fit the table. The actual earthquake data can be scaled using the function [Tc,Xc,Ac,Te] = q_scale(t,a,xmax), where: Variable Description Units t Array of time at equal sampling intervals in seconds s a Array of acceleration record that matches t array g xmax Maximum deviation of motion from the home position cm Tc Command time array s Xc Position command array cm Ac Acceleration array found by differentiating Xc twice. cm⋅s-1 Te Duration of run. s The user supplies the earthquake's time and position data along with the maximum deviation of the shake table. Variable xmax should not exceed the limit of the shake table. The function returns scaled time, position, acceleration, and duration of the earthquake. This returned array can then be used in a Simulink diagram to run the earthquake on the shake table. For example, the new earthquake data tnew and anew is to be scaled down for use on the shake table. The xmax variable is set to 3 cm to remain in the safety limits of the table. The data is scaled using the following command in the Matlab prompt: [Tc,Xc,Ac,Te] = q_scale(tnew,anew,3.0). Here is a sample output of the file: Original sampling period: 0.02000 Scaling acceleration record Revision: 02 Page # 26 Shake II User Manual Step 1 of 3 Step 2 of 3 Step 3 of 3 Optimization ratio when done = 1.000000 Time = 9.908512 Warning: Subscript indices must be integer values. *** Done *** *** Displacement scaled from original movement of 27.46 cm to 3.00 cm *** Time scaled from original duration of 29.98 seconds to 9.91 seconds *** Record size is 1550 samples *** Use of this Software is under license from Quanser Consulting Inc. *** Any results derived from this use should be duly acknowledged by the statement: *** Acceleration and position scaling performed using software licensed from Quanser Consulting Inc. After scaling the earthquake data, q_scale generates the plot shown in Figure 22. The upper graph compares the real and scaled earthquake accelerations and the bottom graph depicts the position reference given to the shake table. Note that the accelerations overlap when plotted on the same time-scale because both the amplitude and the time is attenuated. Figure 22 Real vs. Table Acceleration and Position Commanded to Shake Table Revision: 02 Page # 27 Shake II User Manual The arrays Tc, Xc, Ac, and Te returned by the q_scale function can be used in a Simulink diagram to simulate earthquakes on the shake table. The actual acceleration measured from the shake table accelerometer should match the scaled accelerations from the q_scale function when the shake table's reference position is the Xc generated by the q_scale function. However, the measured accelerations from the table should be compared with the desired acceleration from the q_scale function in the frequency domain (i.e. spectral analysis). If their correlation is analyzed in the time domain there will be a time delay between the actual and desired accelerations. 4.9. Compiling a New Earthquake This section describes how to create a new WinCon project to run new earthquake data on the shake table. Follow the method below: Step 1. Ensure the amplifier has been initialized as discussed in Section 2.2.4. Step 2. Ensure table is at HOME position before running any experiment. Otherwise the experiment may stop prematurely because the table reached the left or right limit sensors. See the procedure in Section 4.2 for calibration procedure. Step 3. Enter the time, tnew, and acceleration, anew, of the actual earthquake in the Matlab workspace. Step 4. As described in Section 4.7, scale the data to fit the shake table using: [Tc,Xc,Ac,Te] = q_scale(tnew,anew,xmax). Ensure the return variables are exactly as specified. Step 5. Open the Simulink model called q_earthquake_x_ZZ.mdl. This is a standard Simulink file that uses the arrays Tc, Xc, and Ac, and the parameter Te to simulate the earthquake on the shake table. The Simulink diagram therefore runs whatever earthquake is loaded in the Matlab workspace. Step 6. Save q_earthquake_x_ZZ.mdl as another Simulink file describing the earthquake. For example, q_earthquake_california_x_ZZ.mdl. Step 7. Run the Matlab script file q_gain.m to set all the parameters required for the earthquake Simulink model. This includes the ωa and ωf low-pass filter parameters, the ωd high-pass filter parameter, and the control gains Kp, Kd, and Kf. It is suggested the default filter parameters and control gains set by q_gain.m be used. Step 8. Click on WinCon in the Simulink diagram menu and select Build. As the code is being generated the Matlab window outputs a series of messages. This process may be lengthy on first usage due to the amount of files that need to be generated for real-time execution. Step 9. The code is finished being built when the WinCon Server window appears. Revision: 02 Page # 28 Shake II User Manual Step 10.Open the plots to be viewed in real-time by clicking on Open Plot in the WinCon Server Window and selecting the appropriate corresponding variables. See Section 4.5 for instructions on how to select variables for plotting. Step 11.Adjust the time scale of the plot (s) to view the entire earthquake response by selecting Update on the scope and choosing Time Buffer. Set the buffer to a few seconds more than the duration of the earthquake (Te value in Matlab workspace). Step 12.The current plot, real-time controller, and data loaded in the workspace can all be saved as a WinCon project for future use (similar to the standard earthquakes supplied). Go to File in the WinCon Server window and select Save As to save this package as a *.wcp file. Step 13.Click START on the WinCon Server window. Step 14.PRESS DOWN on the RED BUTTON of the deadman switch in case of emergency. If something goes wrong during an experiment, pressing the red button of the deadman switch disables the amplifier and shuts off the DC motor power. Step 15.WinCon stops automatically after the earthquake duration of the earthquake. Step 16.Collect the plot data by selecting File on the scope menu and choosing Save As M-File under the Save menu item, as explained in Section 4.7. The plot of a sensor can be viewed by running the saved script in Matlab. Revision: 02 Page # 29 Shake II User Manual 5. Troubleshooting Guide This section provides the user with a list of solutions to the questions that may occur when setting up the shake table. Q1. Why are the Left and Right LEDs on the UPM flashing? The UPM has not been initialized yet. See Section 2.2.4 for the UPM 50-253PHI initialization procedure. Q2. Why is the Left or Right LED lit after undergoing the UPM initialization procedure? The table was above the Left or Right proximity sensors when the boot-up procedure was ran. See Section 4.2 to calibrate the table to the Home position Q3. Why is the OK LED on the UPM not lit when running a WinCon project? The E-Stop button is either pressed down or improperly connected to the UPM. Stop the WinCon controller and turn off the UPM. Then, verify that the deadman switch and the UPM are properly connected and ensure the E-stop button is in the released upright position. Q4. Why is the Enable LED on the UPM not lit when running a WinCon project? This indicates that the UPM amplifier is not ready to be enabled. Go through the UPM initialization procedure detailed in Section 2.2.4 and the calibration procedure in Section 4.2. Q5. Why is the shake table not moving when running q_cal_x_ZZ.wcp, q_sine_x_ZZ.wcp , q_sweep_x_ZZ.wcp , q_north_x_ZZ.wcp , q_elcen_x_ZZ.wcp , q_hach_x_ZZ.wcp, or q_kobe_x_ZZ.wcp WinCon projects? Is the red power LED in the top-left corner of the UPM lit? If not turn the switch to the OFF position and ensure the AC cord is securely connected. If after switching the UPM ON the LED is still not lit, the fuse may be blown. Replace the fuse and try re-powering the UPM. Is the red LED on the terminal board lit? If NOT then the fuse may be blown, there may be a lack of power being supplied to the terminal board, or some other problem is associated with the board. See the corresponding data acquisition card manual for details on handling this situation. See Section 2.2.4 and go through the UPM 50-25-3PHI initialization procedure. Once complete the red light power diode on the UPM should be ON. The Left, Home, or Right LED could be ON as well depending on the location of the table during the boot-up procedure. Go through the calibration procedure detailed in Section 4.2. If the table does Revision: 02 Page # 30 Shake II User Manual not move towards the Home position and the OK LED on the UPM is OFF then the E-stop button may be pressed down. Stop the WinCon controller, shut off the UPM, and make sure the E-stop button is in the upright position (i.e. wind the knob clockwise indicated by the arrows) and confirm that it is properly connected to the UPM. Try again to calibrate the shake table as described in Section 4.2 If the table still does not move to the Home position then double-check all the connections, especially the connections from the UPM to the shake table and retry the calibration. Revision: 02 Page # 31 Shake II User Manual Appendix A A.1.Signals used to Initialize 50-25-3PHI UPM The q_boot_upm_ZZ WinCon controller generates and sends the enable and calibration signals shown in Figure 23 to the UPM's AMP_EN and AMP_CAL control lines, respectively. The enable and calibrate signals are both initialized at 0V in WinCon. The WinCon controller then brings the UPM's AMP_CAL line high, connected to Digital Output #8, and sends a low pulse for 200 milliseconds. It also pulls the AMP_EN line, connected to Digital Output #9, to low. WinCon automatically stops the real-time code after 0.5 seconds. This should stop the flashing and make the amplifier ready to be enabled. You can now exit WinCon without saving the project. Figure 23 UPM Initialization Signals A.2.Signals used to Enable 50-25-3PHI UPM The UPM amplifier is enabled by any WinCon controller that sends a signal to the motor. The UPM is in the enable state when the Enable and OK LEDs are lit and the signals required to place it in this mode is shown in Figure 24. Revision: 02 Page # 32 Shake II User Manual Figure 24 UPM Amplifier Enable Signals The 'q_sine_x_ZZ' WinCon controller generates and sends the enable and calibration signals shown in Figure 25 to the UPM's AMP_CAL, connected to Digital Output #8, and AMP_EN, connected to Digital Output #9, control lines. This is in addition to sending a user-controlled sine wave. The enable and calibrate signals are both initialized to 0V in WinCon. The WinCon controller keeps the UPM's AMP_CAL line to 0V for the duration of the session. The AMP_EN is initially set to 1V and after 0.5 seconds is pulsed down to 0V for 200 milliseconds. The UPM amplifier remains enabled as long as AMP_CAL sits at 0V while AMP_EN stays at 1V. The PIC in the UPM disables the amplifier when the WinCon controller is terminated (because it brings AMP_CAL and AMP_EN to 0V on exit) or if the Left or Right proximity sensors are activated. Note that this series of signals is required to run any real-time experiments using the 5025-3PHI UPM and the amplifier is only enabled after 0.7 seconds. A.3.Signals used to Calibrate 50-25-3PHI UPM The UPM must be placed into calibration mode in order to auto-center the table. The UPM is in calibration mode when its Cal, Enable, and OK LEDs are lit. In normal operation, the amplifier is disabled when the Left or Right proximity sensors are triggered. In this case, the amplifier is disabled when the Home sensor is activated. The enable and calibration signals needed to place the UPM in the calibration mode is explained next. Revision: 02 Page # 33 Shake II User Manual Figure 25 UPM Calibration Signals The 'q_cal_x_ZZ.wcp' WinCon project generates and sends the enable and calibration signals shown in Figure 25 to the UPM's AMP_CAL, connected to Digital Output #8, and AMP_EN, connected to Digital Output #9, control lines. The enable and calibrate signals are both initialized at zero in WinCon. The WinCon controller brings the UPM's AMP_CAL line to high and then brings it to 0V after 1.1 seconds. The AMP_EN is initially set to 1V and after 1.2 seconds is pulsed down to 0V for 200 milliseconds. After this initial sequence, the amplifier in the UPM remains enabled as long as AMP_CAL sits at 0V while AMP_EN stays at 1V. The WinCon controller stops when the Home position has been reached and it sets the AMP_CAL and AMP_EN control lines back down to 0V before terminating, effectively disabling the amplifier. Revision: 02 Page # 34