1
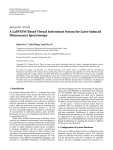
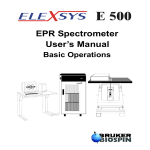
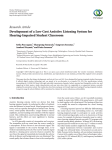
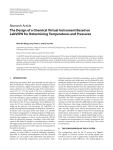
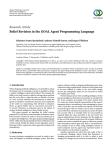
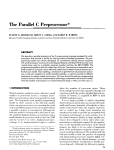
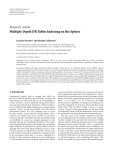
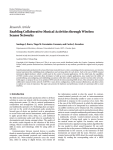
Hindawi Publishing Corporation
Journal of Automated Methods and Management in Chemistry
Volume 2011, Article ID 457156, 7 pages
doi:10.1155/2011/457156
Research Article
A LabVIEW-Based Virtual Instrument System for Laser-Induced
Fluorescence Spectroscopy
Qijun Wu,1, 2 Lufei Wang,1 and Lily Zu1
1 Department
2 Department
of Chemistry, Beijing Normal University, Beijing 100875, China
of Chemistry, Bijie University, Bijie 551700, China
Correspondence should be addressed to Qijun Wu, [email protected]
Received 30 July 2011; Accepted 28 September 2011
Academic Editor: Lu Yang
Copyright © 2011 Qijun Wu et al. This is an open access article distributed under the Creative Commons Attribution License,
which permits unrestricted use, distribution, and reproduction in any medium, provided the original work is properly cited.
We report the design and operation of a Virtual Instrument (VI) system based on LabVIEW 2009 for laser-induced
fluorescence experiments. This system achieves synchronous control of equipment and acquisition of real-time fluorescence data
communicating with a single computer via GPIB, USB, RS232, and parallel ports. The reported VI system can also accomplish
data display, saving, and analysis, and printing the results. The VI system performs sequences of operations automatically, and
this system has been successfully applied to obtain the excitation and dispersion spectra of α-methylnaphthalene. The reported
VI system opens up new possibilities for researchers and increases the efficiency and precision of experiments. The design and
operation of the VI system are described in detail in this paper, and the advantages that this system can provide are highlighted.
1. Introduction
Laser-induced fluorescence (LIF) is a technique that relies
on the measurement of the excited state fluorescence that
results from photoexcitation. The excitation source for
molecular LIF is typically a tunable dye laser so that selective
excitation and high resolution can be achieved. Combined
with the supersonic-jet expansion technique, LIF has been
used to study the excited state structures of molecules and
the ultra-fast dynamics of molecular systems [1]. LIF has
also been successfully applied for quantitative measurement
of concentrations in combustion, plasma, spray, and flow
phenomena, in some cases visualizing concentrations down
to nanomolar levels [2].
Unlike other analytical spectroscopy techniques, where
ready-to-use commercial spectrometers have everything for
the sample detection in a package, laboratories usually design
and set up the LIF experimental instruments by themselves
in order to satisfy individual research needs. In addition
to hardware installation, LIF also requires synchronized
and automated control software for laser function, data
acquisition, and communication between instruments [3, 4].
Most laboratories develop homemade programs for their
experiments using different programming languages, such
as Visual C++, LabVIEW, Visual Basic, or Turbo Pascal, but
text-based languages have the shortcomings of long developing cycles and difficulties in maintenance and expansion
[5]. NI LabVIEW 2009 (National Instrument Inc., USA)
is a graphical programming tool which can be employed
to develop sophisticated measurements [6–8] and control
[9, 10] systems using intuitive graphical icons and wires that
resemble a flowchart instead of written lines of text [11–16].
In this paper, a virtual instrument system based on
LabVIEW 2009 was developed for LIF experiments. This
system can simultaneously control the scanning of a dye laser
and a monochromator, the operation of a molecular pump,
and data acquisition. Furthermore, it achieves real-time
data processing and monitoring of individual instruments.
An application of this program in the LIF spectroscopy
examination of α-methylnaphthalene is shown in this paper.
Simple modifications for adapting this program to different
LIF setups are also illustrated.
2. Configuration of System Hardware
There are two different kinds of spectra in LIF spectroscopy,
dispersed spectra, and excitation spectra. The dispersed
spectra are obtained with fixed excitation laser wavelength
and the fluorescence spectrum is analyzed. In excitation
spectra, the laser wavelength exciting the molecules to a
2
Journal of Automated Methods and Management in Chemistry
Scan control (parallel port)
304–316 nm Doubled 608–632 nm Dye laser
Nd: YAG
External
trigger
a-methylnaphthalene/Ar
Pump beam
Probe beam
VI system
based on LabVIEW
Vacuum Molecular
pumps
gauge
1
PMT
Signal
2
Monochromator PMT
GPIB
Oscilloscope
Scan control (USB)
Serial port (RS-232)
Serial port (RS-232)
Figure 1: Hardware structure of VI System.
higher energy state is scanned and the total fluorescence
is measured. Information on lower electronic states can be
obtained by dispersed spectra, while the excitation spectra
reveal parameters (energy levels, structure information, etc.)
of upper level electronic states.
A conventional experimental setup for obtaining laserinduced fluorescence excitation spectra and dispersed spectra are depicted in Figure 1. The sample vapor is injected
into a vacuum chamber, whose vacuum is maintained by a
molecular pump and a mechanical pump, via a supersonic
jet. The excitation laser beam (probe beam) is provided
by a frequency doubled dye laser pumped by a Nd:YAG
laser. The probe beam intercrosses the sample 10 to 15 mm
downstream of the supersonic jet nozzle; when free radicals
are studied, a pump laser beam propagates across the sample
close to the nozzle and generates the free radicals. Fluorescence of the excited molecules is collected perpendicular to
the probe beam by the optics and imaged onto the detection
devices. For excitation spectra, total fluorescence is detected
by PhotoMultiplier Tube (PMT) and converted into electronic signals, which are received and displayed in real time
on an oscilloscope (synchronized by the triggers from the
Nd:YAG laser). A General-Purpose Interface Bus (GPIB) card
installed in the computer transfers data from the oscilloscope
to the computer via the GPIB port, and data acquisition and
processing are executed by the VI system. At the same time,
the VI controls the dye laser scans by sending trigger pulses
to the laser controller via the parallel port of the computer.
The acquisition and control process for dispersed spectra
are similar to those for excitation spectra. For dispersed
spectra, the fluorescence signals are transmitted through a
monochromator before being collected by the PMT. The
VI system communicates with and controls the scan of the
monochromator via the USB port in the monochromator. In
addition, the VI system also communicates with the vacuum
gauge via an RS232 port, and the system displays the in
situ values of the vacuum. The VI system also builds up
an interface to communicate with the operating program
of the individual instruments (e.g., the dye laser and the
molecular pump); specific operating programs are usually
included with the instruments at the time of purchase.
3. Programming
Figure 2 shows the flow chart of the VI system that performs the LIF experiments and data processing tasks. It
incorporates several subVIs, each one of which carries out a
specific function, including data acquisition and display, data
processing, as well as generating and saving the results.
There are three icons, Excitation Spectrum, Dispersed
Spectrum, and Data Processing, on the front page of the
virtual instrument system, each is dedicated to a specific
action or experimental technique. When an icon is selected,
the corresponding subVI program will be activated, and
it will open the panel where specific tasks can be executed. For programming, an Event Structure for incident
response is used to call the corresponding subVI [17].
When the subVI starts, the Event Structure waits until the
precompiled program code is executed and the task is
finished, then the Event Structure returns to wait for another
event.
3.1. Program for Excitation Spectrum. To fulfill the requirements of LIF excitation spectra, the Excitation Spectrum
subVI consists of fluorescence data acquisition, data display and saving, vacuum monitoring, communication with
other application modules, and synchronization of laserwavelength-scan subVIs.
Journal of Automated Methods and Management in Chemistry
VI system
Stop?
Yes
No
Excitation spectrum
Data processing
Set parameters
Regain
Acquire
Process
Acquire
Save
Save
Save
Yes
Return?
Set parameters
Print
No
No
Return?
Dispersed spectrum
No
Return?
Yes
Yes
Figure 2: Flow chart of VI system.
3.1.1. Data Acquisition and Processing. In the experiment, the
fluorescence signal is collected by the PMT and transferred to
a TDS3032B oscilloscope. The TDS3032B oscilloscope supports the GPIB interface communication with a computer
where the interface is an eight-bit parallel bus that provides
high-speed data transfer and multiple-instrument control
[18]. Detailed programming is shown in the upper left Flat
Sequence Structure of Figure 3. We invoked the GPIB Write
function from the LabVIEW Instrument I/O function to set
the GPIB address of the oscilloscope and specify the data
parameters to be transferred from the oscilloscope, including
the portion of the waveform that users want to transfer, the
waveform source, data format, and the number of bytes per
data point. We then invoked the GPIB Read function and
wired the corresponding GPIB address of the oscilloscope
to the GPIB Read, and also specified the number of bytes
the function read from the oscilloscope. Finally, we called
the function nodes Math Pattern, String Subset, Decimate
1D Array, and Join Numbers to receive waveform data from
the oscilloscope and display it in situ in the front panel
waveform graph. Data from different oscilloscope channels
(CH1, CH2, or Dual CHs) can be acquired by wiring selected
terminals (in a combo box) to the case structure prior to
data acquisition. For the end-user, the above process is easily
achieved by choosing the channel from the pull-down list on
the front panel (Figure 4) and clicking on the Acquire button.
There are two sequential subdiagrams in the upper right
case structure of Figure 3. The left one performs the analysis
and processing of the fluorescence data obtained from the
TDS3032B oscilloscope at a particular laser wavelength. Four
cursors were created, and property nodes were set to acquire
the cursor’s horizontal axis positions on a waveform graph
and to define the gate width. We then used the Array Subset
3
to return two portions of fluorescence data between the
two sets of cursors. On the front panel, users can directly
drag the cursors to where they want, or they can simply
set positions in the cursor legend to choose the gate on
the graph. Integrals of data in both gates are computed
separately using the 1D Numeric Integration.vi, in which the
integration method is the Trapezoidal Rule. The difference
between the two gate integrals is calculated for the purpose
of background subtraction. Finally, the fluorescence intensity
and the current wavelength are sent to the XY Graph for realtime spectroscopy display. The front panel of the fluorescence
Excitation Spectrum is shown in Figure 4, in which Choose
Gates is shown in the upper portion and Spectroscopy
Display in the lower part.
As soon as the data processing is complete, a TTL trigger
is sent to step the dye laser to the next wavelength. TTL
subVI, shown in the right sequential diagram in the case
structure of Figure 3, calls the Outport.vi in Port I/O, which
specifies a parallel port address for sending the trigger pulse
and also defines the pulse width. A BNC cable is made with
the inner core wired to the specified TTL pulse pin of the
computer parallel port, and the outside shield wired to the
ground pin. Thus, a TTL signal can be sent to the dye laser
control unit from the computer parallel port when a data
collection cycle is completed and the laser is stepped to the
next scan wavelength. The settings for start position, end
position, and step size of the laser wavelength scan must be
identical in our VI program and in the laser control software.
The TTL subVI is placed in a comparison case structure.
If the current position is smaller than the end position, the
comparison function will return a False value to initiate the
program TTL.vi which will move the laser to the next wavelength to start a new data acquisition and processing cycle.
If the current position is greater than or equal to the end
position, the True case gives a message dialog box indicating
that data acquisition (DAQ) is finished. Subsequently, data
can be saved by employing the Write to Spreadsheet file and
the Build Array and Transpose 2D Array nodes. This task is
completed by clicking on the save button on the front panel
and the fluorescence data will be saved according to the file
name entered. The data acquisition process can be stopped
at anytime by clicking the Acquire button again (in case the
user wants to interrupt the experiment). An abort function
is also programmed using the Stop node in the Application
Control function, so users can terminate the whole VI system
by clicking on the Abort-Execution button in the upperright corner (shown in Figure 4). For convenience, the help
function of the program can be shown by clicking on the
Help button on the front panel.
3.1.2. Vacuum Monitoring and Accessing Other Application
Software. The program for the real-time display of the
vacuum gauge is shown in the lower-left parallel loop of
Figure 3. To communicate with the vacuum gauge, the Serial
function templates in the LabVIEW Instrument I/O can be
selected. Parameters such as VISA resource name, baud rate,
data bits, and parity in the VISA Configure Serial Port are
set according to the vacuum gauge communication protocol
[19, 20]. The VISA write function sends command characters
4
Journal of Automated Methods and Management in Chemistry
Figure 3: Program for excitation spectrum.
Excitation Spectrum for LIF
cur0
ChooseGates
170
Cursor 0
CH 1
161
0.3
210
0.1
400
-0.2
Cursor 3
CH 1
cur3
431
481
AbortExecution
File dialog
Browse . . .
TF
?
CH 1
CH 2
True
i
File name and path
0.0
Cursor 2
CH 1
cur2
220
0.5
Cursor 1
CH 1
cur1
1.0
-0.5
450
-0.3
-1.0
0
50
100
150
200
250
300
350
400
450
500
Time
StartPosition
Return
AccessOtherPrograms
ChooseChannel
Save
Acquire
VaccumMeter
9.7E-1
Dual CHs
Help
Reset
Pa
SpectroscopyDisplay
Cursor X
314.85
StepSize
304.000
0.010
EndPosition
Current
316.000
316.010
Run (false)
TF
Cancel
TF
V
100
True
Y 2.369
6.000
CH 1
5.000
CH 2
F
4.000
?
3.000
Error
?!
2.000
1.000
File name and path
0.000
-1.000
304.00
305.00
306.00
307.00
308.00
309.00
310.00
311.00
312.00
313.00
314.00
315.00
316.00
317.00
System exec. vi
wavelength
Figure 4: Front panel for excitation spectrum.
Figure 5: SubVI for Access Other Programs.
to the vacuum gauge and receives vacuum values in return.
The nodes String to Byte Array, String to Single Precision Float,
and Index Array transform the vacuum data into the required
format and display the values on the front panel indicator.
For convenience, the VI system was designed to interface
with the other applications that already exist for the individual instruments. By clicking on the Access-Other-Programs
button on the excitation spectrum panel in Figure 4, users
can select the application program by browsing the computer
disks. Figure 5 shows the block diagram of the subVI for
accessing other programs. The Browse Boolean command
is wired to the upper case structure, which includes a File
Dialog Express VI. The application can be selected when
the file path is displayed on the front panel. When the
user confirms the file selection, the application program is
activated via the System Exec.vi shown in the lower case
structure in Figure 5.
trometer (Beijing Zolix Instrument Company). Communication between the Omni-λ3008 spectrometer and the
computer is achieved via a USB port on the Omni-λ3008
spectrometer. The Omni-λ3008 spectrometer is operated by
a ZolixOmniSpec ActiveX (OmniSpec; provided by the manufacturer). In the LabVIEW VI system, we invoke an ActiveX
Container and created a ZolixOmniSpec ActiveX object; an
Automation Open in the ActiveX functions palette is called,
which returns an automation reference number and allows
the specific functions programmed in the ZolixOmniSpec
object to be accessed. Property nodes in the ActiveX palette
are used for reading the USB port information. The Omniλ3008 spectrometer USB serials string is found by calling
the SearchZolixUSBDevice and GetZolixUSBSerial invoke
methods, and then the string is wired to the USBSerials
property node. The invoke commands (Open and Connect)
are used for setting the connection status of the monochromator, and the status is displayed by the Boolean indicator
on the front panel. The initial states of the Omni-λ3008
monochromator components, such as the exit port, grating
and current wavelength, are obtained by employing the
GetExitPort, GetCurrentGrating, and CurrentWave methods,
respectively. Next, different parameters are set according
3.2. Program for Dispersed Spectra. A change in the dispersed spectrum program is the addition of synchronizing
fluorescence DAQ with a monochromator wavelength scan
instead of a dye laser scan. The 300i monochromator used
in our dispersed LIF experiment was an Omni-λ3008 spec-
Journal of Automated Methods and Management in Chemistry
5
Figure 6: Front panel for dispersed spectrum.
Figure 7: Program for dispersed spectrum.
to experimental requirements. This step involves the user’s
input of the experimental parameters by selecting from the
pull-down menu on the front panel. The SetExitPort and
SetCurrentGrating in the case structure return to the default
state (which is set as Do Nothing) as soon as the commands
are given to avoid sending looped control commands to
the OmniSpec. The Prompt User for Input function in the
Dialog and User Interface is called, and it prompts the user
to input a specific wavelength, which is subsequently sent to
the wavelength terminal in the MoveToWave method. After
using the MoveToWave method, a Stop function is required
to stop the grating from moving. The operation panel and
program are shown in Figures 6 and 7.
A similar comparison case structure is applied here
to step the monochromator scan wavelength as the one
used in the Excitation LIF spectrum program. Identically to
the excitation experiment, the start position, end position,
step size of the monochromator scan, and the gate for
fluorescence signal integration will await user input on front
panel. Executed from the front panel, data acquisition will
begin, and the real-time spectrum will be displayed in the
XY Graph. Using the Save icon on the front panel, the
experimental data can be stored in the computer via Write to
Spreadsheet File.vi. An Automation Close is programmed in
the VI system to disconnect the USB interface to the Omniλ3008 and release the system resources when the Dispersed
Spectrum subVI is closed.
3.3. Program for Data Processing. The data processing subVI
(Figure 8) can conveniently redisplay and analyze previously
saved data [21, 22]. This subVI can automatically accomplish
wavelength calibration, unit conversion, and peak and
6
Journal of Automated Methods and Management in Chemistry
Figure 8: Front panel for data processing.
band-width reading of the spectrum curve. Users can also
inspect each dataset using cursor move, data refresh, figure
enlarge and diminish, and graph recover tools. In the VI
programming, a File Dialog function will prompt the user
to upload a data file. The Read From Spreadsheet File.vi
and Index Array function will convert the wavelength and
intensity data to x and y arrays, respectively. Wavelength
unit conversion is realized by the case structures, and then
the processed data will be sent to the XY Graph for display
and saving by Write To Spreadsheet File.vi. Spectrum graph
printing is achieved by using the relevant Report Generation
functions.
4. Application
The VI system reported here has been used to take fluorescence spectra of molecules and free radicals in our
laboratory. The excitation spectrum of a-methylnaphthalene
is shown in Figure 4 (in wavelength, nm) and Figure 8
(in wavenumber, cm−1 ). Dual CHs were used for data
acquisition, one for studying the fluorescence signal and
another for monitoring the laser power fluctuation using a
photodiode. High resolution and signal-to-noise ratios were
achieved in the spectra. The obtained excitation spectrum
was consistent with previously reported results [23, 24] with
spectral origin at 31767 cm−1 (314.80 nm). The dispersed
fluorescence spectrum of a-methylnaphthalene, shown in
Figure 6, was obtained by exciting the most prominent band
at the wavelength of 310.70 nm. Dispersed spectra utilizing
excitation of other bands (306.50 nm and 314.80 nm) were
also obtained. Spectral analysis was conducted assisted by
theoretical calculation and would be reported elsewhere
[25].
5. Conclusions
A VI system for LIF spectroscopy based on LabVIEW 2009
has been developed. The VI system integrates a variety
of laboratory equipment and controls the experiment data
acquisition process using a single computer via GPIB, USB,
RS232, and parallel ports. It achieves synchronous control
of equipment and real-time fluorescence data acquisition.
Data display, saving, and analysis can also be accomplished
using the reported VI system. Furthermore, the VI system
can monitor running of individual instruments and changing of vacuum and laser power in real time. Therefore,
the users can timely judge, analyze, and process on-site
information, and high resolution and signal-to-noise ratios
of molecular or free radicals can be easily achieved in
the spectra. Our approach has been to develop the VI
system for general use in LIF experiments. The instruments
used in this paper, such as the Nd:YAG laser (SureliteIII,
Continuum), dye laser (NarrowScan, Radiant Dye), digital
delay generator (DG535, Stanford), oscilloscope (TDS3032B,
Tektronix), and PMT (CR110, Hamamatsu) are commonly
used in many laboratories. When different instruments are
to be used in an experiment, the users simply replace the
communication method according to the communication
protocol for the corresponding replacement instrument or
change the file path in the Access-Other-Program subVI
by following the instructions provided in the VI. The VI
system has user-friendly front panel windows and is easy to
operate. Help and Instructions implanted in the program will
assist the user in becoming familiar with each application
step.
The VI system was tested extensively and applied in the
determination of the excitation spectrum and the dispersed
spectrum of α-methylnaphthalene with satisfactory experimental results. The VI system promotes and expands the
capabilities of individual instruments, and it is an intelligent
improving for existing hardware sources of laboratory. Lots
of complicated functional operations are merely finished at
the click of button on the VI system. The VI system not
only avoids the manual error during the separate instrument
control, data acquisition, and data processing, but ensures
the accuracy and repeatability of experimental data and
improves the efficiency of experiment. Furthermore, the
VI system has a wide expandability of functions, minor
modifications can be applied to a different LIF setups based
on automatic measurement and control. The VI system will
be provided upon request.
Acknowledgments
The authors are pleased to acknowledge financial support of
this research by the National Natural Science Foundation of
China (Grant no. 20673013). The authors also acknowledge
grants from the Major State Basic Research Development
Program (Grant no. 2007CB815206) and the Program for
NCET.
References
[1] S. Gopalakrishnan, L. Zu, and T. A. Miller, “Rotationally reso −X
transition in multiple
lved electronic spectra of the B
conformers of 1-butoxy and 1-pentoxy radicals,” Journal of
Physical Chemistry A, vol. 107, no. 26, pp. 5189–5201, 2003.
[2] K. H. Katharina, “Quantitative laser-induced fluorescence:
Some recent developments in combustion diagnostics,” Applied Physics B Photophysics and Laser Chemistry, vol. 50, no. 6,
pp. 455–461, 1990.
[3] L. Zhang, K. M. Callahan, D. Derbyshire, and T. S. Dibble,
“Laser-induced fluorescence spectra of 4-methylcyclohexoxy
radical and perdeuterated cyclohexoxy radical and direct
Journal of Automated Methods and Management in Chemistry
[4]
[5]
[6]
[7]
[8]
[9]
[10]
[11]
[12]
[13]
[14]
[15]
[16]
[17]
[18]
[19]
[20]
kinetic studies of their reactions with O2,” Journal of Physical
Chemistry A, vol. 109, no. 41, pp. 9232–9240, 2005.
J. Yang, X. Zhang, D. J. Clouthier, and R. Tarroni, “Heavy
atom nitroxyl radicals. III. Identification of the Cl2 P=S free
radical in the gas phase by laser spectroscopy and ab initio
calculations,” Journal of Chemical Physics, vol. 131, no. 20, pp.
204307–204313, 2009.
H. Meng, J. Li, and Y. Tang, “The design and application of
virtual ion meter based on LABVIEW 8.0,” Review of Scientific
Instruments, vol. 80, no. 8, Article ID 084101, 5 pages, 2009.
S. Nuccio and C. Spataro, “Assessment of virtual instruments
measurement uncertainty,” Computer Standards and Interfaces, vol. 23, no. 1, pp. 39–46, 2001.
G. C. Y. Chan and G. M. Hieftje, “A LabVIEW program for
determining confidence intervals of Abel-inverted radial emission profiles,” Spectrochimica Acta Part B, vol. 60, no. 11, pp.
1486–1501, 2005.
F. J. Jiménez and J. De Frutos, “Virtual instrument for
measurement, processing data, and visualization of vibration
patterns of piezoelectric devices,” Computer Standards and
Interfaces, vol. 27, no. 6, pp. 653–663, 2005.
D. Salehi and M. Brandt, “Melt pool temperature control using
LabVIEW in Nd:YAG laser blown powder cladding process,”
International Journal of Advanced Manufacturing Technology,
vol. 29, no. 3-4, pp. 273–278, 2006.
G. Cautero, G. Paolucci, B. Brena et al., “A LabVIEW-based
control system for a surface science experimental station,”
Measurement Science and Technology, vol. 5, no. 8, pp. 1002–
1011, 1994.
J. H. Moore, “Artificial intelligence programming with
LabVIEW: Genetic algorithms for instrumentation control
and optimization,” Computer Methods and Programs in
Biomedicine, vol. 47, no. 1, pp. 73–79, 1995.
K. Yeung and J. Huang, “Development of a remote-access laboratory: A dc motor control experiment,” Computers in Industry, vol. 52, no. 3, pp. 305–311, 2003.
R. G. Castrejón and M. Duelk, “Using LabVIEW for advanced
nonlinear optoelectronic device simulations in high-speed
optical communications,” Computer Physics Communications,
vol. 174, no. 6, pp. 431–440, 2006.
R. Y. Wang, J. A. Jarratt, P. J. Keay, J. J. Hawkes, and W.
T. Coakley, “Development of an automated on-line analysis
system using flow injection, ultrasound filtration and CCD
detection,” Talanta, vol. 52, no. 1, pp. 129–139, 2000.
K. Brudzewski and J. Ulaczyk, “An effective method for
analysis of dynamic electronic nose responses,” Sensors and
Actuators B, vol. 140, no. 1, pp. 43–50, 2009.
G. Faraco and L. Gabriele, “Using LabVIEW for applying
mathematical models in representing phenomena,” Computers
and Education, vol. 49, no. 3, pp. 856–872, 2007.
“LabVIEW User Manual,” 2009, National Instruments Corporation.
C. Wagner, S. Armenta, and B. Lendl, “Developing automated analytical methods for scientific environments using
LabVIEW,” Talanta, vol. 80, no. 3, pp. 1081–1087, 2010.
W. B. Wang, J. Y. Li, and Q. J. Wu, “The design of a chemical virtual instrument based on LabVIEW for determining
temperatures and pressures,” Journal of Automated Methods
and Management in Chemistry, vol. 2007, Article ID 68143, 7
pages, 2007.
D. Nacapricha, N. Amornthammarong, K. Sereenonchai, P.
Anujarawat, and P. Wilairat, “Low cost telemetry with PC
sound card for chemical analysis applications,” Talanta, vol.
71, no. 2, pp. 605–609, 2007.
7
[21] J. Ballesteros, J. I. F. Palop, M. A. Hernádez, R. Morales Crespo,
and S. Borrego del Pino, “LabView virtual instrument for
automatic plasma diagnostic,” Review of Scientific Instruments,
vol. 75, no. 1, pp. 90–93, 2004.
[22] F. Klocke, O. Dambon, U. Schneider, R. Zunke, and D.
Waechter, “Computer-based monitoring of the polishing
processes using LabView,” Journal of Materials Processing
Technology, vol. 209, no. 20, pp. 6039–6047, 2009.
[23] J. A. Warren, J. M. Hayes, and G. J. Small, “Symmetry
reduction-vibronically induced mode mixing in the S1 state
of β-methylnaphthalene,” The Journal of Chemical Physics, vol.
80, no. 5, pp. 1786–1790, 1983.
[24] N. A. Borisevich, G. G. D’yachenko, V. A. Petukhov, and
M. A. Semenov, “Fine-structure spectroscopy of 2-methylnaphthalene cooled in a supersonic jet,” Optics and Spectroscopy,
vol. 101, no. 5, pp. 683–690, 2006.
[25] L. Wang, Q. Wu, and L. Zu, “Laser-induced fluorescence of
1-Methylnaphthalene in a supersonic jet expansion,” Spectroscopy Spectral Analysis, vol. 31, no. 11, 4 pages, 2011.
International Journal of
Medicinal Chemistry
Hindawi Publishing Corporation
http://www.hindawi.com
Volume 2014
Photoenergy
International Journal of
Organic Chemistry
International
Hindawi Publishing Corporation
http://www.hindawi.com
Volume 2014
Hindawi Publishing Corporation
http://www.hindawi.com
Volume 2014
International Journal of
Analytical Chemistry
Hindawi Publishing Corporation
http://www.hindawi.com
Volume 2014
Advances in
Physical Chemistry
Hindawi Publishing Corporation
http://www.hindawi.com
Volume 2014
International Journal of
Carbohydrate
Chemistry
Hindawi Publishing Corporation
http://www.hindawi.com
Journal of
Quantum Chemistry
Hindawi Publishing Corporation
http://www.hindawi.com
Volume 2014
Volume 2014
Submit your manuscripts at
http://www.hindawi.com
Journal of
The Scientific
World Journal
Hindawi Publishing Corporation
http://www.hindawi.com
Journal of
International Journal of
Inorganic Chemistry
Volume 2014
Journal of
Theoretical Chemistry
Hindawi Publishing Corporation
http://www.hindawi.com
Hindawi Publishing Corporation
http://www.hindawi.com
Volume 2014
Spectroscopy
Hindawi Publishing Corporation
http://www.hindawi.com
Analytical Methods
in Chemistry
Volume 2014
Hindawi Publishing Corporation
http://www.hindawi.com
Volume 2014
Chromatography
Research International
Hindawi Publishing Corporation
http://www.hindawi.com
Volume 2014
International Journal of
Electrochemistry
Hindawi Publishing Corporation
http://www.hindawi.com
Volume 2014
Journal of
Hindawi Publishing Corporation
http://www.hindawi.com
Volume 2014
Journal of
Catalysts
Hindawi Publishing Corporation
http://www.hindawi.com
Journal of
Applied Chemistry
Hindawi Publishing Corporation
http://www.hindawi.com
Bioinorganic Chemistry
and Applications
Hindawi Publishing Corporation
http://www.hindawi.com
Volume 2014
International Journal of
Chemistry
Volume 2014
Volume 2014
Spectroscopy
Volume 2014
Hindawi Publishing Corporation
http://www.hindawi.com
Volume 2014