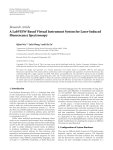
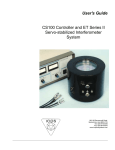
1
Tilden & Denton
Advanced software concepts
>
value (STOP @ ), the two are compared to
to see if the
incremented value at LOCATION is larger then the STOP
value, if it is the program ends, if not, it repeats the
process starting at BEGIN--HERE.
It should be noted that whilst many variables have been
pushed on the stack, only the data will remain, since each
time a value is used it is ’popped’ (removed) from the stack.
If a different spectra region is to be scanned i.e. from 3000
to 6500 with 10 increments the variables need only be
changed thus
3000 START!
6500 STOP
10 INCREMENT
and type SCAN, system will now scan from 3000 to 6500
taking data every 10 steps.
While the code might look a little strange at first, it
quickly becomes very easy to work with. The SCAN program
of Figure 6 could be combined with other modules as shown
in Figure 5 to perform some more complex experimental
function. Each module of the program can be easily tried out
to ensure that it is operational before proceeding with the
next.
Presently, CONVERS is being used in the authors’
laboratories for a variety of spectrochemical investigations,
including laser excited optoacoustic spectroscopy (Figure 7)
and inductively coupled plasma optical emission spectroscopy (Figure 8). Rather complex interactive control and
data acquisition programs have been easily implemented.
Memory requirements and operating speed have been found
to be far superior to conventional approaches. Additionally,
new system users have encountered a difficulty in utilising
previously developed custom software for a particular
experiment even when documentation was vague.
Discussion
The authors hope that this short introduction to only a
few of the concepts employed in CONVERS will generate
interest in its capabilities. A much more complete discussion
is available in the form of a user’s manual [3] available from
the authors.
ACKNOWLEDGEMENTS
The development of the CONVERS system was partially supported
by the Office of Naval Research and a Alfred P. Cloan Foundation
Research Fellowship to M. Bonnet Denton.
REFERENCES
C. Moore, Astronomical Astrophysics Supplemental, 15,(1974)
497.
[2] M.B. Denton, J.D. Mack, M.W. Routh and D.B. SwartzClmerican
[3]
Laboratory,8,69 (1976).
CONVERS An Interpretive Compiler, developed by Scott B.
Tilden and M. Bonner Denton, Department of Chemistry,
University of Arizona, Tucson, Arizona 85721, USA.
The use of a microcomputer for
flexible automation of a liquid
chromatograph
A.D. Mills, i. Mackenzie and R.J. Dolphin*
Philips Research Laboratories, Redhill, Surrey, RH1 5HA, U.K.
Introduction
Microprocessors are being used to add inexpensive automatic
control and data handling facilities to a variety of chemical
instruments. With a microcomputer it is now possible to
realise the flexibility formerly available only with a relatively
large and expensive minicomputer in an instrument little
different in size and cost from one controlled by inflexible
hardware. In many ways chromatography is an ideal process
for such automation. Most instruments are given a high
workload and, although many applications may be routine
and repetitive, the versatility of the technique requires an
instrument which can easily be used in a variety of modes.
In addition to improving the convenience to the user,
automation of a liquid chromatrograph should enhance the
performance of the instrument. Some aspects of high
performance liquid chromatography (HPLC) which can
benefit in this way are as follows:
(1) Accurate control of solvent flow rate will compensate
for changes in pressure drop and lead to more reliable
retention times.
(2) The composition of the mobile phase can be accurately
controlled in either isocratic or gradient elution chromatography using, for example, a proportioning valve on
the low pressure side of the pump.
(3) Automatic sampling can be operated in a variety of
modes to process a number of samples without supervision. It is also more precise than manual injection.
(4) A built-in data handling facility can present the analyst
*Present address: lye Unicam Ltd., York Street, Cambridge, CB1
2PX, U.K.
The computer is a general purpose instrument constructed
using a set of ready made circuit cards (Philips, Science and
134
with an easily read post-run report of the analytical
results with accurate peak area measurements even for
peaks which are poorly resolved.
Although liquid chromatographs incorporating microprocessors for control and data handling purposes are
commercially available, these instruments are, so far,
This paper describes, in detail, the
relatively inflexible.
automation of a liquid chromatograph using an inexpensive
general purpose microcomputer, which has previously been
applied in atomic absorption spectrophotometry [1] and for
column switching in HPLC 2 ].
Figure
illustrates the interconnection of the chromatograph and the microcomputer which controls the mobile
phase flow rate, operates an automatic sampler and analyses
data from the detector. The control and data handling
functions are integrated in a program which enables the
user to communicate with the instrument, in plain English,
via a visual display unit (VDU)or teletypewriter keyboard.
A variety of operational modes is offered, giving the analyst
an opportunity to establish the best conditions for a particular separation before leaving the instrument to perform its
given tasks without further interaction.
The microcomputer
Hardware
The Journal of Automatic Chemistry
Mills et al
Pump
Interface
CPU
t:.l
Interface
sampler
Realclock
time
Inter’rup.(
control
olumn
ADC
Detecto
Microcomputer
Figure 1. A schematic
their interfaces.
of the computer, the chromatograph, and
Industry Group, Eindhoven, The Netherlands). The central
processor is an Intel 8080A. The memory consists of 4K
bytes of programmable read-only memory (EPROM) for the
system monitor and a number of commonly used subroutines, 16. K bytes of EPROM for developed programs,
and 12K bytes of static random access memory (RAM) for
storing data or programs under development. Other cards
are included for interrupt control, for .communication with
peripherals, and for a real-time clock. Seven-segment displays
on the front panel show elapsed time and chromatographic
variables such as flow rate and pressure. Eight light-emitting
diodes are also incorporated in the front panel to display the
status of programmed variables such as the control byte for
the automatic sampler, which will be described later.
Software
Our laboratories have extensive support for the 8080,
including facilities for software development in either
assembly language or a high-level language (Coral 66). We can
use the multi-access laboratory computer (ICL 1904S)or an
Intel MDS microcomputer development system. For the
present work, most software development was carried out on
the main laboratory computer and output in machine code
on paper tape, which was then loaded into RAM using a
high-speed paper tape reader. Programs could then be run,
debugged, altered etc., using the system monitor resident
in EPROM. Some aspects of the control and data handling
programs will be described in later sections; in general the
control programs were written in assembly language, the
data handling program in Coral 66. A 24 bit software floating
point mathematics package was used for multiple precision
arithmetic. The complete program occupies approximately
8K bytes of memory.
Pump control
The pump used in this instrument (Pye-Unicam Ltd. model
LC3-XP) is a precision metering device with its own
sophisticated electronics for constant flow control. The flow
rate is normally selected using front panel switches but can
be set using a signal to a remote control socket at the rear of
the pump. It is this latter option which is used in this application. A purpose built interface converts a 14 bit control
word into the appropriate pulse width modulated signal to
Volume 1 No. 3 April 1979
Automation of a liquid chromatograph
control the 15urhp. In this way a potential precision of better
than 0.001 ml]min can be achieved. The required flow rate
can be typed in from the keyboard as a decimal number, or
the flow can be programmed to change during a run. A
maximum pressure for the system can be selected before a
run. In the event of this pressure being exceeded, perhaps
because of a blocked column, the pump will be switched off.
Automatic sampler
The automatic sampling system can handle up to twenty-four
samples, each in a glass vial sealed with a bonded silicone/
PTFE septum. The vials are contained in a circular rack
mounted on a turntable which can be rotated to any position
in either direction by a stepper motor (Philips, type 9904
112 04002) controlled by an integrated circuit (SAA 1027).
The sample is introduced at the head of the chromatographic column by a six-port loop valve (Rheodyne Co.,
model 70-10) rotated by a pneumatic actuator. The sample
is transferred from the vial to the loop valve through a
concentric needle assembly which is lowered by a syringe
actuator, piercing the septum seal, into the sample vial.
Compressed air or an inert gas is connected to the outer
tube thus pushing some of the sample through the inner
needle to the sample valve. Figure 2 is a schematic diagram
illustrating these pneumatic operations.Valves Vo, V1, V2,
V3 and V4 are all operated by 24 V d.c. solenoids and are
two-position valves which allow the use of a binary control
sequence. Vo controls actuator A, which operates the
sampling valve. V operates cylinder A2 which moves the
needle assembly. V3 allows air to pass into the sample
transfer system. V2 will switch this air supply either to the
inner needle to purge the sample line or to the outer tube to
take up the sample. The flow rate of gas through these paths
is controlled by a pressure regulator (Watts Ltd., type 362-1)
and a restrictor (400 mm x 0.25 mm i.d.). A volume of
100 ml is included between the pressure regulator and V 2 to
absorb any surge in pressure which may occur when V 2 is
switched. V4 is used only when multiple samples are to be
Table 1. Pneumatic control functions
Valve
Controlled function
NOt energised (0)
Energised (1)
V0
V1
Sampling valve
Fill
Inject
Needle assembly
Up
Down
V2
Direction of ak flow
Purge
Fill
V3
Air supply
Off
On
V4
Pressure equalisation
Shut
Open
Table 2. Control sequence for repetitive sampling
V4 V3 V2 V1 V0
2
3
4
5
0 0 0
0
0
0
0 0
0
1
0
0
0
0
6
7
8
9
10
0 0
0
0 1 0
0 0
0 0 0 1
0
0
0
0
0
Duration (S)
Comment
15
5
4
Needle enters vial
Air on, line purged
Loop filled
Air off, hold loop full
Injection with pressure
equalisation
End of injection
Outer tube vented
Loop emptied
Pressure equalised
Rest then return to
start
5
135
Automation of a liquid chromatograph
Mills et al
Vent
’-._
ifold
Manifold
Air in
Air in
V3> IV,
Pressure
,
ctller’
A2
Sampling
Sampling
valve\
Restr:tion Pump
Cumn
L---------4--47I
V
LPu
Pressure
controller
Column
Loop
100cm
Sample
Figure 2.
Figure 2a.
Vent
Vent
Manifold
Manifold
Air in
Air in
A2
Sampling
valve\
valve\
Restrictionl Pump
Pressure
controller
Column
Loop
100crn
Sampling
Restriction
Pump
Pressure
controller
Column
Loop
I00m
Jm
Figure 2b.
Figure 2. Pneumatic layout of autosampler. (a) needle enters vial
(b) the loop is filled and (c) transfer of sample to column.
Sampling valve actuator (Rheodyne Inc., type 70. 01)
A1
A2
Syringe actuator (H. Kuhnke Ltd., type 37291)
Spool valve (H. Kuhnke Ltd., type 87-030-01)
VO
V1, V2 Spool valves (H. Kuhnke Ltd., type 44-250-1)
V3, V4 Solenoid valves (H. Kuhnke Ltd., type 651 "11)
taken from a vial without the removal of the needle assembly
between samples. When open, it rapidly equalises the
pressure in the two lines.
The functions controlled by these valves and their corresponding bit states when not energised (-- 0) and when
energised (= 1) are summarised in Table 1.
The autosampler and turntable are operated by an eightbit control word transmitted from the microcomputer via
an interface circuit. Bits 0 to 4 inclusive switch the solenoid
valves in the pneumatic control system. Each bit is used to
switch a relay (131A-4) which, in turn, switches the corresponding solenoid valve (Bit 0 controls valve Vo etc.). The
136
Figure 2c.
remaining bits of the control word (5 7) are connected to
the three inputs of the SAA 1027 integrated circuit used to
control the stepper motor. Bit 5, which is connected to the
trigger input is pulsed to step the motor. Bit 6 is connected
to the set input, an option which is not used in this
application. Bit 7 is connected to the input which determines
the direction of rotation (1 anticlockwise, 0 clockwise).
By transmitting an appropriate timed sequence of control
words, any one of a variety of operational modes can be
effected; for example, multiple samples can be taken from a
single vial or a number of different consecutive samples can
be analysed. Optional purge and rinse routines can be called
to overcome inter-sample contamination. Table 2 shows a
typical control sequence to sample repetitively from a single
vial.
-=
Data handling
Analogue to digital converter
The signal from the detector (Pye Unicam Ltd. model
The Journal of Automatic Chemistry
Automation of a liquid chromatograph
Mills et al
Interrupt
every lOOms
igr’al from [JADC’I >
chromatographl q
.>
Signal
processing
Set flow
and display
Peak
detection
torage of
Real time
operations--
peak
ar’ameter
Select
samp, ler
mode
Analyse
Calculation
of peak
areas
required
number of
samples
-->-
Stop
)
Output
data
Nose
measured
Figure 3. Block diagram of chromatographic data handling.
LC3-UV) is digitised using a voltage to frequency converter
and 16 bit counter before being processed in the microcomputer. The signal input is buffered using a low noise,
10w drift amplier which can also provide switchable gains
of 1, 10 and 100. The voltage to frequency converter
operates at a full scale frequency of MHz for +10 V input
and has a usable dynamic range of over l0 The analogue
input circuitry is completely isolated from the interface to
the microcomputer by a high speed optocoupler driven
directly from the converter.
The real time clock signal from the microcomputer latches
the 16 bit count into a register, resets the counter and gates
the data from the register onto the data highway, as two 8
bit bytes, on receipt of the device select signals. The counter
continues incrementing until receipt of the next real time
clock pulse, when it is again reset.
A row of light emitting diodes on the front panel allows
the 16 bits of data to be shown as true binary information or
as a baragraph display. The coding is performed by two read
only memories and the display is updated at the real time
clock frequency.
s.
Enter
sampler
N
selected
Manual
injection
Auto
injection
Print
results
Print
results
Analyse
Data processing algorithm
For quantitative chromatography, it is necessary to measure
the area of each peak. The algorithms that may be used to
calculate the areas of discrete or overlapping peaks generally
belong to two classes:
(1) relatively simple empirical methods
(2) more complex methods such as curve fittings [3], [4]
that assume the recorded shape or some mathematical
model of a peak e.g. Gaussian or Lorentzian.
The choice of algorithm is determined by the response time
of the system, the accuracy required, the total available
memory size, and the computing power available. In chromatography where the minimum peak width at half height will
be
second, we are normally confined to the first group of
algorithms because of the limited amount of real time
processing that can be carried out in the 100 msec intervals
between acquisition of data points. Curve fitting techniques
0nly become practical with the aid of hardware arithmetic
devices. One of our microcomputers has been subsequently
fitted with an arithmetic unit (Advanced Micro Devices,
AM 9511) and the hardware can now perform floating point
calculations approximately two orders of magnitude faster
Volume
No. 3 April 1979
samples
and print
results
Figure 4. System operation showing user interaction
than is possible by software alone.
Arithmetic definition of the parameters involved requires
a combination of 8 bit, 16 bit and 24 bit integer or floating
point (fp) arithmetic. The first two options provide adequate
accuracy to define retention times, peak boundaries etc., but
are not sufficient for integrated areas where large numbers
must be handled. In this instance floating point routines can
be incorporated, bearing in mind that a single fp multiplication on the 8080A requires about 5 msec out of the total
100 msec available for real time processing.
The data handling procedure used in this project is shown
in Figure 3. Data points are intially summed in order to
restrict the number of points across a peak and so optimise
137
Mills et al
Automation of a liquid chromatograph
REMOTE CONTROL. OF PUMP? Y
FLOW RATE= 2.25
STABILISATION TIME(MINS)= 5
AUTOSAMI::’L. ER? Y
TYPE
TYF’E
S(SAMF’LER),F’<PURGE)
S(SAMF’I_ER),P(F’URGE)
OR I"I(’IOVE) F’
OR M(MOVE) M
HOW MANY STEPS? +4
TYPE S(SAMPLER),F’(PURGE) OR
l’4(l’qOVF.)
S
THE FOLLOWING ROL.II’INES ARE AVAILAE’.L.E:
1.SINGLE VIAL,PROBE NOT WITHDRAWN
2.CONSECUI’IVE VIAL SAMPLING
3.CONSECUTIVE VIAl.. WITH RINSE
4.CONSECLITIVE VIAl’. WITH F’URGE
ROUTINE NUMBEII’? 1
DATA HANOI..ING? Y
INTERNAL ADC? "f
SUGGESTED SLOPE SENSI"I’IVII’Y IS:
3
DO YOU WISH TO SET ANY PARAMETERS".’ Y
SLOPE SENS= 3
PEAl’(
WIDTH= 8
DOUBL. ING TIME(SECS)= 200
TOTAL TIME(SECS) 350
DELAY TIME (SECS)=’IO0
MINIMUM AREA:= 100
FLOW RATE= 2.25
PRELIMINARY RUN
PEAl’(
AREA
1
29022
.o
3
.’.,90
4
RET T IME
.
1 "23.4
1 4 .o
179.3
:283. I
37659
".:.!7310
I..i3
l.J P..
118
1S6
:L71
274
1 "2.8
148
187
292
%AREA
30
":’
68
38.99
28.27
DO YOU WISH TO CHANGE F’ARAME’TERS? N
HOW I"IANY SAI"IF’I_ES’?.. i
SAMPLE NO
F’ E A I.(
-1
3
4
AREA
1
R E r. T I M IZ
29031
.L 23 3
.:’.,.,30
3737(]
14 4
.79.5
283.7
:27822
I... B
U 1.3
%A REA
118
137
171
274
I "28
30 00
"::’.61
38.62
28.75
149
187
293
END OF RUN,
Figure 5. A listing of the dialogue between computer and user.
138
The Journal of Automatic Chemistry
Mills et al
Automation of a liquid chromatograph
II
1
5
0.02 au
10
3
Rinse,
8
Figure 6. Consecutive analyses showing the
auto-sampler cleansing routine.
Identification: 1 Mesitylene
2 Pentamethylbenzene
3 Fluoranthene
effectiveness of the
4 Benzene
5 Naphthalene
6 Anthracene
the peak width with respect to the subsequent digital differentiation. The signal is then smoothed by a digital filter of
the form described by Savitzky and Golay [5], [6]. Peaks
are detected by comparison of the first differential of a signal
with a preset threshold value. Retention times, boundaries
and integrated signals are stored for each peak and output at
the end of an experiment after correction for baseline drift
and overlap between peaks.
Correct coding of the algorithm was confirmed by loading
a series of digital Gaussian curves into the microcomputer to
simulate single and grossly overlapping peaks.
The smoothed version of the signal is available at a socket
on the microcomputer after conversion to analogue form by
the 12 bit DAC.
Performance
User interaction
One of our aims when writing the software to control this
instrument was to offer the analyst a high degree of interaction and a wide choice of operational modes. The
computer ’asks’ a series of questions, in plain English, on the
VDU to which the user can reply with the appropriate
response at the keyboard. This is illustrated by Figure 4 and
Figure 5. From the keyboard, the analyst can set the solvent
flow rate and can choose the desired sampling mode with or
without data handling or, if manual injections are preferred,
the data handling procedure can be invoked alone. Before
sampling takes place, the detector noise level is measured
automatically and the user can then type in various
parameters appropriate to the particular analysis in order to
obtain the optimum separation and data handling accuracy.
After a preliminary analysis, these parameters can be changed
if necessary until the optimum conditions have been
achieved. The system can then be instructed to proceed with
Volume
No. 3 April 1979
purge
10
6
Minutes
2
8
6
4
Minutes
2
0
its task without further attention until the required number
of samples has been analysed.
Performance of the auto-sampler
The two most important performance characteristics of the
auto-sampler are its precision and the extent to which one
sample is affected by residual contamination from the
previous sample (’carry-over’). In order to test these characteristics, mixtures of benzene, naphthalene and anthracene
in n-hexane were analysed. The separation column (250 mm
x 4.8 mm i.d.) was packed with Lichrosorb SI 60 (B.D.H.
Ltd.); n-hexane was used as the mobile phase and the wavelength of the UV detector was set to 254 nm. Two modes
of automatic sampling were investigated:
(a) repetitive sampling from one vial,
(b) sampling the same mixture contained in consecutive
vials.
The initial results in both modes were unsatisfactory;
the relative standard deviations of the peak areas obtained
were high, especially when sampling from consecutive vials.
The answer to these problems was found in simple modifications to the software. An overall improvement was made by
the addition of a procedure to pre-wet the transfer tubes
with sample before the final sampling operation. The use of
a purge before the consecutive vial sampling routine to drive
out the residue from the previous sample improved the
results for this mode of operation.
After these changes were made, the analysis of ten samples
in each mode gave, in both cases, a relative standard
deviation of the measured peak areas for all components of
the mixture of less than 1.1%. These results represent the
precision of the complete chromatograph; it is worth noting
that the manufacturers of the sampling valve only claim
’less than 1%’ for the valve alone.
As a test of inter-sample contamination, an injection of
the hydrocarbon mixture was immediately followed by an
injection of n-hexane. The system was not rinsed or purged
between these samples. It was found that about 8-10% of the
original sample (1420 ppm benzene, 82.0 ppm naphthalene,
3.38 ppm anthracene) was carded over into the second
’blank’ injection. This experiment was repeated with the
addition of a one-minute purge of each sample line before
139
Mills et al
Automation of a liquid chromatograph
the n-hexane was sampled. This reduced the carry over
almost completely for the more volatile benzene constituent
(to 0.2% of the original concentration). There was not
sufficient removal of the naphthalene and anthracene
however, (to 1.6% and 4.7% respectively).
The addition of a rinse vial containing pure mobile phase
was then tried. The complete cycle was, therefore: sample;
purge; rinse; purge; blank. With only one rinse between
samples, all measurable traces of both benzene and naphthalene were removed but a small amount (< 0.1%)of
anthracene was still detected. The analyses of the blank
samples were made at maximum sensitivity, eight times more
sensitive than for the sample. By a small change in the
program, the number of rinses from the same vial was
increased to three. This successfully removed all traces of
carry-over into the blank sample.
Figure 6 illustrates the results obtained using this combination of purging and multiple rinsing. A blank injection, to
demonstrate the cleanliness of the system, was followed by
an injection of a mixture of mesitylene, pentamethyl,
benzene and fluoranthene. After purging, rinsing and purging
again, a second sample, this time the benzene, naphthalene,
anthracene mixture, was injected. No trace of contamination
by the constituents of the first mixture (which have different
elution times to the constituents of the second mixture) can
be seen in the second chromatogram.
Conclusions
The automatic liquid chromatograph described in this paper
is a reliable and flexible instrument for both routine and
research applications. Its simple, straightforward design and
construction, incorporating a high proportion of readily
available components, has resulted in low hardware costs,
while the flexibility of software control allows a good
performance to be achieved.
We have shown that it is capable of repetitive sampling
with a precision of 1% relative standard deviation, and
effective rinse and purge routines can be readily constructed
to ensure that all traces of prior contaminants are removed
from the system. The accuracy of the data handling algorithm ensures the integrity of the quantitative results even for
those samples which are poorly resolved.
We have demonstrated its use with procedures which
would probably satisfy most users; one of the outstanding
advantages of software control is, of course, the ease with
which procedures can be adapted or supplemented in order
to cope with new tasks. This is exemplified by the column
switching application [2] which uses a peak detection
algorithm developed from the data handling program used in
this general purpose liquid chromatograph.
REFERENCES
[11 Willmott, F.W. and Mackenzie, I. Analytica Chimica Acta,
(1978) 103, 401.
[21 Willmott, F.W., Mackenzie, I. and Dolphin, R.J. in Schomburg,
G. and Rohrschneider, L. (Editors), "Chromatogi-aphy 1978",
Elsevier, p 151.
[31 Brouwer, G. and Jansen, J.A.J. Analytical Chemistry,(1973),
45, 2239.
[4] Anderson, A.H., Gibb, T.C. and Littlewood, A.B., Analytical
Chemistry, (1970), 42, 434.
[5] Savitzky, A. and Golay, M.J.E., Analytical Chemistry, (1964),
36, 1627.
[6] Steiner, J., Termonia, Y. and Deltour, J. Analytical Chemistry,
(197 2) 44,1906.
An evaluation of the Kem-O-Mat
programmable discrete analyser
Geoffrey C. Seymour
Division
of Clinical Chemistry, Northwick Park Hospital, and Clinical Research Centre, Harrow, Middlesex, HA1 3UJ, UK.
This evaluation extended over a period of three months and
follows the recommendations of Broughton let al. 1.2].
The instrument
The Kem-O-Mat (Coulter Electronics Limited*) is a
calculator-controlled single channel discrete analyser which
may be used for either kinetic or endpoint measurement
analyses. The throughput of the instrument varies with the
methodology, but can be a maximum of 110 samples/hour,
at 37C, in the kinetic mode and 180 samples/ hour in the
endpoint mode.
Results are calculated automatically and are printed in the
units of choice. The data are checked before calculation to
ensure that linearity limits have not been exceeded and that
the initial reagent absorbance was within predetermined
limits. The data for non-linear analyses, in the kinetic mode,
are printed in absorbance units. The operator has the option
to print any or all absorbances since all data are stored in
the calculator’s memory and can be recalled at the end of
the analysis run.
All the key instrument functions are continuously
*Coulter Electronics Ltd., Coldharbour Lane, Harpenden, Herts, UK.
140
monitored by the calculator and fault warnings are given by
an audible alarm and printed message.
There is a comprehensive range of methodologies available
for the instrument for which the manufacturer will supply
the preprogrammed cassettes and the reagent packs, or
suggest a supplier for the latter. The user has the facility to
develop his own .analytical systems on the instrument and
prepare his own programmed cassettes.
Description
The Kem-O-Mat consists of three modules in the air bath
version (Figure 1) and four modules in the water bath
version. The air bath version was evaluated in this study. Its
three modules are a control module to which is fitted the
analyser module while the calculator is connected to the
control module by electric cable. The control and analyser
modules together occupy 590 x 600 mm of bench space
The calculator requires 550 x 365 mm of space. A single
99-132V or 198-264V 50 Hz mains socket supplying 550 VA
is the only service required.
The control module contains most of the operational
logic, the pump mechanisms and a LED display of the
The Journal of Automatic Chemistry
International Journal of
Medicinal Chemistry
Hindawi Publishing Corporation
http://www.hindawi.com
Volume 2014
Photoenergy
International Journal of
Organic Chemistry
International
Hindawi Publishing Corporation
http://www.hindawi.com
Volume 2014
Hindawi Publishing Corporation
http://www.hindawi.com
Volume 2014
International Journal of
Analytical Chemistry
Hindawi Publishing Corporation
http://www.hindawi.com
Volume 2014
Advances in
Physical Chemistry
Hindawi Publishing Corporation
http://www.hindawi.com
Volume 2014
International Journal of
Carbohydrate
Chemistry
Hindawi Publishing Corporation
http://www.hindawi.com
Journal of
Quantum Chemistry
Hindawi Publishing Corporation
http://www.hindawi.com
Volume 2014
Volume 2014
Submit your manuscripts at
http://www.hindawi.com
Journal of
The Scientific
World Journal
Hindawi Publishing Corporation
http://www.hindawi.com
Journal of
International Journal of
Inorganic Chemistry
Volume 2014
Journal of
Theoretical Chemistry
Hindawi Publishing Corporation
http://www.hindawi.com
Hindawi Publishing Corporation
http://www.hindawi.com
Volume 2014
Spectroscopy
Hindawi Publishing Corporation
http://www.hindawi.com
Analytical Methods
in Chemistry
Volume 2014
Hindawi Publishing Corporation
http://www.hindawi.com
Volume 2014
Chromatography Research International
Hindawi Publishing Corporation
http://www.hindawi.com
Volume 2014
International Journal of
Electrochemistry
Hindawi Publishing Corporation
http://www.hindawi.com
Volume 2014
Journal of
Hindawi Publishing Corporation
http://www.hindawi.com
Volume 2014
Journal of
Catalysts
Hindawi Publishing Corporation
http://www.hindawi.com
Journal of
Applied Chemistry
Hindawi Publishing Corporation
http://www.hindawi.com
Bioinorganic Chemistry
and Applications
Hindawi Publishing Corporation
http://www.hindawi.com
Volume 2014
International Journal of
Chemistry
Volume 2014
Volume 2014
Spectroscopy
Volume 2014
Hindawi Publishing Corporation
http://www.hindawi.com
Volume 2014