1
18/35
DLHT
TecnoSoft s.r.l.
Viewing data as a table
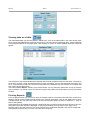
The downloaded data may also be viewed in tabular form; click on the Data button in the main window, after
which choose the Table button located at the top right. The Filter window will appear again, which is identical
to that explained above for the graph option. After clicking on confirm, a window entitled Acquisition Table will
appear.
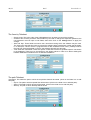
The main part of the window displays the acquired data for both temperature sensors that were connected to
the DLHT in question, along with the time stamp for each acquisition, the user who launched the mission and
so on. Further down we find User Information, that relate to the hardware key connected to the computer that
was used to launch the mission.
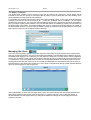
The button labelled Export, will bring up a window where you may select the path where a copy of the data
may be saved in .slk format, which may then be imported using Microsoft Excel where you may personalize
the data.
Printing Reports
From the graph window you may print a report of the data acquired. The printout will reflect the current zoom
settings, and the report will also include certain DLHT mission parameters. Click on the Print button to open
a window where you may select the printer to be used and the print options (number of copies etc...). Click on
Start to start printing.
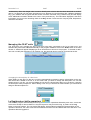
If the Supervisor has enabled print preview, a window will open up before printing where a sample of how the
final printed document will look is displayed. In this preview window you may zoom into the page, move
between pages, save the preview in one of two formats (ll for List&Labels and EMF, that may be viewed with
most graphic programs) and, of course, send the file to the printer.