1
TESTING THERMAL IMAGERS
Practical guidebook
Krzysztof CHRZANOWSKI
Warsaw 2010
Copyright ® 2010 Krzysztof Chrzanowski
All rights reserved. No part of this book may be reproduced in any form by any
means without permission in writing from the copyright owner.
Publisher: Military University of Technology, 00-908 Warsaw, Poland
INSB 978-83-61486-81-7
Printed by: P.P.H Remigraf, 11 Ratuszowa Str., 03-430 Warsaw, Poland
Acknowledgement
Research needed to obtain results presented in book was partially financed by
the grant from the Polish Ministry of Science and Higher Education no 6 ZR8
2008C/07035.
Notice:
The Publisher and Author have taken great care in preparing the information and
guidelines presented in this book. However, the guidelines and other material within
are of a general nature only. The Publisher and Author take no responsibility with
respect to the use of the information, guidelines and material furnished and assume
no responsibility for any damages or costs sustained while using the guidelines.
The Publisher and Author further disclaim any and all liability for any errors,
omissions or inaccuracies in the information, guidelines and material given in this
book whether attributable to inadvertence or otherwise, and for any consequence
arising there from.
Warsaw 2010
Author’s Preface
Thermal imagers are electro-optical imaging systems sensitive to mid-wave
and long-wave infrared radiation that generate images of the observed scenery using thermal radiation emitted by the scenery. They have found numerous applications in both defence&security sector (military, border guards, police, etc.) and civilian sector (industrial non-contact temperature measurement, non-destructive
thermal testing, tests of electrical power lines, building industry, medical applications, fire rescue etc.)
A lot of myths about thermal imagers are known. There is a rich literature on
subject of thermal imaging but there are also papers presenting conflicting conclusion about performance of these modern, fascinating imaging systems. Different
rules how to choose an optimal thermal imager can be found in available literature,
too. It is also known that quality of thermal imagers offered on the market vary significantly. The only way to be sure about quality of imagers of interest is to test
them and to evaluate test results.
Testing thermal imagers is a very difficult task. Extended knowledge from different areas like physics, optics, electronics, thermal sciences, precision mechanics,
metrology and practical experience with thermal imagers is needed to carry out effectively testing modern thermal imagers.
There is rich literature on the subject of testing and evaluation of thermal
imagers and there are also several standards that regulate tests of these imaging systems. However in spite of available standards, valuable books and numerous literature less experienced test teams have a lot of problems to carry out their tasks due
to lack of a practical guidebook in field testing thermal imagers.
This book presents knowledge of the author on testing thermal imagers that was
accumulated during over two decades of scientific work in the field of electro-optical technology interconnected with a series of practical projects, and direct involvement in activities of one of manufacturers of equipment for testing thermal
imagers (Inframet - www.inframet.com).
The author hopes that this book can become a practical guide for testing thermal
imagers for wide community of people interested in this fascinating technology
of thermal imaging.
PS. The Author hopes that reading this book will be much easier task than pronouncing his family name ☺. The Author also apologizes for imperfect language
of this book because English is not his native language.
October 2010
Krzysztof Chrzanowski
iii
Table of Contents
1 Introduction ..............................................................................1
1.1 Concept of electro-optical imaging system............................................................1
1.2 Human sight.............................................................................................................1
1.3 Division of electro-optical imaging systems...........................................................6
1.4 Concept of testing....................................................................................................8
1.5 Terminology..............................................................................................................9
1.6 Basic metrological terms.......................................................................................11
1.7 Structure of the book.............................................................................................13
1.8 References...............................................................................................................15
2 Review of thermal imagers.....................................................18
2.1 Thermal cameras versus thermal scanners.........................................................18
2.2 Applications of thermal cameras .........................................................................19
2.3 Spectral band.........................................................................................................20
2.4 Generations of thermal imagers...........................................................................20
2.5 Technology trends..................................................................................................27
2.6 References...............................................................................................................28
3 Parameters of thermal imagers .........................................29
3.1 Subjective image quality parameters .................................................................31
3.1.1 MRTD...............................................................................................................31
3.1.2 MDTD..............................................................................................................35
3.1.3 Evaluation of ranges of effective surveillance ................................................36
3.2 Response parameters ............................................................................................40
3.2.1 Responsivity function .......................................................................................40
3.2.2 Aperiodic Transfer Function.............................................................................42
3.2.3 Slit Response Function....................................................................................44
3.3 Noise parameters ..................................................................................................44
3.3.1 3D noise model.................................................................................................45
3.3.2 Single parameter approach................................................................................47
3.3.3 Four parameters approach................................................................................48
3.4 Image resolution parameters ...............................................................................54
3.4.1 Parameters based on specifications of the IR FPA ..........................................54
3.4.2 MTF and derivative parameters........................................................................56
iv
3.4.3 Parameters based on imager response to point/slit sources ...........................61
3.4.4 Subjective parameters based on resolution targets ..........................................62
3.5 Accuracy parameters ............................................................................................63
3.6 Summary................................................................................................................68
3.7 References...............................................................................................................70
4 Test equipment ......................................................................73
4.1 Types of test systems...............................................................................................73
4.2 Blocks of test system..............................................................................................80
4.2.1 Collimator.........................................................................................................81
4.2.2 Blackbody..........................................................................................................92
4.2.3 Rotary wheel....................................................................................................99
4.2.4 Targets.............................................................................................................101
4.2.5 Image acquisition/analysis module................................................................106
4.2.6 Optional blocks...............................................................................................109
4.3 Manufacturing/R&D support equipment..........................................................110
4.3.1 Correction of spatial noise...............................................................................110
4.3.2 Calibration of measurement thermal imagers.................................................112
4.3.3 Boresighting to a reference optical/mechanical axis.......................................113
4.4 References.............................................................................................................114
5 Test procedures....................................................................116
5.1 MRTD....................................................................................................................116
5.1.1 Test team..........................................................................................................117
5.1.2 Detection criterion...........................................................................................117
5.1.3 Test environment.............................................................................................118
5.1.4 Targets.............................................................................................................120
5.1.5 Offset...............................................................................................................124
5.1.6 Imager settings................................................................................................125
5.1.7 Static/dynamic images.....................................................................................126
5.1.8 Differential temperature steps.........................................................................126
5.1.9 Measurement methods.....................................................................................127
5.1.10 Software support...........................................................................................140
5.1.11 Interpretation of MRTD measurement results...............................................141
5.2 MTF......................................................................................................................143
5.2.1 Measurement concept.....................................................................................143
5.2.2 Measurement procedure.................................................................................145
5.2.3 Interpretation of measurement results...........................................................146
v
5.3 Responsivity function (SiTF)..............................................................................147
5.4 Noise parameters ................................................................................................150
5.4.1 Measurement concept ...................................................................................150
5.4.2 Measurement procedure................................................................................152
5.4.3 Interpretation of measurement results............................................................155
5.5 References.............................................................................................................156
6 STANAG 4349 requirements ...............................................157
7 Guidelines for buyers of test equipment...........................162
vi
1 Introduction
1.1 Concept of electro-optical imaging system
According to the International Lighting Vocabulary published by the International Lighting Commission CIE and the International Electrotechnical Commission
CIE [15] considered nowadays as an international primary authority on terminology
in radiometry, electromagnetic radiation between radio radiation and X radiation is
termed the optical radiation. Thus, the optical radiation can be defined as radiation
of wavelengths longer than about 1 nm and shorter than about 1 mm. The range
of optical radiation is divided into three sub-ranges: infrared radiation, visible radiation, and ultraviolet radiation.
Radio
Microwave
Infrared
Visible
Ultraviolet
X-Ray
Long wavelength
Short wavelength
Low frequency
High frequency
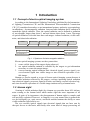
Fig. 1.1. Spectrum of electro-magnetic radiation.
Electro-optical imaging systems are the systems that:
1. create visible image of the targets being observed,
2. use optical radiation emitted or reflected by the targets to get information
necessary to create the output image,
3. convert coming optical radiation into electrical signal, process signal, convert electrical signal into visible image or into electrical equivalent of visible image.
Human eye can be treated as a type of electro-optical imaging system because it
uses visible radiation reflected by the targets, converts incoming optical radiation
into electrical signals, processes signal in a brain, and finally converts electrical signals into electrical equivalent of a visible image understood by a human brain.
1.2 Human sight
Sensing of visible radiation (light) by a human eye provides about 90% information coming to the human brain which makes sight the most important of all
senses. In spite of its importance, the phenomenon of human sight is complex and
still not fully explained. However, to simplify it we can assume that in general the
set: the biological eye, optic nerves, and brain enables humans the ability to sense
visible radiation (light) and to see.
The eye converts optical signals into electrical signals that are later sent by
the optic nerves to the brain, and finally after some kind of image processing we
1
“see” the targets that are in our field of view. The biological eye consists of two systems: an optical system and a detection system. The optical system (cornea, crystalline lens, vitreous) refracts and focuses the incoming light into the detection system
(retina). The latter system contains millions of rods and cones which convert light
energy into electrical signals sent to the brain via the optic nerve. The retina contains about 100 millions of rods and about 6 millions of cones. The rods of relatively low sensitivity are to work in daytime conditions (the photopic vision) and can
deliver high resolution color vision. The cones are high sensitivity detectors that
work in night-time conditions (scotopic vision) but they can deliver only lower resolution monochromatic vision.
Fig. 1.2. Simplified optical diagram of human eye.
Human eye generates sharp image within rather narrow field of view (about 10°)
because in the middle of the retina there is the highest concentration of rods and
cones. The rest of the field of view is rather blurry. The experience of wide sharp
human vision is achieved by turning the eyes towards the current point of interest in
the field of view.
Each cone cell is built using three-color sensitive pigments: red-sensitive pigment, green-sensitive pigment, and blue-sensitive pigment. In the diagram above,
the wavelengths of three types of cones (red, green, and blue) are shown. The peak
absorption of blue-sensitive pigment is about 445 nm, for green-sensitive pigment about 535 nm, and for red-sensitive pigment - about 570 nm. The pigments generate
three electrical signals: α, β, and γ. A brain analyzes the signals and determines
the color of the incoming light on the basis of the ratio between α, β, and γ signals.
Next, the perceived brightness depends on the sum of the signals α, β, and γ. When
the signals α, β, and γ are almost the same then the target will be perceived as
white, gray or black (white - high sum of the signals; gray -medium sum of the signal; black – very low sum of the signals). The human eye can sense many gradation
of color when red, green and blue signal are mixed. It is usually considered that human can sense about 380 000 color gradations.
2
eye
α
β
γ
brain
Fig. 1.3. Principle of color vision.
Power of the light coming to the light detectors, distributed on the retina surface,
is automatically regulated by the iris. This component can change its diameter from
about 2 mm to about 10 mm and this phenomenon enables us to work at different illumination conditions.
The distribution of the cones and rods on the retina is not uniform. The highest
concentration of the cones is in the retina’s center, much less concentration on the
peripheral parts of the retina. In case of the rods we have an inverse situation.
Therefore in daylight condition, a human eye has the highest acuity in the center
of its field of view; in the night conditions – at periphery of the field of view.
The principle of seeing phenomenon is the following. The light emitted by
the Sun or other light sources illuminates the observed scenery and it is reflected.
The reflected light carries information about the targets that reflected the light.
Different targets of the scenery differ in their ability to reflect the incoming light.
The targets of high reflectance will be perceived as bright ones; the targets of low
reflectance will be perceived as dark ones. Because reflectance depends also on
a wavelength, then the reflected radiation carries also information about color
of the observed target. To simplify, the target of high reflectance in the spectral band
of 0.65-0.78 µm and low reflectance in the spectral band of 0.4-0.5 µm will be
perceived as a red one. In case of inverse situation, the target will be perceived as
a blue one.
The image generated by the eye lens must be created exactly on the retina.
The distance between a human eye – an observed target can vary significantly. In
order to compensate this distance variation, the focal length of the lens must vary.
This adaptation is achieved by the change of a shape of the lens ball. This ability
deteriorates together with aging process.
It is not possible to state what is exactly a spectral sensitivity range of a human
eye, because the spectral limits differ among the humans and the spectral sensitivity
band is also on the power of incoming light. However, the International Lighting
Commission CIE and the International Electrotechnical Commission CIE [15] determined a relative spectral sensitivity function of a human eye in the spectral range
from 0.38 µm to 0.78 µm and these values are often considered as limits of the visible range.
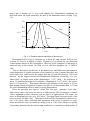
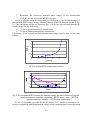
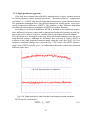
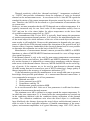
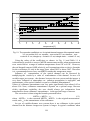
If we compare a spectral sensitivity curve of a human eye with a characteristic of
spectral emission of light emitted by the Sun or reflected by the Moon then we will
3
notice that a human eye is very well adapted for illumination conditions on
the Earth where the light emitted by the Sun is the dominant source of light (Fig.
1.4).
1.0
0.8
Sun
s (λ ) 0.6
0.4
cones
rods
0.2
0.0
0.4
0.6
0.8
1.0
λ [µ m]
Fig. 1.4. Relative spectral sensitivity of human eye.
Horizontal field of view of a human eye is about 40° and vertical field of view
is about 30°. Due to its ability to rotate, a human eye can effectively see (detection
of movement) almost in full hemisphere. However, good sharpness of an image is
achieved only in the central 10°-field of view; the best sharpness in 2° field of
view.
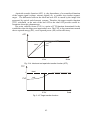
Due to aberrations of the lens of the human eye and diffraction phenomenon,
some limitations of spatial resolution of the human eye exist, it means that there are
some limits how small can be the targets that the eye can still perceive. This limit
depends on the target contrast and illumination conditions. Generally, it is considered that at bright moon night (illumination 3×10⁻² cd/m2 ) the resolution is
about 1.5 mrad but in bright day conditions (illumination 3×10³ cd/m2 ) the resolution is 0.35 mrad [21]. This means that when the distance to the targets is 25 cm,
then human cannot recognize as separate two slits of a width smaller than 0.37 mm
for weak illumination and 0.09 mm for strong illumination.
There are generally two types of vision. The first type, photopic vision (daylight vision) when the cones are active as light sensors. The second type, scotopic
vision (nightlight vision) when the rods are active as light sensors. The cones are
active at illumination levels over 0.03 cd/m2. The upper limit for proper work of the
cones is about 300 000 cd/m2. The rods are activated by illumination conditions below ~0.03 cd/m2. After sufficient dark adaptation time (even 30 minutes is sometimes needed) the rods can enable us seeing even at 0.03 cd/m 2. However, quality
of an image generated by the rods in night conditions is much lower than quality of
4
an image generated by the cones in daylight conditions. Next, the rods are not sensitive to a wavelength of the incoming light and therefore cannot perceive color of
the incoming light.
A human eye is characterized by a certain temporal inertia of about 0.1-0.2 s.
It means that if a sequence of still images is shown in rapid succession, the brain
will reassemble the still images into a single, moving scene. Therefore this phenomenon enabled development of television and computer animation but at the
same time temporal inertia of a human eye is a significant handicap of human sight
when fast phenomena are to be observed.
The eye can perceive images of maximal contrast not higher than about 100:1.
However, the eye can adapt to different illumination conditions by readjusting its
exposure both chemically and by adjusting the iris. Several seconds are needed for
initial dark adaptation. Full adaptation through adjustments in retinal chemistry
can take as much as about thirty minutes. However, if we consider the possibility
of a human eye to perceive images at both very bright day and dark night then we
can say that after full adaptation, a human eye can achieve dynamic contrast ratio
of about 1000000:1. The process is nonlinear and multifaceted. An interruption by
light, nearly starts the adaptation process over again.
To summarize, a human imaging system can be considered as a small-size, universal, electro-optical imaging device of very high capabilities that enables human
perceiving high quality images of the neighbor scenery at a variable level of illumination. The human eye has much better dynamic response than any artificial light
sensing device and high power to adapt to different illumination conditions. It is
characterized by high accuracy of alignment and it can distinguish between hundred
of thousands of colors or tones. It can operate the best in daylight condition but also
works relatively well in weak illumination conditions. However, a human eye is
not perfect and there are a few serious disadvantages of human eye from the point
of its effectiveness as a surveillance tool:
1. Limited spatial resolution that limits perceiving small details of the targets,
particularly long distance targets.
2. Limited sensitivity that decreases effectiveness of observation in night conditions.
3. Short surveillance ranges in bad visibility conditions in a visible range (fog,
rain, snow, dust).
4. No capabilities to record images, to process them and to transfer to other humans in easy, accurate way.
5. Relatively easy camouflage in a visible range.
6. Human eye is sensitive only in a narrow spectral band of optical radiation,
i.e., in the visible range.
Electro-optical imaging systems improve capabilities of a human eye and remove,
at least partially, the mentioned above limitations.
5
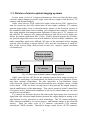
1.3 Division of electro-optical imaging systems
From a point of view of a support to human eye there are basically three types
of electro-optical imaging systems: night vision devices (night vision devices), TV
cameras, and thermal imagers.
Night vision devices NVD (called also night vision devices I2S) improve human eye sensitivity and offer observation in most night conditions. TV cameras
generate high quality color or monochromatic images of the observed scenery in
day conditions and ensure later recording, processing and later transfer of these images using modern telecommunication equipment. Some types of TV cameras (often called LLTV cameras) offer improved sensitivity and can be used in night conditions for similar applications like NVDs. Finally, thermal cameras due to different spectral ranges can work even at total darkness, in bad visibility conditions, and
make camouflage much more difficult. All types of the mentioned earlier imaging
systems, when working at narrow field of view, provide visualization of small details of the scenery being observed and in this way improve spatial resolution
of a human eye.
Electro-optical
imaging systems
Night vision
devices
TV cameras
Thermal imagers
Fig. 1.5. Basic types of electro-optical imaging systems.
Night vision devices (NVD) are the imaging systems built using an image intensifier tube consisting of a photocathode, an anode in form of a phosphor screen,
and other optional components. The tube intensifies a low-luminance image
of the observed objects created on the photocathode into a brighter image created
on the anode. NVDs are direct viewing devices that generate the output image by
optical amplification of the input image. They can be treated as optical intensifiers
of a scenery at low illumination conditions to the levels when human eye can carry
out effective surveillance.
TV cameras are electronic devices that convert the input image into an electrical
signal that after electrical amplification generate the output image in analog or digital formats used by television or video technology. The TV camera technology
offers inherent capabilities to record, process and transmit image of the observed
scenery. There are many types of TV cameras: color/mono CCD cameras,
color/mono CMOS cameras, intensified charge couple device (ICCD) cameras,
6
cooled CCD cameras and electron-bombarded charge couple device (EB CCD)
cameras, silicon intensified target (SIT) tube cameras, intensified silicon intensified
target (ISIT) tube cameras, etc.
Thermal imagers are the imaging systems sensitive to mid-wave and long-wave
infrared radiation that generate images of the observed scenery using thermal radiation emitted by the scenery.
The origin of all three groups of electro-optical systems is connected with military applications. However, at present, these imaging systems are used in high numbers of military and civilian sectors.
According to a type of radiation used to create an image of the observed scenery,
electro-optical imaging systems can be divided into two distinct groups: the systems that create image using the radiation emitted by the observed targets
and the systems that create an image using the radiation reflected by the observed
targets. Imaging systems of spectral bands located in wavelengths of over 3 µm
belong to the first group; imaging systems of spectral bands located in visible or
NIR spectral range up to 1 µm belong to the second group.
stars
Sun
Moon
NVD
TV camera
target
thermal
imagers
target
Fig. 1.6. Principle of work of night vision devices, TV cameras and thermal imaging systems.
Night vision devices and TV cameras are sensitive to a visible range and near
infrared radiation up to about 1 µm because the Sun, the Moon, and stars emit
mostly in visible and near infrared spectral bands. Thermal imaging systems use
medium and far infrared range from about 3 µm to about 15 µm because targets
of typical temperatures on the Earth emit mostly in this spectral band. Because
spectral sensitivity band of I2Ss and TV cameras at least partially overlaps the spec7
tral band of a human eye images generated by NVD or TV cameras are similar to
the images generated by human sight. Thermal imaging systems are truly infrared
imaging systems that generate images that significantly differ from the images generated by human sight.
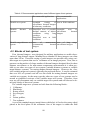
1.4 Concept of testing
Sets of technical data used in specifications of E-O systems to describe their
characteristics vary significantly. However, in general, all these sets can be divided
into three groups: physical (mechanical, electrical) characteristics, environmental
characteristics, and performance characteristics.
Measurement methods of physical and environmental characteristics of electrooptical systems do not differ significantly from measurement methods of the same
characteristics of other type of photonic systems. The test methods can be found in
numerous literature and will not be discussed in here. We are to concentrate on
a measurement of performance characteristics.
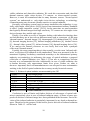
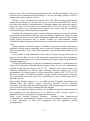
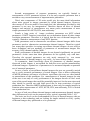
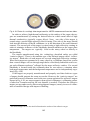
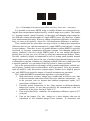
Quality of the output image is the most important criterion for evaluation
of operation of electro-optical imaging systems. We cannot objectively judge
an imaging system (thermal camera, NVD, TV camera) looking on the image
of a typical scenery. Quality of the image can be bad for some people but still
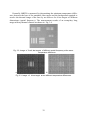
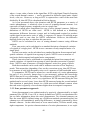
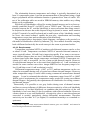
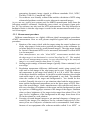
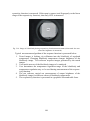
acceptable for others. As shown in Fig. 1.7 we cannot determine whether the right
image is acceptable or not without proper testing.
Fig. 1.7. Image of the same target obtained using two thermal cameras.
An imaging system cannot be properly evaluated on the basis of the image of a typical scenery but it can be properly evaluated on the basis of the image of some
standard targets (4-bar targets, square targets, circle targets, slit targets, different
types of resolution targets, sine targets etc.) projected by a measuring system (target
projector) to the tested imaging system. Using proper measuring systems and having a knowledge about radiometric and photometric parameters of the emitted radiation we can measure parameters that describe precisely performance of different
infrared imaging systems: thermal cameras, NVD, and different types of TV cameras.
In spite of the same general testing concept, there are significant differences
between the apparatus for testing far infrared imaging systems (thermal imaging
8
systems) and the apparatus for testing visible/near infrared systems (NVD, TV cameras).
Photometric methods developed visible range are used also for near infrared range,
when radiometric methods based on temperature control are needed for far infrared
range.
List of differences in the test methods for testing the far infrared systems
and the test methods for testing visible/near infrared systems is presented in Table
1.1.
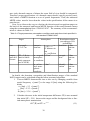
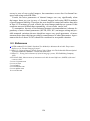
Table 1.1. Basic differences between apparatus for testing far infrared systems and apparatus for testing visible and near infrared systems.
Testing thermal imagers
source of radiation
method of radiation
measurement
type of projector optics
units of radiation
targets
low temperature blackbody
measurement of radiator
temperature
reflective
standard temperature units
or radiometric units
transparent
patterns
(holes) in metal sheets
Testing NVD and TV
cameras
high temperature bulb
measurement of light
quantities
typically refractive
photometric units
non transparent patterns on transparent
glass sheets
1.5 Terminology
In spite of a relatively long tradition of IR systems still there are no internationally accepted terminology standards in most areas of this technology. At present,
only terminology related to quantities of infrared radiation and detectors of this radiation has been relatively well standardized in the International Lighting Vocabulary published by the International Lighting Commission CIE and the International
Electrotechnical Commission CIE in 1987[15]. However, there are vast areas of the
infrared technology where terminology is not standardized mostly due to the fact
that scientists and engineers of completely different background work nowadays in
infrared technology. It results in situation when different authors use different terminology in scientific papers, manuals and catalogs making them difficult to understand even for professionals. Such a situation is particularly difficult for newcomers
to this technology and non-native English speakers. Some examples will be discussed next.
Firstly, we will start with the term “electro-optical system” used quite often in
this chapter. This popular mostly in USA and Asia term, is used in this book
but the terms “optoelectronic systems” or “optronic systems” have the same meaning and are quite often used in literature, too. Next, the term “electro-optical system” in general refers to any system that uses optical radiation: infrared radiation,
9
visible radiation and ultraviolet radiation. We used this convention and classified
thermal cameras, night vision devices, TV cameras as electro-optical systems.
However, it must be remembered that in many literature sources “electro-optical
systems” are understood as only night vision devices technology or technology
of manufacturing any electronic element sensitive to optical radiation.
Secondly, an imaging system based on image intensifier tube technology is typically called night vision device (NVD) but in some international military standards
is called “image intensifier system” [29,30]. At the same time we must remember
that logically thermal imagers and high sensitivity TV cameras are also night vision
devices because they enable nigh vision.
Thirdly, if we make a review of literature dealing with infrared technology then
we find that there are at least eleven different terms used as synonyms of the term
“thermal camera”: thermal imager [19], thermograph [31], thermovision [23], FLIR
[9], thermal imaging devices [25], infrared imaging radiometer [8], thermal viewer
[1], thermal video system [32], infrared camera [18], thermal imaging device [24].
If we analyze the Internet resources we can easily find even more synonyms
of the term “thermal camera”.
Fourthly, the most surprising thing is that actually even the term “infrared radiation” or division of IR radiation is not standardized. There was presented in the International Lighting Vocabulary considered nowadays as the international primary
authority on terminology in radiometry the range of optical radiation a proposal
of division of optical radiation (see Table 1.2) but not as compulsory division
but only as a recommended division. Additionally, in case of visible radiation, due
to human diversity, only approximate limits were given. Further on, what is
the most important, these recommendations are not accepted in most communities
working in the field of optical radiation due to many, mostly historical reasons.
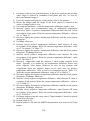
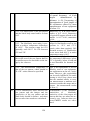
Table 1.2. Division of optical radiation recommended by the CIE.
Name
UV-C
UV-B
UV-A
VIS
IR-A
IR-B
IR-C
Wavelength range
0.1 µm - 0.28 µm
0.28 µm - 0.315 µm
0.315 µm - 0.4 µm
approximately 0.36-0.4 µm to 0.76 -0.8µm
0.78 µm - 1.4 µm
1.4 µm - 3 µm
3 µm - 1000 µm
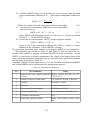
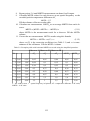
Confusion in area of limits and further division of sub-ranges of optical radiation is particularly clear in case of infrared radiation range. A dozen or more proposals on division of infrared range have been published in the literature. Precise division of the infrared radiation is particularly important for any book on thermal imagers. Therefore for the purpose of this book a precise division of infrared radiation
shown in Table 1.3 will be used.
10
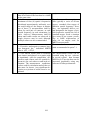
The division shown in Table 1.3 is based on the limits of spectral bands
of commonly used infrared detectors. Wavelength of 1 µm is a sensitivity limit of
popular Si detectors used in TV imagers. Similarly, 3-µm wavelength is a longwave sensitivity limit of PbS and InGaAs detectors used in near SW IR imagers.
Wavelength of 6 µm is a sensitivity limit of InSb, PbSe, PtSi detectors and HgCdTe
detectors optimized for 3-5 µm atmospheric window used in medium-wave thermal
imagers. Finally, 15-µm wavelength is a long-wave sensitivity limit of HgCdTe detectors optimized for 8-12 µm atmospheric window or non-cooled detectors with
long-wave filter used in long wave thermal imagers.
Table 1.3. Division of infrared radiation used in this book.
Name
near infrared NIR
short wave infrared SWIR
mid-wave infrared MWIR
long-wave infrared LWIR
very long-wave infrared VLWIR
Wavelength range
0.78 µm - 1 µm
1 µm - 3 µm
3 µm - 6 µm
6 -15 µm
15 µm - 1000 µm
It is possible to present many more examples of a certain chaos in the terminology related to electro-optical systems. The aim of the author of this book is to use
the precisely defined and strictly kept terminology in all book chapters. However,
the reader must be aware that in a situation of general chaos in terminology related to electro-optical imaging systems it is difficult to achieve this aim and there
can be some inconsistency in terminology used in the book.
1.6 Basic metrological terms
Testing electro-optical imaging systems practically means to measure the parameters of these systems. A measurement is a non-accurate operation. Measurement
results always differ from the true value of the measured quantity. Equality of
the measurement result and the true value of the measured quantity is an exceptional incident and we do not know when such an incident occurs.
It is recommended for the test teams to be familiar with some basic metrological
terms.
Accuracy of a measurement result can be only estimated. It can be done using
classical error theory or modern uncertainty theory.
Classical error theory proposes so called limit error as a measure of measurement
accuracy. Models that can be used for determination of limit errors can be found in
many books dealing with metrology.
Uncertainty theory proposes the uncertainty as such a measure of accuracy of measurement results [16]. Rules for evaluation of uncertainty in measurement are
presented in the "Guide to the expression of uncertainty in measurement" [10] published in 1993 by five main international metrological organizations: the Interna11
tional Organization for Standardization (ISO), the International Electrotechnical
Commission (IEC), the International Organization of Legal Metrology (OIML),
and the International Bureau of Weights and Measures (BIPM). Additional comments can be find in Refs. 6 and 11.
The terms "accuracy", "error", “systematic error”, “random error”, "uncertainty"
and “limit error” apparently seem to be easily understood intuitively. However, in
practice these terms are often a source of confusion as it is possible to find radically
different definitions in different literature sources. Therefore, let us define them
clearly now to prevent any possible misunderstanding.
The International Vocabulary of Basic and General Terms in Metrology commonly abbreviated VIM, published jointly by the mentioned above seven international metrological organizations, can be considered as the present day most important international standard [16]. Definitions of five mentioned above terms according to the VIM are presented below.
Accuracy of measurement [VIM3.5] - closeness of the agreement between the result
of a measurement and true value of the measurand,
where the “measurand” is a specific quantity subject to measurement1.
Error (of measurement) [VIM 3.10] - result of a measurement minus the value of
the measurand.
Random error [VIM 3.13] - result of a measurement minus the mean that would
result from an infinite number of measurements of the same measurand carried out
under repeatability conditions.
Comment: By means of statistical analysis it is possible to estimate the random error.
Systematic error [VIM 3.14] mean that would result from an infinite number of
measurements of the same measurand carried out under repeatability conditions
minus the value of the measurand.
Comment: The systematic error equals to error minus random error. Similarly to
earlier defined terms "measurand" and "error" it cannot be fully known; it can be
only estimated.
Uncertainty (of measurement) [VIM 3.9] - a parameter, associated with the result
of a measurement, that characterizes the dispersion of the values that could be reasonably attributed to the measurand (the parameter mentioned above is usually
a standard deviation or a given multiple of it).
The term "limit error" is not included into the VIM. However, on the basis of analysis of the Ref. 10 it can be defined as presented below
Limit error - a range around the result of the measurement in which the true value
of the measured quantity is located with high value of probability.
From analysis of the presented above definitions we can draw three basic conclusions.
1
Because the term "measurand" is relatively new and still not accepted widely in literature,
the term "measured quantity" will be used in the rest of this book.
12
First, that “accuracy” is only a qualitative concept that should not be associated
with numbers. This means that we should not specify instrument accuracy as equal
to a certain number as it is unfortunately a common practice so far. We are allowed
according to the VIM to say only that accuracy is good, bad etc.
Second, the defined, according to the VIM, term "error" is a perfect measure
of measurement accuracy. However, this true error of measurement is always unknown because the true value of the measured quantity is unknown. The same can
be said about its component: the systematic error. Let us temporarily call the term
“error” as the “true error” to make a better distinction with the term “limit error”.
Third, two other measures of measurement accuracy: the uncertainty and limit
error of the result of a measurement may be evaluated. These two measures of
measurement accuracy are useful for users of measuring instruments who know
only the instrument indication and want to estimate accuracy of the measurement
result. Guidelines on evaluation of uncertainty of measurement results are presented
in the mentioned earlier "Guide to the expression of uncertainty in measurement",
guidelines on evaluation of limit error – in numerous metrology handbooks.
To summarize, the uncertainty is nowadays the measure of measurement accuracy recommended by international metrological organizations and there are quite
clear rules how the uncertainty of measurements should be calculated. However,
the problems in consistent use of these recommendations are that these recommendations are often ignored by international community working in the field of electrooptical metrology due to different reasons.
1.7 Structure of the book
As it was stated in Section 1.2, electro-optical imaging systems can be divided
into three basic types: night vision devices, TV cameras, and thermal imagers. This
book is devoted to the problems of testing and evaluation of thermal imagers.
There are many myths about thermal imagers. The conflicting opinions about
performance of these modern and fascinating imaging systems are given. It is also
known that quality of thermal imagers offered on the market vary significantly.
The only way to be sure about quality of the interesting imagers is to test them
and evaluate test results.
Nowadays, testing thermal imagers is very important for many people involved
in thermal imaging technology due to several reasons.
Firstly, thermal imagers are still quite expensive. A the same time, the number
of thermal imagers used in surveillance applications by military, police, border
guards, rescue teams etc. is increasing quickly. Thermal imagers are often purchased within big tenders of total value over one million EUR. There are sometimes
doubts whether the offered or delivered thermal imager fulfill technical specifications of the tender. Results of testing thermal imagers offered in such tenders are
very important for decision makers.
Secondly, a number of thermal imagers used in automotive industry increases
quickly. It is still the beginning of a long process but even now the automotive in13
dustry is one of the most important application areas of thermal imagers. The main
criterion for the automotive thermal imager is its cost but image quality is still important and proper testing is needed.
Thirdly, a price of infrared focal plane areas (IR FPA) decreased significantly
during the last decade. It is particularly true in case of non-cooled IR FPAs. Due to
this reason the number of manufacturers of thermal imagers has increased significantly. The only ways for these new manufacturers to be sure about real quality
of their products is to test them and compare test results with the parameters
of thermal imagers offered by their competitors.
Fourthly, the competition on the market of thermal imagers is strong. Good market position can be reached and kept only if an imager of good ratio quality to price
is delivered. In order to keep stable and known quality, the extensive and accurate
testing during production line is needed. Further on, semi-automatic testing
of thermal imagers during a production process can speed up the process and reduce
costs.
Fifthly, quality of thermal imagers, similarly to any other systems, deteriorates
with time. Having proper measuring sets we can select thermal cameras that do not
fulfill requirements at the end of the guarantee’s period and replace them for the
new ones.
It is possible to find additional reasons why the proper testing of thermal imagers is needed. However, even the arguments presented earlier show importance
of testing thermal imagers for a wide community of people connected with thermal
imaging technology.
Testing thermal imagers is quite well standardized and there is rich literature on
subject of testing and evaluation thermal imagers. There are several standards that
regulate testing thermal imagers [28,2,3,17], valuable books that provide a lot
of useful information in testing and evaluation thermal imagers [12,13,14],
and hundreds of scientific papers on this subjects like sample Refs. 5,27,26,4,7,22.
However in spite of available standards, valuable books and numerous literature
less experienced test teams meat a lot of problems to carry out their tasks due to
different reasons.
First, testing thermal imagers is a very difficult task. Extended knowledge from
different areas like physics, optics, electronics, thermal sciences, precision
mechanics, metrology and practical experience with thermal imagers are needed to
carry out effectively testing of modern thermal imagers.
Second, some important questions about test methods and precise requirements on
test equipment are not answered or it is difficult to find a proper answer in
numerous literature on subject of testing thermal imagers.
Third, freely detailed technical literature
available from manufacturers
of equipment for testing thermal imagers is rare and sometimes compiled in a way
to show superiority of their own equipment over the equipment offered
by competitors.
14
This book consists of seven chapters. Chapter 1 is already read introduction
of this book where the concept of electro-optical imaging systems, human sign
properties, division of electro-optical imaging systems, terminology of E-O systems, basic metrological terminology were introduced.
Thermal imagers employ the phenomenon of thermal radiation create thermal
image of the scenery being observed. Therefore, the whole Chapter 2 “Thermal radiation” is devoted to the discussion about properties of thermal radiation. Firstly,
quantities and units of this kind of radiation are presented. Next, basic laws are discussed. The laws describe only a phenomenon of thermal radiation emitted by
an ideal type of objects, i.e., blackbodies. Therefore radiant properties of real materials are also discussed to enable us the analysis of radiation emitted by real materials. Further on, the influence of the atmosphere on propagating radiation is discussed. Finally, rules of source/receiver flux calculations are presented.
In Chapter 2, a short review of thermal imaging technology is presented. Different generations of thermal imagers are discussed. Some technical details of design
of thermal imagers are shown. Finally, main applications of thermal imagers are
presented.
Chapter 3 is devoted to definitions and measurement principles of numerous
characteristics of thermal imagers. At first, the characteristics are divided into several main groups and later the definitions and each group is analyzed.
In Chapter 4, modern equipment for testing thermal imager is discussed.
At first, several different types of test systems are presented. Next, all major modules of test systems for testing thermal imagers are presented and analyzed. Conclusions about requirements for these modules are shown, too.
In Chapter 5, procedures of measurement of main characteristics of thermal imagers are discussed. MRTD measurement procedure was discussed in detail due to
its subjective, manual characters. Measurement procedures of other parameters like
MTF, responsivity function, and noise parameters (NETD, FPN,
non
uniformity,1/f, 3D noise components, NPSD) were presented shortly due to semiautomatic measurement character of their measurement and possible differences
of measurement techniques using equipment from different manufacturers.
In Chapter 6, comments on requirements on test equipment of the Stanag 4349
standard are presented. The comments can be useful for laboratories that implemented quality systems according to ISO/EN standards and need to prove that their
test system fulfill requirements of this well known standard.
Finally, in Chapter 7 short guidelines for buyers of equipment for testing thermal
imagers are given. The guidelines can be useful for scientific/manufacturing centers
that analyze possibility of purchase of such test equipment.
1.8 References
1. Anderson D.; M1A2 tank commander's independent thermal viewer optics: optics design perspective, Proc. SPIE Vol. 1970, p. 128-138, Systems-Oriented Optical Design, Thomas U.
Kampe; Joseph H. Oberheuser; Eds. Publication Date: 8/1993.
15
2. ASTM standard E 1213-2002 “Standard Test Method for Minimum Resolvable Temperature
Difference for Thermal Imaging Systems”
3. ASTM standard E 1311-99 “Standard Test Method for Minimum Detectable Temperature Difference for Thermal Imaging Systems”
4. Bryant Paul, Grigor Jack, McHugh Stephen; White Steve, Performance comparison of reflective and emissive target projector systems for high-performance IR sensors, Infrared Imaging
Systems: Design, Analysis, Modeling, and Testing XIV, SPIE Vol. 5076, p. 242-249, 2003.
5. Driggers Ronald, Hodgkin Van A., Vollmerhausen Richard, O'Shea Patrick, Minimum resolvable temperature difference measurements on undersampled imagers, Infrared Imaging Systems: Design, Analysis, Modeling, and Testing XIV; SPIE Vol. 5076, 2003.
6. EA-3/02, The Expression of Uncertainty in Quantitative Testing (previously EAL-G23),
European Cooperation for Accreditation, 1996
7. Forrai David; Bertke Stephen; Fischer Robert; Back Thomas, Test techniques for high performance thermal imaging system characterization, Infrared Imaging Systems: Design, Analysis,
Modeling, and Testing XVII, SPIE Vol. 6207, 2006.
8. Griffith B. et al., Buildings research using infrared imaging radiometers with laboratory
thermal chambers, Proc. SPIE Vol. 3700, p. 502-513, Thermosense XXI, Dennis H. LeMieux;
John R. Snell; Eds., Publication Date: 3/1999
9. Gruben J. et al., Scene-based algorithm for improved FLIR performance, Proc. SPIE Vol. 4030,
p. 184-195, Infrared Imaging Systems: Design, Analysis, Modeling, and Testing XI, 2000.
10. Guide to the expression of uncertainty in measurement, International Organisation for
Standarisation-International Electrotechnical Commission-International Organisation of Legal
Metrology-International Bureau of Weights and Measures, TAG 4/WG 3, 1993.
11. Guidelines for Evaluating and Expressing the Uncertainty of NIST Measurement Results,
NIST Technical Note 1297, 1994
12. Holst G.C., Electro-Optical Imaging System Performance, SPIE, 2005.
13. Holst G.C., Infrared Imaging System Testing, Vol.4, Chapt. 4 in The Infrared & Electro-Optical Systems Handbook, Michael C. Dudzik ed, SPIE 1993..
14. Holst G.C., Testing and evaluation of infrared imaging systems, JCD Publishing Company
1993.
15. International Lighting Vocabulary, CIE Publ. No. 1 7.4, IEC Publ. No. 50(845) (1987).
16. International Vocabulary of Basic and General Terms in Metrology, International Organisation
for Standarisation, 1993.
17. ISO 15529, Principles of measurement of modulation transfer function (MTF) of sampled
imaging systems, 1999.
18. Miller J., L., An introduction to infrared cameras, 1999 The photonics design and applications
handbook, Laurin Publ. Co, p. 133-139, 2000.
19. Pruchnic et al., Design, analysis, and testing of collimators used for testing low-resolution
thermal imagers, Proc. SPIE Vol. 2743, p. 337-348, Infrared Imaging Systems: Design, Analysis, Modeling, and Testing VII, Gerald C. Holst; Ed. Publication Date: 6/1996
20. Qin Y. et al. , Novel quantitative NDT method for composite structures, Proc. SPIE Vol. 3173,
p. 274-278, Ultrahigh- and High-Speed Photography and Image-based Motion Measurement,
Donald R. Snyder; Andrew Davidhazy; Takeharu Etoh; C. Bruce Johnson; James S. Walton;
Eds. Publication Date: 12/1997
21. Rodgers A.L., Surveillance and target acquisition systems, Brassey's Battlefield Weapons Systems&Technology Vol.VII, Brassey's Publishers Ltd., 1983.
22. Fourier Ron, Accuracies in FLIR test equipment, 7th Mtg in Israel on Optical Engineering,
SPIE Vol. 1142, pp.109-117, 1991.
16
23. Saginov, L., Influence of spectral characteristics of IR (8-12 µm) photodetectors on thermovision system parameters, Proc. SPIE Vol. 4340, p. 305-307, 16th International Conference on
Photoelectronics and Night Vision Devices, Anatoly M. Filachev; Ed., 11/2000.
24. Schwalm R., Design solutions for thermal imaging devices in military vehicles , Proc. SPIE
Vol. 2736, p. 259-270, Enhanced and Synthetic Vision 1996, Jacques G. Verly; Ed. Publication Date:5/1996
25. Schwalm R., Design solutions for thermal imaging devices in military vehicles , Proc. SPIE
Vol. 2736, p. 259-270, Enhanced and Synthetic Vision 1996, Jacques G. Verly; Ed. Publication Date:5/1996
26. Sousk Stephen; O'Shea Patrick; Hodgkin Van, Measurement of uncooled thermal imager
noise, Infrared Imaging Systems: Design, Analysis, Modeling, and Testing XVI Conference,
SPIE Vol. 5784, p.301-308, 2005.
27. Sousk Stephen; O'Shea Patrick; Hodgkin Van, Uncertainties in the minimum resolvable temperature difference measurement, Infrared Imaging Systems: Design, Analysis, Modeling, and
Testing XV Conference, SPIE Vol. 5407, p.1-7, 2004.
28. STANAG 4349, Measurement of minimum resolvable thermal difference (MRTD) of thermal
cameras, 1995
29. STANAG No. 4348, Definition of nominal static range performance for image intensifier systems, 1988.
30. STANAG No. 4351, Measurement of the minimum resolvable contrast (MRC) of image intensifiers,1987.
31.Thermographic Terminology - Supplement 2 to Acta Thermographica, 1978.
32. Zhu D. et al., Temperature measurement of gas flow with high temperature and speed using
thermal video system, Proc. SPIE Vol. 3783, p. 373-379, Optical Diagnostics for
Fluids/Heat/Combustion and Photomechanics for Solids, Soyoung S. Cha; Peter J. BryanstonCross; Carolyn R. Mercer; Eds.10/1999.
17
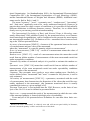
2 Review of thermal imagers
Thermal imagers are imaging systems that generate images of the observed
scenery using thermal radiation emitted by the scenery. These numerous imaging
systems can be divided into several different groups.
First, according to a method of creation of two-dimensional image of the observed scenery, thermal imagers can be divided into two distinct groups: thermal
cameras and imaging thermal scanners.
Second, according to application area, thermal imagers can be divided into two
groups: surveillance thermal imagers and measurement thermal imagers.
Third, according to a spectral band, thermal imagers can be divided into two
(optionally three) groups: MW(mid-wave infrared) thermal imagers and LW (longwave) imagers. Sometimes SW (short wave) thermal imagers are added too.
Fourth, according to technology of IR detector (IR FPA), thermal imagers can be
divided into at least three different generations.
Thermal imagers
Generation III
Generation I
SW imagers
LW imagers
Generation II
generation
spectral band
MW imagers
Measurement imagers
application
Surveillance imagers
Thermal scanners
Thermal cameras
image
Fig. 2.1. Classification of thermal imagers.
2.1 Thermal cameras versus thermal scanners
Thermal camera is a thermal imaging system that enables us creation of a twodimensional thermal image of the observed scenery independently whether the system or objects are movable or stationary ones.
Imaging thermal scanner is a thermal imaging system that provides creation
of a two-dimensional thermal image of the observed scenery only when the scanner
or the objects are moving.
Thermal cameras represent probably over 99% of all existing thermal imagers.
Imaging thermal scanners are almost exclusively airborne systems used for recon18
naissance applications because they offer very wide field of view (standard 120º)
in contrast to the thermal cameras offering field of view not wider than about 30º.
Because of distinct differences in design of these two types of thermal imaging systems and narrow specialized market, the imaging thermal scanners are very expensive systems. Due to mass application of thermal cameras their prices are significantly lower. There exist numerous literature on both imaging thermal scanners
and on thermal cameras. We can here only mention that detail presentation
of a design of thermal cameras was presented in Refs: 6,7,12,11,10 and detail discussion on a design of imaging thermal scanners in Ref. 5.
As we mentioned earlier, thermal cameras are the most numerous group
of thermal imagers. Practically, almost all thermal imagers are thermal cameras.
Therefore both review of thermal imagers and later analysis of test methods in next
chapters is mostly limited to thermal cameras. Next, the terms “thermal imager” and
the term “thermal camera” will be used as equivalent terms.
2.2 Applications of thermal cameras
According to their applications, thermal imagers can be generally divided into
two basic groups: surveillance thermal cameras and measurement thermal cameras. The surveillance thermal cameras are mostly used in military applications for
observation of a battlefield in darkness or in difficult atmospheric conditions by creating the relative temperature distribution of the terrestrial scenery being observed.
The measurement thermal cameras are used for civilian applications in industry
and science; mostly for non-contact measurement of temperature distributions on
the surface of the tested objects. Nowadays, the borderline between these two
groups becomes more fluid as there are some cameras that can be used for both observation and measurement applications. However, this situation is still an exception from the rule as most surveillance cameras do not have capabilities to measure
temperature of the observed objects and the image quality of the measurement systems is inferior to the image quality of the observation thermal cameras.
Image quality is the most important criterion for performance evaluation of surveillance (military) thermal cameras. In case of measurement (commercial) thermal
cameras, the situation is more complicated.
Applications of measurement thermal cameras can be divided into two general
groups: the applications that require only relative temperature measurement
and the applications that require absolute temperature measurement. Although
the same cameras can be typically used in both applications there are different criteria of assessment of camera suitability for these two groups of applications. If
the camera is used in applications when only relative temperature measurement
is needed, like in non-destructive thermal testing (NDTT), then the quality
of the thermal image of the tested object is usually the most important criterion like
in the case of the surveillance thermal cameras. If the measurement thermal camera
is used in applications when an absolute temperature measurement is needed, then
accuracy of temperature measurement results is the most important criterion.
19
2.3 Spectral band
Objects of typical earth temperatures emit radiation mostly in the spectral region
from about 3 µm to about 15 µm. Thermal radiation emitted by these objects dominate over the radiation reflected by them at this spectral range because the radiation
emitted by sun, moon, stars and typical artificial sources is weak for wavelengths
over 3 µm. There are two „atmospheric windows” in the above mentioned range:
the 3-5-µm window and the 8-12-µm window. Therefore there are two main types
of thermal imaging systems: the middle-wave MW systems using the 3-5-µm window and the long-wave LW systems using the 8-12-µm window and rarely available commercially SW systems of spectral band located within 1-3-µm range.
MWIR spectral band and LWIR spectral band differ substantially with respect
to background flux, scene characteristics, temperature contrast, and atmospheric
transmission under diverse weather conditions. Factors which favor MWIR band
are: higher contrast, superior clear-weather performance (favorable weather conditions, e.g., in most countries of Asia and Africa), higher transmittance in high humidity, and higher resolution due about 3 times smaller optical diffraction. Factors
which favor LWIR band are: better performance in fog and dust conditions, winter
haze (typical weather conditions, e.g., in West Europe, North USA, Canada), higher
immunity to atmospheric turbulence, and reduced sensitivity to solar glints and fire
flares. The possibility of achieving higher signal-to-noise (S/N) ratio due
to the greater radiance levels in LWIR spectral range is not persuasive because
the background photon fluxes are higher to the same extent, and also because
of readout limitations. Theoretically, in staring arrays charge can be integrated for
full frame time, but because of restrictions in the charge-handling capacity
of the readout cells, it is much less compared to the frame time, especially for
LWIR detectors for which a background photon flux exceeds the useful signals by
orders of magnitude.
To summarize, in general, the LWIR band is preferred for high performance
thermal imaging because of its higher sensitivity to ambient temperature objects and
its better transmission through mist and smoke. However, the 3-5 mm band may be
more appropriate for the hotter object, or if sensitivity is less important than contrast. Also additional differences occur; e.g. the advantage of MWIR band is smaller
diameter of the optics required to obtain a certain resolution and that some detectors
may be operated at higher temperatures (thermoelectric cooling) than it is usual in
the LWIR band where cryogenic cooling is required (about 77 K). Therefore there is
no definite, always valid answer which type of thermal imagers (MW thermal imagers or LW thermal imagers) should be preferred. Both types of thermal imagers
have certain advantages and disadvantages.
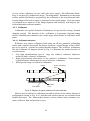
2.4 Generations of thermal imagers
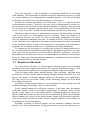
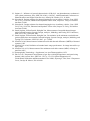
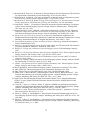
Thermal cameras are generally divided into three generations. Scanning cameras
built using discrete detectors, simple non-multiplexing photoconductive linear ar20
rays (typically PbSe, InSb or HgCdTe) of elements number not higher than about
one hundred, or the SPRITE detectors are the first generation thermal cameras.
They usually operate in 8-12-µm spectral range, use the optics of F/2-F/4 number,
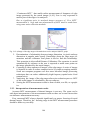
and are characterized by temperature resolution NETD about 0.2 K. Small quantities of first generation thermal cameras were introduced as military equipment in
the 1970s, more in the 1980s. Thousands of these systems are still in military services, spare part will be available for many years. The US common module
HgCdTe arrays that employ 60, 120 or 180 photoconductive elements are the prime
example of Gen 1 thermal cameras.
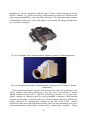
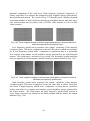
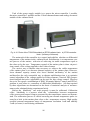
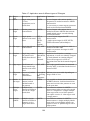
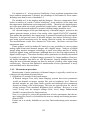
Fig. 2.2. Exemplary Gen 1 thermal camera: LORIS (courtesy of FLIR Inc.).
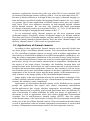
Scanning cameras built using linear or 2D focal plane arrays (FPA) of elements
number higher than about 100 but lower than about 10000 are the Gen 2 thermal
cameras. Temperature resolution NETD of these cameras is improved up to
the level of about 0.1 K. They are also characterized by smaller weight and size and
improved reliability. The 1980s is a period when most modern army forces started
to use the second generation thermal cameras. The cameras of this generation are
presently majority of all military thermal cameras. New version of these FPAs
offered in a form of a single chip fully integrated with readout electronic are even
now an attractive solution for many observation applications. Thermal cameras built
using these improved linear FPAs are often termed Gen 2+. Temperature resolution
NETD of Gen 2+ can be improved up to the level of about 0.05 K. Typical examples of these systems are HgCdTe multilinear 288×4 arrays fabricated by Sofradir both for 3–5-µm and 8–10.5-µm bands with signal processing in the focal
plane (photocurrent integration, skimming, partitioning, TDI function, output
preamplification and some others).
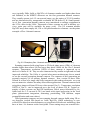
Third generation cameras are non-scanning thermal cameras build using 2D array detectors (cooled FPA based on InSb, HgCdTe, QWIP technology or noncooled FPAs based on microbolometer or pyroelectric/ferroelectric technology) that
have at least 106 element on the focal plane. These staring arrays are scanned elec21
tronically by circuits integrated with the arrays. These readout integrated circuits
(ROICs) include, e.g., pixel deselecting, antiblooming on each pixel, subframe imaging, output preamplifiers, and some other functions. The opto-mechanical scanner
is eliminated and the only task of the optics is to focus the IR image onto the matrix of sensitive elements.
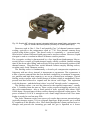
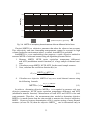
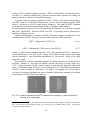
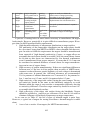
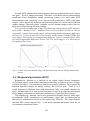
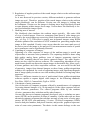
Fig. 2.3. Exemplary Gen 2 thermal camera: Sophie (courtesy of Thales Optronique).
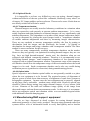
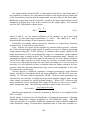
Fig. 2.4. Exemplary cooled Gen 3 thermal camera: Catherine XP (courtesy of Thales
Optronique).
Third generation thermal cameras have been offered since the beginning of the
90s to compete with their predecessor. First, they have been offered as cooled
MWIR cameras (using InSb or HgCdTe technology) sensitive in 3-5-µm atmospheric window in situation when for most geographic conditions LWIR thermal
cameras are desirable. Cooled LW IR Gen 3 thermal cameras based on QWIP technology started to be commercially available at the end of the 1990s. Almost
at the same time non-cooled thermal cameras based on microbolometer and pyroelectric/ferroelectric technologies became fully commercially available. Image
22
quality of non-cooled thermal cameras is inferior to image quality offered by
cooled cameras but is good enough to be used in many short and medium range applications. Due to a 2-4 times lower price than equivalent cooled systems, the number of non-cooled thermal cameras is growing rapidly in both military and commercial applications.
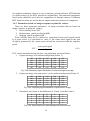
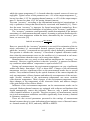
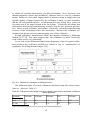
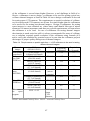
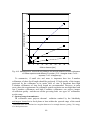
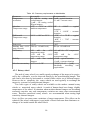
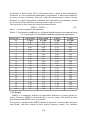
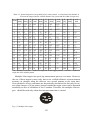
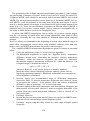
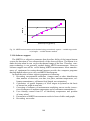
Parameters of thermal cameras from the same generation can vary significantly.
Therefore it is not possible to form a single table enabling accurate comparison
of parameters of thermal cameras from different generations. Table 2.1 was created
on the basis of a review of the parameters of different observation thermal cameras
offered during the last 30 years but should be treated as an estimation of the sophisticated situation on the market.
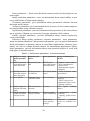
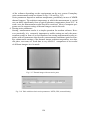
Table 2.1. Typical parameters of thermal cameras.
No
Examples
temperature
resolution
NETD [K]
Gen 60,120 pixels CMT (US 0.2
1
common modules)
8,14 pixels CMT SPRITE
(US, UK common modules)
image
cooler type
resolution
Gen 94×4 pixels CMT (Ophelios)
2
288×4 CMT (Synergy, Catherine, Sophie, Iris)
Gen 320×240 HgCdTe MWIR
3
(Opal, Spike, Matiz)
320×240
QWIP
LWIR
(Thermovision 2000, Catherine QWIP)
--------------------------------640×512 HgCdTe MWIR
( High Definition POD)
---------------------320×240 ferroelectric (Lion
320×240 bolometric (Elvir)
0.1
640×288
0.05
320×240
---------0.15-0.3
640×480 Stirling
(microscanning)
-------------------Stirling
----640×512
-----------uncooled
------------320×240
23
250×190
mass
[kg]
-liquid ni- > 20
trogen
-Joule
Thomson
- Stirling
-Stirling
>4
JouleThomson
>2
Fig. 2.5. Exemplary non-cooled Gen 3 thermal camera: ELVIR (courtesy of Thales Angenieux).
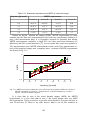
As we can see in Table 2.1, the Gen 2 thermal cameras are characterized by significantly better thermal and spatial resolution that the Gen 1 thermal cameras. This
means that quality of the image and sensitivity offered by the latter cameras is significantly inferior. However, situation is not so clear if we compare Gen 2 and Gen 3
cooled thermal cameras. Thermal sensitivity of Gen 3 cooled thermal cameras is
usually at least slightly better that of thermal resolution of Gen 2 cameras. However, image resolution of modern Gen 2 thermal cameras is superior to image resolution of typical Gen 3 cameras based on 320×240 FPA, particularly in a horizontal
direction. This inferiority of Gen 3 cameras can be eliminated by the use of microscanning technique, that can improve, up to two times, image resolution in both horizontal and vertical directions. However, the disadvantage of microscanning technique is the higher production costs and reduced reliability. The inferiority of image quality offered by typical Gen 3 thermal cameras in comparison to Gen 2 cameras can be fully eliminated if 640×512 or bigger FPAs are used.
A generation number is not connected strictly with image quality; it is more connected with mass, dimensions, manufacturing costs and reliability of the thermal
camera. The generation number suggest rather potential of the detector module but
does not describe quality of a thermal camera. Next, in order to evaluate properly
thermal cameras, not only image quality (detection, recognition and identification
ranges) but also other factors like mass, dimensions, resistance to harsh environmental conditions, ergonomics must be taken into account. Further on, there are, on
the market, thermal cameras integrated with additional modules like GPS, laser
range finder, goniometer, day light TV camera and laser pointer. These additional
modules can significantly increase capabilities of a thermal camera. To summarize,
evaluation and comparison of thermal cameras is a complicated and risky task that
requires to take into account a set of factors that could vary, depending on the final
user needs.
24
Fig. 2.6. Sophie MF – thermal camera integrated with laser range finder, goniometer, day
light TV camera and laser pointer (courtesy of Thales Optronique).
Detectors used in Gen 1, Gen 2 and partially Gen 3 of thermal cameras require
cooling, typically to the temperature equal to 77 K. First thermal cameras were
cooled using dewar coolers. The dewar cooler is essentially a “ vacuum bottle”
filled with a coolant. Different liquid gases can be used as coolants. However, liquid
nitrogen is used as a coolant in almost all dewars used in practice.
The cryogenic cooling is characterized by a few significant disadvantages like necessity to have a source of liquid nitrogen supply readily available, limited working
time of the dewar after filling, and necessity to keep quasi-horizontal position of the
thermal camera. Therefore later cooled thermal cameras employ Stirling coolers,
or rather rarely Joule-Thomson coolers.
The Stirling cooler is fundamentally a closed-cycle compression-expansion refrigerator with no valves; instead, it incorporates a regenerator. The regenerator is
a tube of porous material that has low thermal conductivity to maintain a temperature gradient and high heat capacity to act as an efficient heat exchanger. Typical
Stirling coolers operate with a sealed charge of helium, which is mechanically compressed and then allowed to expand near the dewar cold finger. This expansion
cools the detector , and the helium is then “recycled” through cooler’s compressor.
The Stirling coolers can cool the detector to the required temperature , usually
after 3-5 minutes from the turn on. These coolers require recharging and service by
the cooler manufacturer after a fixed period of time; typically after about 100010000 hours. Size and mass of these coolers depend on required cooling power. The
power of about 0.2-0.6 W is enough to cool a small single detector but a few times
higher is needed to cool an array FPA.
The Joule-Thomson cooler is an open cycle cooler that converts pressurized gas
(typically nitrogen, argon, CO2) to cryogenic liquid gas. High pressure gas is cooled
by expansion at the throttle valve, flows back through the counter-current heat exchanger and precools the incoming gas until the gas is liquefied as it leaves
25
the throttle valve. Because Joule-Thomson coolers require the supply of pressurized
gas they are rarely used in thermal cameras but they are typically used in IR guided
seekers where the required working time is relatively short.
Both Stirling coolers and Joule-Thomson coolers are relatively expensive components that represent a significant portion of cost of a whole thermal camera.
Therefore it was highly desirable to eliminate these components as it has been done
recently by introduction of non-cooled FPA based on microbolometer and pyroelectric/ferroelectric technologies. However, please note that so-called non-cooled FPAs
usually require temperature stabilization and thermoelectric coolers are usually used
in the non-cooled thermal cameras.
The thermoelectric coolers employ the effect of Peltier that makes possible to
generate the temperature changes using current flows in a circuit consisting of two
dissimilar conductors. A big disadvantage of the thermoelectric coolers is their nonability to cool detectors down to very low temperatures; temperature difference
of not more than about minus 50–70°C relative to ambient temperature can be
achieved. However, low cost of these coolers is their big advantage in sharp contrast to expensive Stirling coolers and Joule-Thomson coolers.
Apart from the MWIR thermal cameras and the LWIR thermal cameras there are
also SWIR cameras of a spectral band located within the spectral range 1-3 µm. It is
questionable whether the SWIR cameras are thermal cameras as in this spectral
range the reflected radiation dominates over the emitted radiation for the objects of
temperatures below about 100°C. However, let us treat them as a group of thermal
cameras because of very similar design to MWIR and LWIR thermal cameras.
At present, the SWIR cameras are only a marginal group of thermal cameras.
The SWIR cameras have been commercially available on the market for no more
than a decade. This situation originated the fact that the SWIR range has not been
an interesting range for both military and civilian applications for many decades.
Due to dominance of the emitted thermal radiation and the atmospheric windows,
military agencies were interested mostly in the MWIR and LWIR ranges. Because
of sensitivity range of human sight and well developed silicon technology the civilians were interested in the visible and NIR ranges.
This lack of significant interest created the situation when up to the middle
of the 1990s no well matured technology of detector arrays for SWIR range was
available [1]. Currently, this vacuum is occupied by InGaAs arrays and the SWIR
cameras have found a number of applications. The SWIR imagers are quickly gaining popularity in surveillance market due to higher image resolution than
MWIR/LWIR thermal imagers and better performance at limited visibility conditions than typical TV cameras based on silicon CCD/CMOS technology. At the
same time SWIR imagers have proved to be useful in telecommunication sector enabling accurate coupling of optical fibers working at 1.53 µm; and in museums for
painting reflectography.
26
2.5 Technology trends
Thermal imaging is one of the technologies of paramount importance for military&security sector. Thermal imaging has found also numerous applications in a civilian sector. Therefore it is not strange that there is a lot of efforts to improve existing technologies of manufacturing thermal imagers and to develop new technologies.
We can distinguish several trends in thermal imaging technology
1. Low cost low/medium resolution non-cooled thermal imagers
2. High-resolution cooled thermal imagers of improved surveillance capabilities
3. Dual band thermal imagers
4. Multi-sensor systems
Technology of non-cooled thermal imaging experienced very rapid growth during the last decade [13]. Parameters of non-cooled imagers improved so much that
nowadays non-cooled imagers dominate on the market of short range surveillance
thermal imagers in both military and civilian applications. The critical factor on this
market is a price. Therefore now, the technology efforts concentrate on decrease in
manufacturing costs but still keeping or even improving the image quality and reliability. Critical areas are two modules of non-cooled thermal imagers: infrared focal plane area and infrared optics.
The top end non -cooled thermal imagers offer 680x480 image resolution and
are directed mostly towards more demanding military applications. Non-cooled
thermal imagers of 320x240 image resolution are typically targeted to general surveillance and radiometric applications (security sector, automotive industry, noncontact temperature measurements, etc.). Imagers of 160x120 or lower resolution
are targeted to mass applications in low-cost intruder detection systems or as noncontact imaging thermometers.
Technology of cooled thermal imagers is for the last decade under the pressure
from non-cooled technology. Because of a need to use expensive cooler module,
the cooled technology is inherently more expensive that non-cooled technology.
Because of this situation, manufacturers of cooled thermal imagers concentrate on
market of long/medium range surveillance imagers or on applications that require
dynamic surveillance of high speed scenarios. The efforts go into four directions.
First, reducing costs of manufacturing of II and III Gen thermal imagers of medium
resolution (up to 640x480). Second, development of high resolution thermal imagers of image quality comparable to quality of images offered by High Definition
Television (minimal image resolution 1280x720 pixels is needed) [9,14]. Third, development of multi-band cooled imagers capable to employ spectral phenomenon as
an effective tool in both surveillance and measurement applications [4,3]. Fourth,
development of polarization-sensitive thermal imager to further improve the capabilities of cooled technology [2,8].
27
An increasingly noticeable trend appeared on the market to integrate thermal
thermal imagers with other imaging and non-imaging sensors. Such integrated
multi-sensor surveillance systems (thermal imager, TV camera, laser range finder)
have been used for quite a long time in airborne applications. Nowadays, however,
modern airborne imaging systems consist of more sensors: high resolution fourFOV thermal imager (or two thermal imagers), wide-FOV color TV camera, ultra
narrow FOV color TV camera, LLLTV camera, laser range finder, laser pointer,
laser designator, laser illuminator [14]. Next, ground portable thermal imagers are
more frequently integrated with additional modules like GPS, laser range finder,
goniometer, day light TV camera, and laser pointer. In some airborne, naval or
ground applications, thermal imagers are integrated with classical radars or millimeter-wave radars. In all cases, such integration significantly increases capabilities
of thermal imagers.
2.6 References
1. Baronti S. et al., Multispectral imaging system for the mapping of pigments in works of art by
use of principal-component analysis, Applied Optics, 37, 1299-1309 (1998).
2. Beekman Daniel W.; Van Anda James B, Polarization-sensitive QWIP thermal imager, Infrared
Detectors and Focal Plane Arrays VI Conference, SPIE Vol. 4028, 2000.
3. Bell W. Randy; Weber Paul G., Multispectral Thermal Imager: overview, Algorithms for
Multispectral, Hyperspectral, and Ultraspectral Imagery VII Conference, SPIE Vol. 4381,
2001.
4. Breiter Rainer et al; Portable sequential multicolor thermal imager based on a MCT 384x288
focal plane array, Infrared Technology and Applications XXVII Conference, SPIE Vol. 4369,
2001.
5. Campana Stehen B. ed., The Infrared & Electro-Optical Systems Handbook, Vol. 5: Passive
Electro-Optical Systems , Chapt. 1 Infrared Line Scanning Systems , SPIE (1993).
6. Campana Stehen B. ed., The Infrared & Electro-Optical Systems Handbook, Vol. 5: Passive
Electro-Optical Systems , Chapt. 2 Forward Looking Infrared Systems, SPIE (1993).
7. Campana Stehen B. ed., The Infrared & Electro-Optical Systems Handbook, Vol. 5: Passive
Electro-Optical Systems , Chapt. 3 Staring Sensor Systems, SPIE (1993).
8. Cocle Olivier; Rannou Christophe; Forestier Bertrand; Jougla Paul; Bois Philippe F. , QWIP
compact thermal imager: Catherine-XP and its evolution, Infrared Technology and Applications XXXIII Conference, SPIE Vol 6542, 2007.
9. Dahlberg Anders G. M., High-resolution QWIP thermal imager for AFV upgrade, Infrared
Technology and Applications XXX Conference, SPIE Vol. 5406, 2004.
10. Holst Gerald C., Common Sense Approach to Thermal Imaging, SPIE Vol: PM86, 2000.
11. Kaplan Herbert, Practical Applications of Infrared Thermal Sensing and Imaging Equipment,
SPIE Vol: TT75, 2007.
12. Kruse Paul W., Uncooled Thermal Imaging Arrays, Systems, and Applications, SPIE Vol.
TT51, 2001.
13. Manning Paul A. et al., Silicon foundry microbolometers: the route to the mass-market
thermal imager, Infrared Technology and Applications XXX Conference, SPIE Vol. 5406,
2006.
14. Star Safire HD QWIP thermal imaging equipment - operator manual, FLIR Inc., P/N
4100070, 2006.
28
3 Parameters of thermal imagers
Thermal imagers generate images that can be seen by humans and it is possible
to evaluate a thermal imager using human sight. However, it is surprisingly difficult even for an expert to precisely evaluate thermal imagers only by looking on images of typical scenery. Measurement of a series of parameters is needed in order to
accurately evaluate tested thermal imagers.
Parameters are quantitative physical measures of thermal imagers. The measurement is typically done in laboratory conditions but generally parameters
of thermal imager enable an expert to predict how this imager will perform under
real observation conditions.
Characterization of thermal imagers
is relatively well standardized
[1,2,15,18,19,27]. There exists also a numerous literature on a subject of testing
thermal imagers [3,9,12,13,14,17,21,23,25,26,31]. On the basis of the mentioned
above literature, parameters that describe performance of thermal cameras can be,
in general, divided into eight groups:
1. Subjective image quality parameters .
2. Response parameters .
3. Noise parameters .
4. Image resolution parameters .
5. Geometric parameters .
6. Accuracy parameters .
7. Spectral parameters .
8. Operation parameters .
Parameters
of thermal imagers
Subjective
quality
Geometric
Image
resolution
Response
Accuracy
Noise
Spectral
Fig. 3.1. Division of parameters of thermal imagers.
Subjective image quality parameters give information about ability of the system: thermal camera – human observer to detect, recognize, and identify targets
at different scenarios.
Response parameters give information about response of the thermal camera
to variable size or variable temperature targets.
29
Noise parameters - about noise that limits camera sensitivity detecting low contrast targets.
Image resolution parameters carry out information about camera ability to perceive small details of high contrast images.
Geometric parameters give information about geometrical relations between
the target and its image.
Accuracy parameters give information about accuracy of non-contact temperature measurement using thermal cameras.
Operational parameters provide information about position of the observed target or position of human eye necessary for proper operation of the camera.
Finally, spectral parameters provide information about camera responsivity
versus wavelength.
Subjective image quality parameters, response parameters, noise parameters,
image resolution parameters, and geometric parameters give us general information
about performance of thermal cameras in surveillance applications. Accuracy parameters are vital to evaluate thermal cameras for measurement applications. Operational parameters provide information about some practical aspects of work with
both types of thermal cameras.
Table 3.1. Performance parameters of thermal cameras.
No Subjective image
quality parameters
1 MRTD (minimum
resolvable temperature difference)
2
3
4
5
6
Response parameters
Noise parameters Image resolution parameters
Responsivity function
NETD (noise
- Number of pixels (lines)
equivalent temper- - IFOV (instantaneous
ature difference)
field of view)
- DAS (detector angular
substance)
FPN (fixed pattern - MTF(modulation transnoise)
fer function)
MDTD(minimum
detectable temperature difference)
Auto MRTD
SiTF(signal transfer function)
- Dynamic range
- Saturation level
Non-uniformity
TOD (triangle orientation discrimination)
MTDP (minimum
temperature difference perceived)
SRF (slit response
function)
1/f noise
ATF (aperiodic
transfer function)
3D noise model
- measurement
spatial
(nine components) resolution
- imaging spatial resolution
NPSD (noise
subjective
parameters
power spectral
based on resolution tardensity)
gets
30
- CTF (contrast transfer
function)
- EIFOV (effective instantaneous field of view)
- limiting resolution
PVF (point visibility
factor)
No Accuracy parameters
1
“accuracy”
(Minimal Error)
2
NETD – Noise
Equivalent Temperature Difference (Noise Generated Error)
3
Temperature stability
4
Slit Response
Function
5
Geometric parameters
Field of view
Operational
parameters
Focus range
Magnification
Eye distance
Distortion
Diopter settings
Spectral parameters
Spectral sensitivity function
Image rotation
Boresight alignment
Attention: there is no correlations between parameters from different groups having
the same number. Numbering was used only to make easier identification of different
parameters.
Accuracy parameters are necessary to evaluate commercial thermal cameras to
be used as non-contact thermometers. They are useless in case of thermal imagers to
be used in surveillance applications.
Measurement of operational parameters of thermal cameras does not differ significantly from a measurement of the same parameters of other visual imaging systems. There is the same situation in case of spectral parameters. Therefore both operational parameters and spectral parameters will not be discussed here.
3.1 Subjective image quality parameters
Thermal cameras are imaging systems used to enhance human ability to see
in darkness and poor visibility conditions. Parameters of subjective image quality
perceived by humans are considered as the most important parameters of surveillance thermal cameras from the point of view of the user who wants to have
the highest ranges of detection, recognition and identification of targets of interest.
MRTD is a measure of ability to detect and recognize targets on a non-uniform
background. MDTD is a measure of human ability to detect targets on uniform
background.
The real targets of interest are usually located on non-uniform backgrounds
and MRTD is considered as the most important measure of surveillance (often military) thermal cameras.
3.1.1 MRTD
The MRTD is a subjective parameter that describes ability of the imager-human
system for detection of low contrast details of the observed object. It is a function
of a minimum temperature difference between the bars of the standard 4-bar target
and the background required to resolve the thermal image of the bars by an observer
versus spatial frequency of the target.
31
Generally, MRTD is measured by determining the minimum temperature difference between the bars of the standard 4-bar target and the background required to
resolve the thermal image of the bars by an observer for 4-bar targets of different
dimensions (spatial frequency). The measurement results of an exemplary long
range military thermal camera are shown in Fig. 3.4.
Fig. 3.2. Image of five 4-bar targets of different spatial frequency at the same
temperature difference.
a)
b)
Fig. 3.3. Image of 4-bar target at two different temperature differences.
32
100
MFOV
MRTD [ C]
WFOV
10
NFOV
1
0.1
0.01
0
2
4
6
8
10
12
spatial frequency [lp/mrad]
Fig. 3.4. MRTD of exemplary thermal camera of three different field of view.
Classical MRTD is a subjective parameter that takes the observer into account.
This subjectivity and time consuming measurements cannot be accepted in high
volume production environment where, so-called, AutoMRTD is preferred.
AutoMRTD is a test methodology that proposes a quick objective method to
measure MRTD of a thermal camera using an algorithm presented below.
1. Measure MRTD, NETD (noise equivalent temperature difference)
and MTF (modulation transfer function) of a large sample of thermal cameras.
2. Calculate average MRTD, NETD, MTF for the tested sample cameras.
3. Next, calculate the coefficient function K(ν) as
K =
MRTD⋅MTF
NETD
(3.1)
4. Calculate new objective MRTD of any new tested thermal camera using
the following formula:
MRTD auto =
K ⋅NETD
MTF
(3.2)
In order to determine objective MRTDauto it is required to measure only two
objective parameters: NETD (noise equivalent temperature difference) and MTF
(modulation transfer function). Measurement of both MTF and NETD is fast and
semi-automatic. Therefore the measurement time needed to determine objective
MRTDauto is much shorter than the time needed to measure the classical subjective
MRTD. However, because determination of K(ν) requires testing of many thermal
cameras (at least 20–30) then the objective MRTDauto can be determined only in
33
case of large production lines. In case of typical tests of small quantities of
different thermal imagers only classical subjective MRTD can be measured.
Nowadays classical MRTD is considered as the most important parameter
of thermal imagers and MRTD is typically used for range predictions for real
targets. However, it was reported many times that the MRTD concept, when
applied to undersampled imagers, generates incorrect range predictions; particularly
detection range. The biggest problem is low accuracy of performance modeling
over Nyquist frequency.
There are at least three competing solutions to eliminate the mentioned above
limitation of MRTD concept and to improve accuracy of range prediction.
The DMRT (Dynamic MRTD) is an MRTD variation method that assumes that
the bar pattern is moved relative to the sampling lattice with optimum speed (about
¼ pixel per frame). This measurement way enable for human eye to integrate over
various phase positions of the 4-bar target and the the target is perceived at spatial
frequencies significantly higher than Nyquist frequency. However, this artificial
movement of the target during measurement creates conditions that are drastically
different than conditions during static observation. Dependence of the test
procedure (movement speed) on sensor characteristics is another big drawback
of the DMRT method.
There are however two real rivals of classical MRTD as the figure of merit
of thermal imagers.
Triangle Orientation Discrimination (TOD) threshold as an alternative to MRTD
method to characterize performance of thermal imagers [3]. The TOD method
proposes to use a series of triangle targets for characterization of thermal imagers.
Fig. 3.5. Image of a triangle target during testing thermal imager using TOD method.
The TOD method has a number of theoretical and practical advantages over
the MRTD method. The method is based on an improved test pattern, a welldefined observer task, a solid psychophysical measurement procedure, and generates more accurate and more comparable results from different measuring teams
than in case of classical MRTD. It is also possible to convert TOD measurement
results to MRTD characteristics. However mathematical conversion algorithm is not
simple. Next, TOD method was invented several decades after introduction
of the MRTD concept. Further on, the classical MRTD test method has been
already implemented in several widely disseminated military standards. Therefore,
34
probability that the TOD method shall be widely accepted by international community is rather low in spite of potential advantages of this test method.
Minimum Temperature Difference Perceived (MTDP) parameter is a new figure
of merit to evaluate quality of modern undersampled thermal imagers [29]. MTDP
is a temperature difference at which four, three or two bars can be resolved
by an observer with the test pattern at the optimum phase position. Using MTDP
concept, imager performance over Nyquist frequency can be still analyzed
and a significant drawback of classical MRTD is eliminated. At the same time
MTDP uses much of MRTD concept (the same 4-bar target, the same test equipment) and it is easy for people familiar with MRTD concept to understand and accept MTDP concept. Next, MTDP concept was implemented in TRM3 - a well
know model for performance evaluation of thermal imagers [30]. Therefore MTDP
has a real chance to become in future the main figure of merit of thermal imagers
if gets support from any international standard.
Fig. 3.6. Image of a four bar target during MTDP measurement.
3.1.2 MDTD
The MDTD is a subjective parameter that describes ability of the imager-human
system for detection of small size targets. It is a function of a minimum temperature
difference between the circular target and the background required to detect the target by an observer versus inverse spatial size of the target.
The MDTD is measured by determining the minimum temperature difference
between the target and the background required to detect the thermal image of a target, for targets of different spatial dimensions.
Fig. 3.7. Images of two circular targets of different angular sizes
35
The measurement results of an exemplary thermal camera are shown in Fig.
3.8.
Field of view
MDTD [K]
100
20
10
13.3
5
3.3
1
0.1
0.01
0
5
10
15
20
25
30
inversed spatial size [1/mrad]
Fig. 3.8. MDTD of exemplary thermal camera.
3.1.3 Evaluation of ranges of effective surveillance
Detection, recognition and identification ranges of a target of interest are
the prime criterion for evaluation of most surveillance thermal cameras.
It is possible to measure directly detection, recognition, and identification ranges
of a target of interest and to evaluate the tested thermal camera on the basis
of the test results. However, it is a risky solution. The ranges vary with observation
conditions (atmosphere, background) and it is relatively easy to manipulate with
the detection, recognition and identification ranges at real conditions if the observation conditions are not very precisely specified. Next, it is difficult to compare test
results of different thermal cameras tested at different time periods and at different
observation conditions.
It is possible to calculate theoretically the detection, recognition, and identification ranges of any target (man, tank, truck) using simulation computer program
based on mathematical models of thermal cameras [22,30]. However, the safest way
to evaluate surveillance thermal cameras is to measure MRTD of this thermal imager and calculate the detection, recognition, and identification ranges of a standard
NATO target using methodology proposed by this standard: STANAG 4347, Definition of nominal static range performance for thermal imaging systems, 1995.
The standard defines precisely parameters of the standard target, standard atmospheric conditions and presents a way to calculate the detection, recognition
and identification ranges of the standard target on the basis of the MRTD function
36
of the tested thermal camera. Two well known computer models that enable calculations of performance ranges for thermal imagers (NVTherm or TRM3) use algorithms that can be treated as modified versions of the method proposed
by the STANAG 4347.
The detection, recognition, and identification ranges of the standard NATO target are potentially a good criterion to be used in requirements on surveillance
thermal imagers. It is apparently a good idea to present requirements on a surveillance thermal imager by presenting requirements on the performance ranges (Table
3.2). However, in order to calculate the performance ranges of a thermal imager
we must know its MRTD function. Therefore a more common way to specify requirements on surveillance thermal cameras is to present requirements on MRTD
characteristic in a form shown in Table 3.3.
Table 3.2. Exemplary requirements on surveillance thermal camera using a concept of
performance ranges.
Field of view
Wide field of view
Narrow field of view
Wide field of view
Narrow field of view
Detection range [km]
Good transmission (σ = 0.2)
Bad transmission (σ = 1)
2.7
2
7
3
Recognition range [km]
1.1
0.9
3.1
2
Table 3.3. Exemplary requirements for MRTD function of a long range surveillance
thermal camera.
Spatial frequency [mrad-1]
MRTD [°C]
field of view
wide (about 10°)
narrow (about 3°)
0.5
<0.1
1
<0.38
<0.1
1.5
<2
2
<0.18
3
<0.4
4
<1
5
<6
Attention: These are only exemplary MRTD values
To summarize, we can say that MRTD is the most important characteristic
of thermal cameras from the point of view of the user who wants to have the best
ranges of detection, recognition, and identification of targets of interest. Having
known MRTD functions of different thermal cameras we can calculate the ranges
of detection, recognition of the standard NATO target and compare their perform37
ance (only thermal cameras of almost the same field of view should be compared).
Therefore proper specifications of a thermal camera should specify precisely maximal values of MRTD function at a set of spatial frequencies. Then, the measured
MRTD values must be lower than the values in the specifications if the camera is to
pass the test.
Now, let us discuss the way to calculate the detection and recognition ranges on
the basis of the measured and known MRTD function of the tested thermal camera
using the recommendation from STANAG 4347. The summary of the recommendations is shown in Table 3.4.
Table 3.4. Target parameters, atmosphere conditions and resolution criteria specified in
the standard STANAG 4347.
Target
size
Atmosphere
Rectangle :
2.3×2.3 m
transmission law
temper- ∆To = 2 K (reature dif- lated to blackference body temperature of 288 K)
τ ( R) = e − σ R
R- distance in
km
σ - coefficient
σ - at good 0.2 km-1
atmospheric condition
σ - at limited atmospheric
condition
1 km-1
Resolution criteria
(according to 50%
probability)
detection 1 line
pair/target
recognition
3 line
pair/target
identifycation
6 line
pair/target
In details, the detection, recognition and identification ranges of the standard
NATO targets can be calculated using the below presented algorithm.
1. Convert MRTD characteristic into a new one by changing variable from
spatial frequency ν [mrad-1] to the range R [km] using the following formulas
-1
Ardent [km] = 2.3 ν [mrad ],
-1
Rec [km] = 2.3/3 ν [mrad ],
Rid [km] = 2.3/6 ν [mrad-1].
2. Calculate decrease in the initial temperature difference ∆T (it was assumed
that initial ∆To = 2 K) between the target and the background due to limited atmospheric transmission
−⋅R
T R= T 0⋅e
38
.
(3.3)
3. Determine the respective nominal static ranges as the intersections
of ∆T(R) and the converted MRTD functions.
Let us to practice using this algorithm by calculation of the detection ranges of
the standard NATO target using a thermal camera of MRTD function shown in Fig.
3.9. The calculation results are shown in Fig. 3.10 and we can conclude that the detection ranges are the following:
• 7.2 km at good atmospheric transmission,
• 2.8 km at limited atmospheric transmission.
Calculation of the recognition and identification ranges can be done in the same
manner.
2,5
MRTD [K]
2
1,5
1
0,5
0
0
1
2
3
4
5
ν [1/mrad]
Fig. 3.9. Original MRTD measurement results.
2,5
∆ Τ [Κ ]
2
1,5
1
0,5
0
0
2
4
6
8
10
R [km]
Fig. 3.10. Converted MRTD function (for detection range) and the functions ∆To[R] at different atmospheric conditions (rectangles – MRTD values, circle – ∆To[R] at
good transmission, triangles – ∆To[R] at bad transmission).
As we see algorithm provided by the STANAG 4347 enables to determine detection, recognition, and identification ranges of the standard target using the tested
39
thermal cameras by doing only several non-complicated mathematical operations.
The performance ranges of tested thermal camera in case of other targets of known
parameters (temperature difference and size of equivalent rectangle) can be also determined using the same algorithm. The calculations can be carried out even using a
simple calculator but can be speed up by using several available computer programs
optimized for the task of calculation of performance ranges of thermal cameras.
3.2 Response parameters
Response parameters give us information about system response to variable
temperature targets or to the variable size targets.
There are three commonly used response parameters of thermal cameras:
1. Responsivity function,
2. ATF (Aperiodic Transfer Function),
3. SRF (Slit Response Function).
Responsivity function is the system response to a large target of variable temperature. It provides information on gain, linearity, dynamic range and saturation
level. The signal transfer function (SiTF) is the linear part of the responsivity function.
Aperiodic transfer function (ATF) is defined as a normalized dependence of system response to a variable size square (circular) target. It provides information on
system ability to detect small targets.
Slit response function (SRF) is defined as a normalized dependence of system
response to a variable size slit target. It provides information on system ability to
detect long narrow targets.
3.2.1 Responsivity function
Responsivity function is a function of an output signal (screen luminance, or electrical signal) versus target temperature (absolute or relative) in case of a large, constant size target (Fig. 3.11, Fig. 3.12). It can be characterized by three digital parameters: SiTF, saturation level, and dynamic range that are determined on the basis
of measurement results of the responsivity function.
40
Sout
saturation level
SiTF
noise level
0
temperature
Fig. 3.11. Responsivity function of a DC coupled thermal camera.
Sout
saturation level
SiTF
0
0
temperature difference
Fig. 3.12. Responsivity function of a AC coupled thermal camera or DC coupled camera
with AGC (automatic gain control).
The responsivity function is usually S shaped.
The signal transfer function SiTF or the responsivity is the linear part of the responsivity function. It is calculated as tangent of the angle between linear part of the
responsivity function and the temperature axis (the slope of the linear part).
The saturation level is the upper part of the responsivity function.
Dynamic range is the ratio of the maximum measurable input signal and the minimum measurable input signal.
max imum measurable input signal
Dynamic Range =
(3.4)
min imum measurable input signal
41
The situation is rather unclear what are really these two measurable input signals. There are at least two different definitions of the dynamic range parameters
used in specifications of thermal cameras.
First, the dynamic range is defined as a ratio of temperature difference generating the output signal equal to 95% (or 90%, or 100%) of the saturation level value
to the temperature resolution of the tested camera. It is typically assumed that the
temperature resolution is equal to NETD of the tested camera.
ΔTs
dynamic range (1) =
NETD
where ts is temperature difference generating the signal that equals 95% (90% or
100% depending on literature source) of the saturation level.
Second, the dynamic range is defined as a ratio of the upper value to the lower
value of the temperature difference when the deviation between the response function RF(∆T) and its linear approximation is within specifications
∆ Th
dynamic range (2) =
∆ Tl
Sout
saturation level
x%
x%
0
∆ Tl
∆ Th
temperature
Fig.3.13. Determination of the dynamic range using the linearity range concept.
3.2.2 Aperiodic Transfer Function
Thermal camera can detect small targets of angular size smaller than its instantaneous-field-of-view (IFOV). The latter parameters is calculated as a detector
(single pixel) angular substance. The output signal generated by such a small size
target depends on the target area. For an ideal thermal camera, the signal is proportional to the target area when the target area is smaller than IFOV; the signal does
not depend on the target area when the target area is bigger than IFOV (Fig. 3.14).
42
Aperiodic transfer function (ATF) is the dependence of a normalized function
of the output signal (voltage, current, digital) on a variable size circular (square)
target. The difference between the ideal and real ATF is caused by the image blur
generated by optical and electronic systems. Therefore the target transfer function
(TTF) calculated as the ratio of the real ATF to the ideal ATF provides useful information about this phenomenon.
The point visibility factor (PVF) is a point of TTF function determined for the
conditions when the target area approaches zero. The PVF is also sometimes termed
the en squared energy (EE), or en squared power (EP) or blur efficiency.
ATF
1
ideal
real
IFOV
Area
Fig. 3.14. Ideal and real aperiodic transfer function (ATF).
TTF
1
PVF
ideal
real
IFOV
Fig. 3.15. Target transfer function.
43
Area
3.2.3 Slit Response Function
The SRF is defined as a function of the signal generated by a slit versus width
of the slit normalized to the signal generated by a very wide slit. The SRF can be
treated as one dimensional ATF.
SRF generally provides directly information on the system ability to detect long
narrow targets. The SRF function is used as a base to determine so called measurement resolution and imaging resolution. The latter parameters shall be discussed
later.
SRF
1.00
ideal
real
angle [mrad]
IFOV
Fig. 3.16. Slit Response Function.
3.3 Noise parameters
Noise is a phenomenon that can significantly decrease image quality and limit
system ability to detect low contrast targets. Noise parameters are very important
performance measures of thermal cameras.
Noise present in thermal images can be in general divided into two groups: temporal noise and spatial noise. The temporal noise refers to temporal variations
of the signals generated by detector pixels during observation of an uniform target:
variations of the signal in a single line for case of scanning cameras or frame to
frame variations of pixels signals for case of staring cameras. The spatial noise
refers to differences between the signals generated by different pixels during observation of an uniform target that does not change from frame to frame. Both types
of noise have its own noise power spectral density (NPSD).
Noise is a complex phenomenon, difficult for characterization. In general, we
can find in literature three different noise analysis approaches to characterize
the noise phenomenon present in thermal images:
1. Three dimensional noise model where the noise is divided into eight components. Visualization is in form of multi-dimensional images or numbers.
2. Noise phenomenon is characterized by a single parameter presented as
a number.
44
3. Noise phenomenon is characterized by four parameters presented in form
of numbers.
3.3.1 3D noise model
The 3D noise model is based on the concept of the Di directional averaging operators that allow the mathematical derivation of eight noise components from
the noise data set [8]. The operators average the data in the direction indicated by
the subscripts.
Let us assume that a sequence of images generated by the tested imager was
captured. Then, the captured data can be presented in form of 3D array NTVH (Fig.
3.17). The T-dimension represents time or the framing sequence. The H-dimension
and V-dimension give spatial information. In case of staring systems, m and n indicate the pixel location; in case of scanning systems, m refers to a pixel location
but n refer to time or sample number in a digitized analog signal. Names of each
components and information provided by each component are presented in Table
3.5. The noise components are calculated by converting the 3D array into a series of
2D or 1D arrays. The conversion formulas are presented in Table 3.6.
T
N
H
m
V
n
Fig. 3.17. Three dimensional noise model coordinate system: m-row number, n- column
number, N-frame number.
It is possible to get detail information about the nature of a noise phenomenon
by the analysis of a sequence of the images generated by the tested thermal camera
using the 3D noise model and this model is often used by manufactures of thermal
cameras. On the other hand, the 3D noise model due to long series of parameters is
complicated and this model is very rarely used by users of thermal cameras who
prefer simple solutions. Because of these customer demands for simplicity, even
manufacturers rarely publish data using the 3D noise model.
45
Table 3.5. Noise components of the 3-D noise model.
1
2
3
3D com- Number
Comments
ponent
of
elements
SVHT
m×n×N
SVH
each pixel is averaged
m×n
over N frames
SHT
each column is avern×N
aged over m pixels
4
SVT
m×N
each row is averaged
over n pixels
5
SV
m
6
SH
n
each row is averaged
over n pixels and N
frames
each column is averaged over m pixels and
N frames
7
ST
N
8
S
1
each frame is averaged
over m×n pixels
each frame is averaged
over m×n pixels and N
frames
Information
Random 3-D noise
2D spatial noise
temporal column noise (rain):
variations of mean column
brightness with time
temporal row noise (streaking): variations of mean row
brightness with time
spatial row noise: variations
of mean row brightness that
do not depend on time
spatial column noise: variations of
mean column
brightness that do not depend
on time
frame to frame brightness
variation (flicker)
average brightness of the
frames in the sequence
Table 3.6. Conversion formulas.
3D TVH array to 2D VH
array
N
∑
SVH (i, j ) =
STVH (i, j , k )
k
N
i can vary from 1 to n - horizontal
3D TVH to 2D TV array
SH ( j) =
N
m
k
i
∑∑
3D TVH array to 2D TH
array
m
S HT ( j , k ) =
i
STVH (i, j , k )
m
j can vary from 1 to m –
vertical
2D TV array to 1D V array
STVH (i, j , k )
m⋅ N
∑
SV (i) =
N
n
k
j
∑∑
46
n
SVT (i, k ) =
∑
j
STVH (i, j , k )
n
k can vary from 1 to N –
temporal
2D TH array to 1D T
STVH (i, j , k )
n⋅ N
3D TVH to a single number
3D TVH array to 2D TV
array
ST ( k ) =
m
n
i
j
∑∑
STVH (i, j , k )
n⋅ m
3.3.2 Single parameter approach
If we look into technical data offered by manufacturers of most thermal cameras
we find a parameter called “thermal sensitivity”, “thermal resolution”, “temperature
resolution” or “ NETD” that provide information about noise of the thermal camera.
The parameter mentioned above has different names but usually means noise equivalent temperature difference (NETD). The problem is that different definitions
and different measurement techniques of NETD are used in literature.
According to its classical definition, NETD is defined as the blackbody temperature difference between a target and its background required to produce a peak-signal-to-ems-noise ratio of unity at a suitable point in the output electrical channel.
This definition was developed at the time when all thermal cameras were the scanning thermal cameras. Although the definition does not state it clearly, NETD is
a metric of only high frequency temporal noise along the video line (Fig.3.18). Low
frequency temporal changes are corrected (Fig. 3.19) before the NETD measurement. Next, NETD typically gives no information about the spatial noise between
different video lines.
Fig.3.18. Signal profile of a video line.
Fig. 3.19. Signal profile of a video line after low frequency trends correction.
NETD can be calculated as
NETD = Vn ⋅ SiTF
47
(3.5)
where V is ems value of noise in the signal line, SiTF is the Signal Transfer Function
of the tested thermal camera. V can be presented in different signal units: digital
levels, volts, etc. However, as long as SiTF is expressed as a ratio of the same unit
divided by K, then NETD is calculated in Kelvin degrees.
As it was presented above, the situation with NETD parameter as a metric of
a noise phenomenon is relatively clear in case of scanning thermal cameras. It is
a measure of high frequency temporal noise in a single line.
Situation is much more complicated in case of array thermal cameras. Different
definitions of NETD are often used. NETD is still defined as a blackbody
temperature difference between a target and its background required to produce
a peak-signal-to-ems-noise ratio of unity. A sequence of images of uniform target
is typically used as raw data for NETD calculations. However, the difference
depends on the way how to calculate this ems noise.
NETD can be calculated in case of staring thermal cameras using different
methods.
First, ems noise can be calculated as a standard deviation of temporal variation
of a signal of a single pixel. NETD is now a measure of only temporal noise of a
single pixel.
Second, ems noise can be calculated as a standard deviation from temporal and
spatial variations of signals from a group of pixels. NETD is now a measure of
total noise (both temporal and spatial noise components).
Third, ems noise can be calculated as a standard deviation from temporal and
spatial variations of signals from a group of pixels but after correction of spatial
noise. NETD is now a measure of average temporal noise for a group of pixels.
Both three methods can be used with or without correction of low frequency
trends. This means that depending if we use the correction or not, then NETD can
be a measure of only high frequency noise or of a measure of full bandwidth noise.
To summarize, NETD can be treated as a useful metric of a noise phenomenon
but only if it is precisely known how it was measured; without this knowledge
NETD data can be very misleading. The differences in NETD values, get using different calculation methods, can be very significant. NETD measured using the first
method can be several times lower than NETD measured using the second method.
This situation is particularly drastic in a field non-cooled thermal cameras when
the total noise is typically a several times higher than its temporal component.
3.3.3 Four parameters approach
Noise phenomenon is too sophisticated to be precisely characterized by a single
parameter like NETD. Even if it is clearly defined how NETD was determined we
get too little information about the noise phenomenon. Two thermal cameras can
have the same NETD (defined using any of different methods presented earlier) but
a human eye will immediately notice big differences in images generated by these
thermal cameras. On the other hand, as it was stated earlier, 3D noise model, using
eight components for precise characterization of a noise phenomenon, is too soph48
isticated to be commonly accepted and used. It seems that in this situation a middle
way, when the noise is characterized by a set of three/four parameters, is an optimal
solution.
Four parameters approach is based on the assumption that the noise present in
images generated by thermal cameras can be generally divided into two groups:
temporal noise and spatial noise. Next, each group can be further divided into low
frequency noise and high frequency component.
Noise
Spatial noise
Temporal noise
Low frequency
temporal noise
(1/f noise)
Low frequency
spatial noise
(non-uniformity)
High frequency
temporal noise
(NETD)
High frequency
spatial noise
(FPN)
Fig. 3.20. Types of noise.
Temporal noise generates temporal variation of intensity of camera pixels even
when target radiation does not change in time.
Spatial noise generates spatial variations of intensity of camera pixels even in case
of uniform target filling the camera field of view.
Low frequency temporal noise generates slow temporal variations of intensity
of camera pixels. This noise component creates an effect called 1/f noise. The latter
component is noticeable if we capture and compare the images generated by the
camera, separated by a relatively long period of time (say at least a dozen or more
minutes). We can see in Fig.3.21 that some groups of pixels in the second
or the third frame are clearly darker or brighter in comparison to the first frame.
Fig.3.21. Images of uniform target captured at long intervals.
High frequency temporal noise generates fast temporal variations of the intensity
of camera pixels. If we refer to original interpretation of NETD in older scanning
thermal cameras then NETD can be considered as a measure of this high frequency
49
temporal component of the total noise. High frequency temporal component is
clearly noticeable if we capture and compare several neighbor images generated by
the tested thermal camera. We can see in Fig. 3.22 that the pixels intensity depends
on a frame number, in spite of the fact that they are neighbor frames and time intervals between them are very short (1/60 s in NTSC video system; or 1/50 s in PAL
video systems).
Fig. 3.22. Three neighbor images of uniform target generated by a thermal camera of
dominant high frequency temporal noise.
Low frequency spatial noise generates slow spatial variations of the intensity
of camera pixels. This noise component creates an effect that is called non-uniformity. If low frequency spatial noise component is significant then it is noticeable
if we capture and compare several neighbor images generated by the tested thermal
camera. We could notice, present in every frame, low frequency spatial trend that
does not depend on a frame number and the frames are almost identical (Fig. 3.23)
Fig. 3.23. Three neighbor images of uniform target generated by a thermal camera of
dominant low frequency spatial noise.
High frequency spatial noise generates fast spatial variations of the intensity
of camera pixels. This noise component creates an effect that is called Fixed Pattern Noise. If high frequency spatial noise component is strong then it should be
clearly noticeable if we capture and compare several neighbor images generated by
the tested camera. We could notice the high frequency spatial trend, present in
every frame, that does not depend on the frame number and the frames are almost
identical (Fig. 3.24).
50
Fig. 3.24. Three neighbor images of uniform target generated by a thermal camera of
dominant high frequency spatial noise.
It is usually considered that the frequency of 150 kHz for NTSC video
or 186 kHz for PAL video systems is the border between the high and the low frequency components. It is possible to separate low frequency temporal and spatial
components from the total noise using suitable low pass filter (or high pass filter)
in a video channel.
Another more convenient method to separate different noise components is to
capture a series of images generated by the tested thermal camera when its field
of view is filled by an uniform target. The captured data created 3D patio-temporal
array. It is possible then to calculate the measures of all four noise components by
carrying out the data filtering using low/high digital filters.
Calculation method of four noise components from 3D patio-temporal array
depends on answer on a question what is dominant type of noise of thermal camera:
ergodic noise or non-ergodic noise.
If the thermal camera is a source of ergodic noise then the detectors are
considered as statistically dependent noise sources. The same average ems will be
measured if the average is calculated from n different detectors, or the same ems
noise of the same detector is the measured n times. Then, ems noise can be
calculated as
σ =
s 2 + s22 + ... + sn2 ,
2
= 1
save
n
(3.6)
where si2 is the variance of noise from i-detector or from the same detector but
measured i time; n is the number of detectors or indicator how many times were recorded the data from the same detector.
If the thermal camera is non-ergodic then the detectors are considered as independent noise sources. Each detector is statistically a different noise source. Then
ems noise is calculated as
σ = save =
s1 + s2 + ... + sn
.
n
(3.7)
Scanning thermal cameras can be considered to some degree as ergodic systems.
Staring thermal cameras are usually non-ergodic systems. In order to simplify
51
the analysis let us assume that the tested camera is non-ergodic as staring thermal
cameras dominate the market. Anyway, the consequences of non-fulfilling this
assumption are not really significant because the differences between ems noise
values calculated using two presented earlier formulas are usually quite small
(below 2%).
Now, we will present the methods that can be used to measure all four noise
components.
1/f noise
1. Capturing several tens of group of frames separated by a long time interval. Each group is treated as a 3D noise array. There are n such 3D noise
arrays, where n is the number of captured groups of frames.
2. Averaging operation of frames within the each group. A group of frames
(3D noise array) is replaced by a single averaged frame. High frequency
temporal noise component is eliminated or at least reduced. New 3D array
is created that carried information only about low frequency temporal
noise.
3. Calculations of 1/f noise of a single pixel as a standard deviation of temporal variation of intensity of this pixel.
4. 1/f noise of an analyzed group of pixels (or the whole thermal image) is
calculated as an average of 1/f noise of all pixels included into the analyzed
group.
5. Calculated 1/f noise in digital level units is converted into the 1/f noise in
temperature units
1 / f noise [digital levels]
1 / f noise [° C] =
.
(3.8)
SiTF
6. 1/f noise can be also expressed as a percentage of average signal
of the analyzed area or as a percentage of NETD.
1/f noise component is noticeable only if we analyze temporal trends in frames
of a long video sequence; say at least a few minutes. The 1/f effect is not noticeable
in short video sequences. Generally 1/f noise creates an effect of slow variations
of brightness of pixels of images generated by thermal cameras. In other words,
the 1/f noise creates slow temporal changes of spatial noises: FPN and non-uniformity.
1/f noise has directly no influence on image quality perceived by a human observer. Therefore 1/f noise is typically omitted in noise analysis of thermal cameras
and this parameter is rarely measured. NETD, FPN, and non-uniformity are considered as a basic trio noise parameters and are commonly measured.
NETD
1. Capturing a short video sequence of thermal images generated by
the tested thermal imager (if the number of captured video frames is no
52
more than about one hundred we can assume that 1/f effect is negligible).
3D noise array is created.
2. NETD of a single pixel is calculated as a standard deviation of temporal
variation of intensity of this pixel with time.
3. NETD of an analyzed group of pixels (or the whole thermal image) is calculated as an average NETD of all pixels included in the analyzed group.
4. Calculated NETD in digital level units is converted to the NETD in temperature units
NETD [° C] =
NETD [digital levels]
SiTF
(3.9)
FPN
1. Capturing a short video sequence of thermal images generated by the tested
thermal imager.
2. Averaging operation of the captured frames. A group of frames is replaced
by a single frame (temporal noise component is eliminated or at least reduced).
3. High-pass frequency filtering operation on the average frame.
4. FPN of an analyzed area (or the whole thermal image) is calculated as
a standard deviation of spatial variation of intensity of different pixels
within the analyzed area.
5. Calculated FPN in digital level units is converted to the FPN in temperature units:
FPN [digital levels]
.
SiTF
6. FPN can be also expressed as a percentage of average intensity
of the analyzed area or as a percentage of NETD.
FPN [° C] =
(3.10)
Non-uniformity
1. Capturing a short video sequence of thermal images generated by the tested
thermal imager.
2. Averaging operation of the captured frames. A group of frames is replaced
by a single frame (temporal noise component is eliminated or at least reduced).
3. Low-pass frequency filtering operation on the average frame.
4. Non-uniformity NU of the analyzed area (or the whole thermal image) is
calculated as a standard deviation of spatial variation of intensity of different pixels within the analyzed area.
5. Calculated NU in digital level units is converted to the NU in temperature
units:
53
NU [° C] =
NU [digital levels]
.
SiTF
(3.11)
6. FPN can be also expressed as a percentage of average intensity of the analyzed area or as a percentage of NETD.
High frequency temporal noise expressed by NETD is usually a dominant noise
component in cooled thermal imagers. High frequency spatial noise expressed as
FPN is typically a dominant noise component in non-cooled staring thermal imagers. Low frequency spatial noise (non-uniformity) is typically much lower in
cooled thermal imagers than in non-cooled thermal imagers. Examples of possible
measurement results are shown in Table 3.7. Please note, however, that these are
only the examples and within each technology test results can vary significantly.
Next, measurements are usually done immediately after the imager internal calibration and therefore the non-uniformity measurement results are lower than during
real work.
Table 3.7. Examples of measurement results of noise components of different thermal
imagers.
Imager type
cooled scanning
cooled array
non-cooled array
NETD [°C]
0.1
1/f [°C]
0.04
FPN [°C]
0.07
NU [°C]
0.08
0.05
0.12
0.05
0.09
0.03
0.15
0.1
0.3
3.4 Image resolution parameters
Image resolution parameters carry out the information about imager ability to
perceive small details of high contrast images. There is a lot of confusions in literature in this area because many parameters are used to expressed this ability. Generally, parameters that represent thermal imagers ability to perceive small details
(resolution) can be in four groups:
1. Parameters based on basic specifications of the IR FPA module (number
of detectors, pixel dimensions) used in thermal imager.
2. MTF (modulation transfer function) and derivative parameters.
3. Parameters based on imager response to point sources or slit sources.
4. Parameters based on subjective human ability to resolve some patterns.
3.4.1 Parameters based on specifications of the IR FPA
Infrared focal plane arrays are hearts of thermal imagers. Therefore it is not
strange that some IR FPA parameters like number of detectors, number of lines, detector angular size parameters called IFOV or DAS) are often used to describe
performance of thermal imagers.
54
The first parameter is the total number of detectors of a two-dimensional IR FPA
sensor and it is used to describe resolution of staring thermal cameras.
The second parameter is the total number of vertical lines of a linear IR FPA.
This parameter is used to describe resolution of scanning thermal cameras.
IFOV (instantaneous field of view) or DAS (detector angular substance), in spite
of different names, are the same parameter defined as angular dimension of a single
pixel of the IR FPA used in the thermal camera
(3.12)
DAS [mrad]=a[µm]/f’[mm],
where a is the pixel linear dimension and f’ is the focal length of the optics. Please
note, however, that a pixel horizontal dimension can differ from a pixel vertical dimension. Therefore there can be a difference between a horizontal resolution,
and a vertical resolution of thermal cameras.
It is very easy to get these simple data about the IR FPA sensor and the optics
used in a thermal imager. Therefore not only manufacturers but also most
community involved in infrared technology like to express imager resolution using
parameter based on FPA sensor (Table 3.8).
Table 3.8. Specifications of exemplary IR FPAs and calculated resolution
of thermal cameras.
No FPA
1
2
3
4
Pixel
dimension
[µν]
320×256 HgCdTe 30×30 m
LWIR cooled
288×4
HgCdTe 28×25 m
LWIR cooled
640×512 HgCdTe 15×15 m
MWIR cooled
320×240
LWIR 45×45 m
non-cooled
Optics
focal
length
[mm]
50 mm
Number
of DAS
detectors/
Number
of
lines
81920 pixels 0.6 mrad
50 mm
288 lines
50 mm
0.56 mrad
(horizontal)
0.5 mrad (vertical)
327680 pixels 0.3 mrad
50 mm
76800 pixels
0.9
Resolution parameters based on FPA specifications can be misleading due to
different reasons.
There are cases when a thermal camera built using IR FPA sensor of smaller
pixel number can generate sharper image than a thermal camera built using
IR FPA sensor of higher detector number. This means that poor 640x480 pixel
staring thermal camera can produce worse image that good 320x240 pixel thermal
camera, although such a situation occurs rather rarely.
Next, when DAS is equal to x mrad, it does not mean that we will be able to
resolve 4-bar targets of bar width that equals x mrad. There can be cases when
55
we will not be able to resolve even 4-bar targets of bar width three times bigger
than the DAS.
Therefore the resolution parameters based on IR FPA specifications should be
treated as indicators of imager theoretical ability to resolve small details. More
pixels in FPA sensor mean that thermal cameras built using this sensor should
theoretically resolve smaller details. However, practically it is not always true.
The same is with DAS or IFOV parameters. Lower values of DAS (IFOV) are
welcome but they do not always indicate improvements in thermal camera ability
to resolve small details.
3.4.2 MTF and derivative parameters
MTF (modulation transfer function) is a function of the contrast of image
of a sine pattern at a given spatial frequency generated by the tested camera relative
to a contrast of an image of sine pattern at spatial frequency equal to zero. Spatial
frequency is typically measured per cycles (or line pairs) per a unit angle or a unit
length (in case of thermal cameras MTF in line pairs per millionaires [LP/mrad]
or in inverted millionaires [mrad-1])2 (see Fig.3.25).
sine pattern
θ
pattern cycle Tx
cycle angular
size θ
distance R
spatial frequency:
ν=1/θ
Fig.3.25. Graphical interpretation of spatial frequency.
Images of several sine patterns of different spatial frequency generated by
a thermal camera of MTF presented in Fig. 3.26 are shown in Table 3.9.
2
Attention: TV resolution is measured in line widths instead of pairs, where there are two line
widths per pair, over the total height of the display
56
MTF
1
0,9
0,8
0,7
0,6
0,5
0,4
0,3
0,2
0,1
0
0
2
4
6
8
10
spatial frequency [lp/mrad]
Fig. 3.26. Exemplary MTF.
Table 3.9. Images of sine patterns generated by a thermal camera of assumed MTF
function.
Frequency
[LP/mrad]
MTF
1
0.94
2
0.78
3
0.57
4
0.37
5
0.21
6
0.11
7
0.05
8
0.02
9
0.01
10
0.0
Original pattern
57
Image
From mathematical point of view MTF is defined as
MTF( ν ) = C(ν )/C(ν = 0) ,
(3.13)
where C(ν = 0) is the contrast of image of the sine pattern at near zero frequency.
The contrast of the image of the sine pattern is defined as
C (ν ) =
I max (ν ) − I min (ν )
,
I max (ν ) + I min (ν )
(3.14)
where
Max is the maximum intensity for a pattern of spatial frequency ν ("white peak")
and Min is the minimum intensity for a pattern of spatial frequency ν ("black valley").
The relationship between MTF function and contrast of a sine target creates
the possibility of determination of MTF by measurement of contrast of series
of sine targets of different spatial frequencies.
Measurement of MTF using sine targets is an oldest, classical MTF measurement technique. However, this measurement method is time consuming because
measurement of contrast must be done for a series of sine targets. At the same time
this method is also an expensive one, particularly in case of thermal cameras.
Manufacturing sine targets is difficult and costly even in case of visible targets
when a sine target is created by deposition of a layer of spatially variable transmittance over a transparent glass. It is technically possible to manufacture sine filters
for far infrared range but it is so difficult and costly technology that MTF of thermal
imagers is never measured using sine targets method.
Contrast transfer function (CTF) can be treated as a substitute of MTF that can
be measured using targets that are simpler to manufacture. CTF is defined in the
same way as MTF with an exception that a square wave pattern is used instead of
a sine wave pattern. The CTF values are usually higher than the MTF values.
The difference between MTF and CTF is usually not great. Next, it is much easier
to measure CTF than to measure MTF. Therefore, several decades ago CTF was
typically used instead of MTF to evaluate thermal cameras. However, nowadays
CTF is rarely measured because in present era of computer technology and image
processing MTF function can be easily measured by capturing images of some
standard targets and using mathematical apparatus of Fourier transform.
MTF can also be defined as the magnitude of a complex function Optical Transfer Function:
OTF(ν) = MTF(ν) exp (i PTF(ν)) ,
58
(3.15)
where OTF is Optical Transfer Function, MTF is Modulation Transfer Function,
and PTF is a function called Phase Transfer Function that represent the change in
phase position as a function of spatial frequency3.
A perfect optical system would have MTF of unity at all spatial frequencies,
and PTF equal to 0 at all spatial frequencies. In case of real imaging systems, MTF
always decreases to zero at some spatial frequency. The shape of MTF function
gives precise information about imager ability to produce sharp images.
In most imaging systems PTF is not significant and therefore it is usually assumed
that OTF equals MTF. Therefore MTF, not OTF, is typically used as a measure of
quality of imaging systems.
Modern measurement methods of MTF of thermal imagers are based on relationships between MTF function and two other functions (LSF and ESF):
MTF(ν )=Magnitude {F[LSF(x)]},
(3.16)
MTF(ν )=Magnitude {F[derivative from ESP(x)]}
(3.17)
where F is the Fourier transform operator, LSF (line spread function) is one directional distribution of the flux in the image of an ideal line-like target, ESF (edge
spread function) is one directional distribution of flux in the image of an ideal
edge-like target.
Measurement of MTF of thermal imagers is usually carried out on the basis of
captured images of two types of targets: narrow slit target or edge target (Fig.
3.27). When an image of one of these targets is captured and digitized then later
MTF is calculated using formula (3.16) or formula (3.17). Practically measurement
of MTF is not as simple as formulas (3.16) and (3.17) suggest due to necessity to
use noise correction algorithm but these formulas present the principle of modern
measurement of MTF of thermal cameras.
a)
b)
Fig. 3.27. Images captured during MTF measurement a)image of a narrow slit target,
b)image of an edge target.
3
If case of a linear PTF, only simple lateral displacement of the image is observed. Non-linear
PTF can adversely affect image quality. An extreme case is a phase shift of 180º produces a
reversal of image contrast.
59
MTF function is an excellent criterion of image quality of thermal cameras.
However, interpretation of a curve is more complicated than interpretation of simple
numerical parameters. Next, graphical presentation of MTF function was difficult
several decades ago when computers were rarely used. Therefore several numerical parameters based on MTF function were proposed in the past to characterize
thermal cameras. Nowadays, these numerical parameters are rarely used but still it
is useful to know these five numerical parameters related to MTF function:
1. Equivalent frequency (equivalent line number or equivalent bandwidth) Ne,.
2. Half frequency HF,
3. Effective resolution ER,
4. Effective instantaneous field of view EIFOV,
5. Limiting resolution LR.
First, the equivalent frequency Ne is defined as
Ne =
∞
∫ MTF
2
(ν ) dν ,
(3.18)
0
where Ne is the equivalent frequency (called also equivalent line number or
equivalent bandwidth). Ne
is presented using spatial frequency units.
The equivalent frequency Ne concept is based on Shade criterion [24], who stated
that perceived image quality can be described using the formula (3.18).
Second, the effective resolution ER is defined as
ER =
1
.
2 ⋅ Ne
(3.19)
The effective resolution is presented using angle units (in case of thermal cameras
typically millionaires are used).
Third, experiments have shown that perceived image sharpness is closely related to the spatial frequency where MTF is 0.5. This means that the spatial frequency at which MTF drops to 0.5 can be a good indicator of imager quality. This
frequency is called the half frequency HF. It is expressed in spatial frequency units.
Fourth, the effective instantaneous field of view EIFOV is defined as
EIFOV =
1
,
2 ⋅ HF
(3.20)
EIFOV is presented in angle units (typically in millionaires).
Fifth, the limiting resolution is defined as spatial frequency at which MTF
equals from about 0.02 to 0.05. The definition is based on the fact that humans usually cannot distinguish high contrast sine pattern at frequencies where MTF drops
below the level 0.02−0.05. Exact value of the limiting MTF level depends on
the observer.
As we can see, determination of these five numerical parameters related to MTF
function is quite easy when the latter function is known. However, nowadays in era
60
of computer technology when it is easy to measure, present and store MTF function
it is better always to use MTF function as original data. The numerical parameters
listed earlier should be used only for comparisons of thermal cameras of different
MTF functions when we need to have a simple numerical criterion of comparison.
3.4.3 Parameters based on imager response to point/slit sources
There are three numerical parameters of image resolution that are based on
imager response to point/slit sources:
1. Point visibility factor PVF,
2. Measurement spatial resolution MSR,
3. Imaging spatial resolution ISR.
Point visibility factor PVF is defined as normalized centre pixel signal caused
by a point source. It is calculated as ratio of the centre pixel signal to the sum
of signals generated by the point source in both the centre pixel and the neighbor
pixels:
center pixel signal
PVF =
.
(3.21)
sum of all pixels
PVF can be determined using the four step algorithm presented below:
1. Capture an image of a uniform background (Frame 1).
100
100
100
100
100
100
100
100
100
100
100
100
100
100
100
100
100
100
100
100
100
100
100
100
100
Fig. 3.28. Exemplary signal distribution of uniform background image.
2. Capture an image of a point source on the uniform background (Frame 2).
100
100
100
100
100
100
108
130
109
100
100
130
210
128
100
100
120
131
109
100
100
100
100
100
100
Fig. 3.29. Exemplary signal distribution of point source image.
3. Calculate a new frame as the difference of Frame 1 and the Frame 2.
0
0
0
0
0
0
8
30
20
0
0
30
110
31
0
0
9
28
9
0
0
0
0
0
0
Fig. 3.30. Signal distribution after background frame removal
61
4. Calculate PVF using the formula (3.21). 4
Both the measurement spatial resolution MSR and the imaging spatial resolution ISR are Slit Response Function related parameters. The measurement spatial
resolution MSR is defined as angular slit dimension for which Slit Response Function (SRF) of the tested thermal camera is equal to 0.99. The imaging spatial resolution ISR is defined as angular slit dimension for which the Slit Response Function
(SRF) of the tested thermal camera is equal to 0.5.
SRF
1.00
0.99
ideal
real
0.50
ISR
IFOV
MSR
angle [mrad]
Fig. 3.31. Graphical definitions of MSR and ISR.
The imaging spatial resolution (ISR) is typically found among the parameters
of older scanning thermal cameras. ISR is a good measure of camera ability to create a thermal image of small targets. However, this parameter does not give information whether the size of the tested object is high enough to assure negligible influence of this size on measurement results during non-contact temperature measurement. The information is provided by the measurement spatial resolution (MSR).
When angular size of the tested object is higher than the measurement spatial resolution, then we can assume that influence of the size of this object on the temperature measurement results is negligible. We can say in other words that if the angular
size of the tested objects varies, but is always higher than MSR, then the output
temperature will be the same. However, the MSR is usually a few times higher than
ISR and manufacturers often prefer to present only the values of the second parameter.
3.4.4 Subjective parameters based on resolution targets
There are myriads of resolution patterns developed during last century to measure
resolution of optical instruments, and later to measure resolution of image
intensifier systems or television cameras. The USAF 1951 target, the EIA
4
In the presented above exemplary case we get PVF=0.4.
62
Resolution Chart 1956, the NBA 1963A Resolution Target can be considered as the
most popular targets from this group. These resolution patterns can be potentially
also used to characterize resolution of thermal cameras. However, there are some
technical problems that make difficult direct use of commercially available
resolution targets.
Typical resolution targets offered on the market [32] are manufactured using
two techniques: a) translucent targets (chrome pattern on glass substrate),
b) opaque targets (printed black pattern on mylar/high quality paper).
The problems is that typical glass substrate does not transmit in spectral bands
of thermal imagers. Next, emissivity of printed patterns can be similar to emissivity
of the mylar/paper. These reasons create a situation when thermal cameras do not
see typical resolution targets and such targets cannot be used for testing thermal
cameras.
A new type of USAF 1951 targets was recently introduced on commercial
market: so called “the Clear Optical Path USAF target”[32]. Such targets are
manufactured from an extremely thin electroformed nickel substrate. Since there is
no glass in the pattern area, light travels only through air, eliminating chromatic
and absorption issues and can be potentially used for testing thermal imagers.
However, the targets are characterized by too low emissivity (about 0.7-0.8) in
comparison to typical IR targets of emissivity over 9.96. Next, the reflectivity
of such targets is not very high (about 0.7-0.8) and the targets absorb radiation
emitted by the blackbody located behind the target in systems for testing thermal
imagers. This radiation can change temperature distribution on the surface of the
new type USAF 1951 target. Because of these reasons the "Clear Optical Path
USAF targets" should not be used for MRTD measurement of thermal cameras.
However, these targets can be used for relative comparison of resolution of different
surveillance thermal cameras.
3.5 Accuracy parameters
So far we have discussed parameters useful for testing and evaluation of surveillance thermal cameras. In case of this type of thermal cameras, image quality is
the most important figure of merit. However, in case of measurement (commercial)
thermal cameras high quality thermal image is useful but accuracy of non-contact
measurement of temperature is more important.
There are two types of errors of a temperature measurement with thermal cameras: the external errors and the intrinsic errors [4]. Here, we will present parameters
of measurement thermal cameras that describe camera performance when
only the intrinsic errors are present. Such a situation occurs when emissivity
of the tested object is close to unity and a distance camera-object is short. Then,
the external errors due to unknown emissivity, reflected radiation and limited atmospheric transmittance can be treated as negligible.
Manufactures of measurement thermal cameras often state a parameter called
“accuracy” that is measured as a range around the true object temperature Tob in
63
which the output temperature Tout is located when the external sources of errors are
negligible. Typical values of this parameters are: ±1% of the output temperature Tout
but not less than ±1 °C for scanning thermal cameras, or ±2% of the output temperature Tout but not less than ±2 °C for staring thermal cameras.
The term “accuracy”, according to the international metrological organizations, is
only a qualitative concept that should not be associated with numbers [11]. Therefore the name “accuracy” is improper for formal metrological terminology. However, there are more serious limitations of usefulness of the "accuracy" parameter.
The “accuracy” parameter could potentially enable determination of the intrinsic
uncertainty of a measurement thermal camera. Assuming a uniform distribution dispersion of a true temperature within the limits, determined by the “accuracy” parameter, we can write [10]
intrisic accuracy=
accuracy
3
.
(3.22)
However, practically the “accuracy” parameter is not useful for estimation of the intrinsic uncertainty of measurement thermal cameras because the conditions in
which the “accuracy” is measured are not typically clearly defined by manufactures.
The question is whether the “accuracy” is measured at optimal calibration conditions when the measurement errors are the smallest or it is measured at real measurement conditions when the errors can be many times higher.
Manufacturers state very rarely at what ambient temperature the “accuracy” was
measured. However, typical practice is that the “accuracy” is measured at laboratory conditions when ambient temperature is equal to about 23°C.
During real measurements, the environment temperature can vary significantly
within wide limits from about −20 °C to about 40°C. Changes of the environment
temperature can have significant effect on the measurement results due to several
reasons. First, radiation emitted by the optical elements of the camera depends directly on temperature of these elements and indirectly on temperature of the environment. Second, variation of the environment temperature can cause variation
of the detector temperature. Third, changes of the environment temperature cause
direct changes of the temperature of the electronic blocks and indirect changes
of the gain and the offset of these blocks.
Influence of the environment temperature on the measurement results can be
corrected. Modern thermal cameras are equipped with software and hardware that
should automatically correct this influence. However, only a partial correction
of this harmful influence is possible. Therefore accuracy of measurements carried
out in real measurement conditions can differ significantly from accuracy obtained
in laboratory conditions.
There are also several parameters presented in the catalogs of measurement
thermal cameras that give some indications about intrinsic errors of thermal cameras: thermal sensitivity, IFOV, and rarely MRTD or MDTD.
64
Thermal sensitivity called also “thermal resolution”, “temperature resolution”
or “ NETD” that provides information about the influence of noise in electrical
channel on the measurement errors. It was shown in Ref. 6 that NETD equals the
standard deviation of the output temperature dispersion caused by noise of the system. Therefore, the NETD can be treated as a good estimation of uncertainties due
to system noise.
However, we must remember that the NETD depends on an object temperature. It is
typically measured only for one fixed value of this temperature usually close to
30°C and can be a few times higher for object temperatures at the lower limit
of available temperature range close to −20°C.
The instantaneous field of view IFOV is typically found among the parameters
of modern measurement thermal cameras. It is related to the minimum angular size
of the tested object for which influence of the size of the tested object on measurement results is still negligible. However, this minimum size depends also on a parameter of other blocks of the thermal camera like aberration of the optical block, diffraction effects, frequency bandwidth of the electrical channel and it is not possible
to determine this minimum size on the basis of the IFOV only.
Manufactures of measurement thermal cameras present also MRTD or MDTD
functions or values of MRTD/MDTD functions measured for a case of large targets
(low spatial frequency).
If the thermal camera is only to be used for non-contact temperature measurement
on surfaces of the tested objects, then MRTD and MDTD parameters are practically useless because it is impossible to connect these parameters with the measurement errors of the thermal camera. However, MRTD and MDTD can be useful figure of merits if the cameras are to be used in non-destructive thermal testing
(SAARS testing that can be treated as a part of NDTT technology). Image quality is
then as important as the accuracy of temperature indications [5,7].
If the information provided by manufacturer is not enough and want to get more
knowledge about possible performance of a measurement thermal camera then it
is recommended to measure a set of four parameters:
1. Minimal error ME.
2. Noise generated error NGE.
3. Temperature stability TS.
4. Measurement spatial resolution MSR.
As it was discussed in Ref. 4 this set of four parameters is sufficient for characterization of measurement thermal cameras.
The minimum error ME is defined as a range around the output temperature Tout
in which the true temperature Tob is located when the measurements are carried out
in the conditions identical with the conditions during calibration of the thermal
camera. The calibration conditions exist when the tested object is a sufficiently
large blackbody, the distance between the tested object and the thermal camera is
short in order to have negligible influence of limited transmittance of the atmosphere, environment temperature is of typical laboratory range 18°C−25°C, the ob65
ject is located in the center of the system field of view, measurements are carried
out for the shortest temperature span of the thermal camera, and averaging the effect
of a dozen or more of measurement results is used. Practically, the minimal error
ME is an equivalent of the “accuracy” parameters presented in data sheets of measurement thermal cameras.
15
∆Τ [Χ]
10
5
0
-5
-10
-50
50
150
250
350
450
Tbb [C]
Fig. 3.32. Exemplary measurement error ME of several thermal cameras (squares –
camera 1, triangles – camera 2, circles– camera 3, plus signs – limits according
to “accuracy” parameter.
The noise generated error NGE is defined as the standard deviation of the output
temperature dispersion caused by the system noise. As it was shown in Ref. 6, NGE
equals NETD in case of typical thermal cameras (systems of single spectral band).
NGE theoretically decreases with an object temperature. Practically, as we can see
in Fig. 3.33 it does not always occur due to different reasons. One of them are neutral filters used to extend camera temperature measurement range that cause significant suppression of the signal coming to the detectors and increase in NGE (NETD)
value.
The temperature stability TS is defined as a range in which the results of measurements, carried out at different environment temperatures, are located. As we see
in Fig. 3.34 this parameter can provide crucial information to estimate ability
of tested thermal camera to carry out accurate temperature measurement at real environmental conditions.
66
0,9
0,8
NGE
[ C]
0,7
0,6
0,5
0,4
0,3
0,2
0,1
0
-20
80
180
280
380
T bb [C]
∆Τ [Κ]
Fig. 3.33. Exemplary NGE measurement results of several thermal cameras.
30
25
20
15
10
5
0
-5
-10
-15
0
10
20
T[°C]
30
40
50
Fig. 3.34. Exemplary temperature stability TS of several thermal cameras (the errors of
temperature measurement ∆T of a blackbody of the temperature Tbb = 90°C with
a few thermal cameras at different temperatures of the environment T).
The measurement spatial resolution MSR is defined as the minimum angular
dimension of the tested object when there is still no influence of limited size of this
object on temperature measurement results. The MSR parameter is typically
measured as the angular slit dimension when the slit response function SRF equals
0.99.
67
1,2
1
STRF
0,8
0,6
0,4
0,2
0
0
1
2
3
4
5
6
7
8
9
10
α [mrad]
Fig. 3.35. Slit Temperature Response Functions of two exemplary thermal cameras.
As we can see in Fig. 3.35, there can be big differences between measurement
resolution MSR of different measurement thermal cameras present on the market.
MSR of the first thermal camera shown in Fig. 3.35 equals 3.5 mrad in situation
when the MSR of the second camera equals 10 mrad. The first thermal camera can
be used for accurate temperature measurement of the targets of size as small as
3.5 mrad, the second- as small as 10 mrad. Therefore is always recommended to
carefully check MSR value of a measurement thermal camera before trying to make
measurement of temperature of small targets.
3.6 Summary
Over forty parameters of thermal imagers were presented in this chapter.
The task of measurement of all these parameters is a very time consuming task even
in case of a single thermal imager. Fortunately, probability that a reader of this book
will be forced to measure all the parameters presented in Table 3.1 is low, even
if the reader is a test professional. Most people actively involved in testing thermal
imagers do not even know definitions and test methods of most parameters
of thermal imagers shown in Table 3.1. The list of parameters commonly measured
during tests of thermal imagers is much shorter than list of parameters discussed in
this chapter due to several reasons.
First, MRTD gives information about both temperature sensitivity of tested
thermal imagers and about its spatial resolution. At the same time MRTD is
the only parameter of thermal imagers presented in several internationally
recognized test standards. Therefore, there are some test teams that limits tests
of surveillance thermal imagers to measurement of only this parameter. Other
subjective image quality parameters like MDTD, TOD, MDTP are measured rarely.
68
Second, measurements of response parameters are typically limited to
measurement of SiTF parameter because it is the only response parameter that is
needed to carry out measurement of important noise parameters.
Third, nine components of 3D noise model give the most detail information
about noise present in images generated by tested thermal imagers. However,
the concept of 3D noise model is not simple and the information provided by this
parameter is not easy for interpretation. Therefore almost all users of thermal
imagers and majority of manufacturer test teams prefer measurement of more
simple parameters like NETD, FPN, non-uniformity.
Fourth, a long series of image resolution parameters are MTF related
parameters. If MTF function is measured we can determine almost all other image
resolution parameters. Therefore it is logical that the tests of thermal imagers are
typically limited to measurement of only MTF function.
Fifth, parameters used to characterize surveillance thermal imagers differ from
parameters used to characterize measurement thermal imagers. Therefore typical
test teams that specialize in testing surveillance thermal imagers do not need to
know definitions and test methods of parameters of measurement imagers like
accuracy, NGE, thermal stability, MSR.
Sixth, performance of thermal imagers do not depend significantly on spectral
parameters. At the same time these parameters do not typically vary with time.
Therefore the spectral parameters are only rarely measured by test teams
of manufacturers of thermal imagers; very rarely - by users of these imagers.
To summarize, detail knowledge about all parameters of thermal imagers
discussed in this chapter is not needed for both the users and the manufacturers
of thermal imagers. Optimal set of parameters to be measured depends on potential
use of measured parameters.
In case of users of surveillance thermal imagers the tests are generally carried
out to verify potential performance of tested imagers. Due to direct relationship
of MRTD parameter and ranges of effective surveillance the tests are often limited
to measurement of this parameter. For manufacturers of thermal imagers the aim
of the tests is not only to verify performance of the imagers but also to find weak
spots of the tested imager that could be potentially improved. At the same time such
tests should be carried out with high speed due to time restriction of typical
production line. Therefore MRTD measurement is done only for sample imagers in
situation when measurement of MTF, NETD, FPN, non uniformity, FOV is carried
out at production line.
In case of both surveillance thermal imagers and measurement thermal imagers
three different test levels can be proposed: basic, typical, expanded (Table 3.10).
The basic test level can be recommended for users of thermal imagers who are
beginners to this technology and are looking for simple methods to verify quality
of thermal imagers they purchased or to be purchased.
69
Table 3.10. Recommended sets of parameters of thermal imagers.
Type
thermal
imagers
of Test level
Surveillance
imagers
Recommended set of parameters
Basic
MRTD
Typical
MRTD, MTF, SiTF, NETD, FPN, non-uniformity,
distortion, FOV
Expanded
MRTD (or Auto MRTD), MDTD, MTF, responsivity
function, NETD, FPN, non-uniformity, distortion,
FOV, 3D noise, NPSD, PVF
Basic
Measurement
Typical
imagers
Expanded
Minimum Error (“accuracy”)
Minimum Error (“accuracy”), NGE, SRF, MRTD
Minimum Error (“accuracy”), NGE, SRF, MRTD,
temperature stability
The typical test level is recommended for more advanced users of thermal
imagers who want to have detail information about thermal imagers due to different
reasons. One of such typical reasons is the possibility of estimation of
performance deterioration of tested thermal imagers in order to predict their life
time and to create optimal plan of repairing these imagers.
The typical test level is also recommended for manufacturers of thermal imagers
who are looking for a test system needed both to verify final quality
of manufactured imagers and to get information needed to optimize manufacturing
of thermal imagers at production line.
The expanded test level is recommended generally for advanced manufacturers
(or R&D) teams who want to get very detail information about tested thermal
imagers in order to make design improvements. This test level is particularly
recommended if the tested imager is to be used not only for classical surveillance
task (surveillance using human observers) but also as a module of automatic target
recognition system.
3.7 References
1. ASTM standard E 1213-2002 “Standard Test Method for Minimum Resolvable Temperature
Difference for Thermal Imaging Systems”
2. ASTM standard E 1311-99 “Standard Test Method for Minimum Detectable Temperature Difference for Thermal Imaging Systems”
3. Bijl Piet, Valeton J, Guidelines for accurate TOD measurement, Infrared Imaging Systems:
Design, Analysis, Modeling, and Testing X, SPIE Vol. 3701, 14-25, 1999.
4. Chrzanowski K., Evaluation of commercial thermal cameras in quality systems, Optical Engineering, Vol. 41, No. 10 (2002)
70
5. Chrzanowski K., Park S.N., Evaluation of Thermal Imagers For Non-Destructive Thermal Testing Applications, Infrared Physics and Technology, 42 (2) 101-105 (2001).
6. Chrzanowski K., Szulim M., A measure of influence of detector noise on temperature measurement accuracy with IR systems, Applied Optics, 37, 5051-5057 (1998).
7. Chrzanowski, J. Fischer, W. Wrona, Testing of Thermal Imagers For Non-Destructive Thermal
Testing Applications, ASTM Journal of Testing and Evaluation, 28, 395-402 (2000).
8. D'Agostiono, Webb C., 3-D Analysis Framework and measurement methodology for infrared
systems noise, Infrared Imaging Systems: Design, Analysis, Modeling and Testing, SPIE
Vol. 1448, 110-121, 1991.
9. Driggers Ronald G, Van A. Hodgkin, Vollmerhausen Richard H., O'Shea Patrick , Minimum
resolvable temperature difference measurements on undersampled imagers, Proc. SPIE Vol.
5076 Infrared Imaging Systems: Design, Analysis, Modeling, and Testing XIV; 2003.
10. Guide to the expression of uncertainty in measurement, International Organisation for
Standarisation-International Electrotechnical Commission-International Organisation of Legal
Metrology-International Bureau of Weights and Measures, TAG 4/WG 3, 1993.
11. International Vocabulary of Basic and General Terms in Metrology, International Organisation for Standarisation, 1993.
12. Holst G.C., Infrared Imaging System Testing, Vol.4, Chapt. 4 in The Infrared & Electro-Optical Systems Handbook, Michael C. Dudzik ed, SPIE 1993..
13. Holst G.C., Testing and evaluation of infrared imaging systems, JCD Publishing Company
1993
14. Holst G.C., The Infrared & Electro-Optical Systems Handbook, Vol.3: Electro-Optical System
Design, Analysis, and Testing, Chapt. 4, pp. 206-207, SPIE (1993).
15. ISO 15529, Principles of measurement of modulation transfer function (MTF) of sampled
imaging systems, 1999
16. Jaccobs E., Dynamic MRTD simulation, Infrared Imaging Systems: Design, Analysis, Modeling, and Testing XI, SPIE Vol. 4030, pp.70-76, 2000.
17. Lloyd J., The Infrared & Electro-Optical Systems Handbook, Vol.3: Electro-Optical System
Design, Analysis, and Testing, Chapt. 1,SPIE (1993).
18 MIL-I-24698(SH), Infrared thermal imaging systems, Department of Defense USA (1988).
19. MIL-STD-1859: Thermal Imaging Devices, Performance Parameters Of, 1983.
20. MIL-T-49381 Test Set, Thermal sight TS-3681/VSG, USAERADCOM (1980)
21. Miller Scott J., Backer Brian S., Kohin Margaret, Alonso Pascual, Whitwam Jason T. , Test
methods and technology for uncooled imaging systems, Infrared Imaging Systems: Design,
Analysis, Modeling, and Testing XV,SPIE Vol. 5407, 30-37, 2004.
22.Night Vision Thermal Imaging Systems Performance Model, User’s Manual & Reference
Guide, U.S Army Night Vision and Electronic Sensors Directorate, AMSEL-RD-NV-MSSPMD, 2001.
23. Pieper R., Cooper A., Celik M., Kenter Y., Objective MRTD experimental measurements
compared with predictions based on the visibility model, Infrared Imaging Systems: Design,
Analysis, Modeling, and Testing XIV, SPIE Vol. 5076, p. 196-207, 2003.
24. Schade O. (1948). Electro-optical parameters of television systems. 1. parameters of vision
and visual systems. RCA Review, 9: 5-37.
25. Sousk S., O'Shea P., Van Hodgkin A., Measurement of uncooled thermal imager noise, Infrared Imaging Systems: Design, Analysis, Modeling, and Testing XVI, SPIE Vol. 5784, 301308, 2005
26 Sousk S., O'Shea P., Van Hodgkin A., Uncertainties in the minimum resolvable temperature
difference measurement, Infrared Imaging Systems: Design, Analysis, Modeling, and Testing
XV, SPIE Vol. 5407, p. 1-7, 2004.
71
27. STANAG 4349, Measurement of minimum resolvable thermal difference (MRTD) of thermal
cameras, 1995.
28. Webb C., Holst G., Observer variables in minimum-resolvable temperature difference, Infrared Imaging Systems: Design, Analysis, Modeling, and Testing III, SPIE Vol. 1689, 1992.
29. Wittenstein W., Minimum temperature difference perceived—a new approach to assess undersampled thermal imagers, Opt. Eng., Vol. 38, 773, 1999.
30. Wittenstein W., Thermal range model TRM3, Infrared Technology and Applications XXIV,
SPIE, Vol. 3436, p. 413-424, 1998.
31. Wood L., Laboratory Bench Analysis of Thermal Imaging Systems, Opt. Eng., 15, G193G197 (1976).
32. www.edmundoptics.com
72
4 Test equipment
Some information about structure and requirements on equipment for testing
thermal imagers can be found in international standards that regulate testing thermal
imagers [1,2, 17,19]. However, real value of this information is rather limited due to
small size of these standards, lack of many important details, some out-dated recommendations. More useful information can be found in some specialized literature sources like Refs. 10,11. However, the most valuable information about test
equipment can be get from analysis of real test systems offered by manufacturers
of equipment for testing thermal imagers [24,26,29,30,32]. Here in this chapter conclusions from such an analysis are presented. Due to limitations in information access most detail technical information refers directly to test equipment from a single
manufacturer: Inframet [30]. However, there are no basic differences in test systems
from different manufacturers; only minor technical details. All properly working
test systems, independently of the manufacturer, should generate the same measurement results. Therefore the information about equipment for testing thermal imagers presented in this chapter should be generally valid for all test systems available on international market.
4.1 Types of test systems
The task of a test system for testing thermal imagers is to generate images
of some standard static targets of precisely known shape, dimensions and temperature. These images can be projected to the tested thermal imager by the test system
or viewed directly by the tested imager. In both cases the tested imager generates
distorted copies of the original targets images. Next, the images generated by
the tested imagers are evaluated and important characteristics of the tested imagers
are determined.
a)
b)
c)
d)
Fig. 4.1. Images of standard targets used during testing thermal imagers a)4-bar target,
b)pinhole target, c)edge target d)slit target.
Technically we can formulate four basic requirements on a test system for testing thermal imagers:
1. Ability to simulate targets of different geometrical shape (needed to
measure different parameters of thermal imagers),
2. Ability to regulate precisely angular size of simulated targets (in order to
simulate changes of distance at real conditions),
73
3. Ability to regulate precisely temperature difference of the simulated target
in comparison to background temperature (needed in order to simulate
variable contrast of thermal targets at real observation conditions),
4. Ability to simulate targets located at distance bigger than minimal focus
distance of the tested imager (typical work conditions).
The requirements mentioned above can be fulfilled by several types test systems
built using three different test principles:
1. variable target test systems (Fig. 4.2, Fig. 4.3),
2. variable distance test systems (Fig. 4.4,Fig. 4.5, Fig. 4.8),
3. variable target/distance test system (Fig. 4.6, Fig. 4.7).
The variable target test systems(Fig. 4.2, Fig. 4.3) project images of targets
fixed to a rotary wheel using an reflective collimator as an image projector. The
tested thermal imager is located at the output of IR collimator and the target is located at the collimator input (the focal plane). The distance between the target
and the tested imagers is very short. The distance is typically no more than about
4 meters if we analize the optical ray way and the distance is usually not within
the focusing range of typical surveillance thermal imagers. However, due to use
of the collimator as an image projector the imager “sees” the target as a very long
distance object that is within imager focusing range. Next, a series of targets is
fixed to rotary wheel. By rotating the wheel it is possible to exchange quickly targets. By changing target dimensions the changes of distance are simulated.
IR collimator
Optical table
Tested
imager
frame
grabber
rotary wheel
black
body
target plates
PC
controller
software
Fig. 4.2. Diagram of the variable target test system (image projector).
74
Fig. 4.3. Photo of the DT 1500 variable target test system (courtesy of Inframet www.inframet.com)
The variable distance test systems (Fig. 4.4,Fig. 4.5) generate a thermal image
at the plane of the target fixed to a large area blackbody. The tested thermal imager
sees this image directly and generates a distorted copy of the image generated by
the test system. Because the variable distance systems do not use a collimator during the tests then the distance between the target of the test system and the tested
imager must be long enough to have the measuring system within the focusing
range of the tested imager. This means that the test system must be always located
at distances longer than the minimal focus distance of the tested imager. In case of
surveillance thermal imagers the latter value vary from about 5 m to about 50 m.
This means that the tests cannot be carried in small rooms but should be carried out
in the field or at indoor conditions using long corridors.
The size of the targets simulated by variable distance test systems must be big
enough to enable simulation of big objects ( low spatial frequency 4-bar targets)
when the distance test system-tested imager is equal to minimal focus distance of
the tested imager. Practically this means that due to long distance between tested
imager and the test system (from about 5 m to about 50 m) large area blackbodies
and large IR targets (sizes over 200 mm in most cases) are needed for variable distance test systems. Therefore both blackbodies and targets used for variable distance test systems are several times bigger than blackbodies/targets needed for typical variable target test systems (sizes between about 50 mm to 100 mm).
75
distance
target
Tested
imager
black
body
shield box
frame
grabber
PC
controller
Fig. 4.4. Diagram of the variable distance measuring system.
Fig. 4.5. Photo of the LAFT mobile variable distance test system (courtesy of Inframet
www.inframet.com).
The variable target/distance test systems (Fig. 4.6, Fig. 4.7) are practically the
variable target test systems without an IR collimator to project a thermal image generated by a set: target/blackbody. Because there is no collimator and the generated
thermal image must be seen directly by the tested thermal imager then the distance
tested imager - test system must be bigger than minimal focus distance of the tested
imager. At the same time typical commercially available rotary wheels are adapted
to use target of small size (typical diameter about 50 mm) and the distance targetimager must be short if typical imager is to "see" small details of the target. This
creates situation when only thermal imagers of short minimal focus distance can be
tested using the variable target/distance test systems. Commercial thermal imagers
are designed for observation of short distance targets (minimal focus distance is
typically about 0.5m) and such imagers can always be tested using the discussed
group of test systems. However, most surveillance (military type) imagers design
for observation of long distance targets cannot not be tested using the variable target/distance test systems due to much longer minimal focus distance (typically over
5m). When the distance imager-target is over the minimal focus distance of the imager then we cannot carry out parameters of measurement procedures that require
simulation of big targets.
76
Rotary wheel
distance
targets
Tested
imager
Blackbody
Shield box
Controller
PC
Fig. 4.6. Diagram of the variable target/distance measuring system.
Fig. 4.7. Photo of the SAFT variable target/distance measuring system.
All three types of earlier presented types of test systems posses some advantages
and disadvantages.
The variable target test systems (or variable target projectors) of configuration
shown in Fig. 4.2 can be considered as classical systems for testing thermal imagers. Due to high thermal inertia, use of baffles in the collimator, motorized rotary
wheel, and the fact that they are mostly used in laboratory conditions they are characterized by very good stability and measurement accuracy.
Any thermal imager is able to focus on optical infinity distance simulated by
the collimator. Therefore all types of thermal imagers (surveillance or commercial,
short distance of long distance) can be tested using these test systems (on condition
that the aperture of the imager optics is smaller then output aperture of the collimator). Big size of these systems (mostly due to the use a collimator) is main drawback of the variable target test systems. Even in case of smaller collimators it is difficult to use such a test system outside laboratory due transport problems and necessity to align tested imager with the collimator output.
77
The variable distance test systems of configuration shown in Fig. 4.4 represent a class of test systems of much more compact design than in case of variable target systems. Collimators and rotary wheels are eliminated. Because of small size
and mass these systems are excellent measuring tools at field/depot applications
when number of parameters to be measured is limited. They can be packed in
a large suitcase and easily transported to any location. Therefore, these test systems
are very good tool for comparison of quality of different thermal imagers offered by
different manufacturers. Next, it is possible to test thermal imagers from some distance, and as a consequence, the thermal imager can be tested without removing it
from the mechanical carrier (tank or helicopter). Further on, several thermal imagers can be tested at the same time using a variable distance test system (Fig. 4.8).
Another advantage of variable distance systems is the fact that there is no limitation on aperture of the tested cameras (in case of the previously discussed group
(image projectors) the aperture of the tested thermal camera must be at least about
10% smaller than aperture of the IR collimator).
Fig. 4.8. Concept of group testing using variable distance test system.
Low offset phenomenon is another big advantage of variable target test systems.
In case of variable target test systems it was is possible to measure directly targets
temperature because the targets are movable parts. Only indirect temperature measurement methods are possible. This indirect temperature measurement method is
one of the biggest source of creating the so called "offset" of blackbody indication
of differential temperature. In case of variable distance test systems the target temperature can be measured directly or at least the temperature sensor has a very good
thermal contact with the target plate. Therefore the offset of variable distance test
systems is much smaller than in case of variable target test systems. Next, the offset
is more stable if measurements are done at relatively stable ambient temperature
(the system is not exposed to sun, wind, ambient temperature changes are slow).
78
There are also several serious disadvantages of variable distance test systems.
First, large blackbodies and large targets and needed. This makes speed of regulation of blackbody temperature significantly lower than in case of smaller blackbodies used by variable target test systems. There also technical problems to assure required high thermal uniformity and temporal stability of bigger blackbodies.
Second, large rooms or corridors are needed if the tests are to be carried out in indoor conditions. It is not so easy to find a 50-m long corridor that is sometimes
needed to test a surveillance thermal imager. Third, the test system requires some
kind of protection against environmental condition (wind, rain, sun) if they are to be
used at outdoor conditions. Fourth, expanded tests (measurement of a long series of
parameters) of thermal imagers can be done using the variable distance test systems
but the test procedures are not as user friendly as in case of the variable target test
systems.
The variable target/distance test systems represent a mixture of two earlier
presented test concepts.
Their main advantage is lower costs and lower mass due to elimination of the collimator in comparison to variable target test systems. The disadvantage is the fact
that the systems can be used only for testing thermal imager of very short minimal
focus range like typical commercial (measurement) thermal imagers.
Summary comparison of the presented three groups of test systems for testing
thermal imagers is presented in Table 4.1.
Table 4.1. Comparison of different types of test systems.
Variable target test
systems
Design
IR collimator, rotary
structu- wheel, small blackbody,
re
set of small IR targets,
PC, frame grabber,
software
Advanta classical mature design,
ges
high
measurement
accuracy, all types of
thermal imagers can be
tested
Disdifficulties
to
use
advanta outside
laboratory,
ges
limitation on aperture of
optics of the tested
imager, high cost
Variable distance test
systems
large blackbody, set of
large targets, shield
box, portable PC,
frame
grabber,
software
compact
design,
possibility to use
outside laboratory, low
cost
Variable target/distance
test systems
rotary wheel, small
blackbody, set of small
IR targets, shield case,
PC, frame grabber,
software
lower cost than in case
of variable test system,
compact design
Large rooms/corridors suitable only for imagers
needed for indoor of short focus distance
application,
nonconvenient in case of
expanded tests
On the basis of earlier presented analysis of features of three different types of
test systems the recommendations on optimal application are presented in Table
4.2 .
79
Table 4.2. Recommended application area of different types of test systems.
Recommended applications
Variable test system
Variable
systems
distance
Not-recommended
applications
expanded
testing
of tests at field conditions
surveillance thermal imagers
at laboratory conditions
test Simplified tests of portable expanded
thermal cameras at indoor surveillance
conditions
using
long imagers
corridors
Simplified tests at field
conditions
Variable target/distance test tests
of
system
(commercial)
imagers
tests
of
thermal
measurement tests of long range
thermal surveillance imagers
4.2 Blocks of test system
First thermal imagers were designed for military applications to enable observation of long distance targets. Minimal focus distance of these imagers was often
more than 100 m. Therefore testing of such imagers was possible only using variable target test systems that used a collimator as an image projector. Now, due to
presence on the market of a large number of thermal imagers designed also for short
distance surveillance or for non-contact temperature measurement it is often possible to use other two types of test systems (variable distance systems or variable
target/distance systems) for testing modern thermal imagers. However, the classical variable target test system is typically the preferred choice. It can be estimated
that over 90% of systems used all over the world for testing thermal imagers are
variable test systems. At the same type the other two types of test systems can be
treated as simplified versions of the variable target test system. Therefore, from
now we will concentrate only on variable target test systems and will discuss in detail only blocks of these test systems.
The variable target test systems are built from the following blocks:
1 Collimator,
2 Blackbody,
3 Rotary wheel,
4 Set of targets,
5 PC,
6 Frame grabber,
7 Test software.
A set of the standard targets (metal sheets with holes) is fixed to the rotary wheel
placed at the focal plane of the collimator. One of the targets is within the field
80
of view of the collimator (we can call it the active target). The differential blackbody is located close behind this target. The temperature distribution on the target
surface and the blackbody is projected by the collimator to the tested thermal camera and image of the active target is generated by the tested imager. Next, the image
is evaluated by an observer or the image captured and analyzed with help of specialized hardware/software module.
4.2.1 Collimator
Collimators are typical elements of laboratory set-ups used for testing thermal
imaging systems. The function of the collimator is to generate a thermal image
closely resembling the thermal scene at the target plate located at collimator focal
plane.
4.2.1.1 Collimator structure
Reflective two mirror collimators built using an off-axis parabolic collimating
mirror and a smaller directional flat mirror represent a typical design of the collimator to be used in systems for testing thermal imagers. The reflective collimators
like the collimator of diagram shown in Fig. 4.9 dominate the market because of
several reasons:
1. Very high manufacturing costs of large size infrared refractive objectives
needed to built refractive collimators,
2. High polychromatic aberrations of the refractive collimators. Non-existence
of polychromatic aberrations in case of reflective collimators,
3. Wide spectral range of reflective collimators.
primary collimating
mirror
baffles
secondary
mirror
Focal plane
Fig. 4.9. Diagram of typical reflective off-axis collimator.
Mirrors used in reflective collimators are almost always front-surface mirrors of
configuration shown in Fig. 4.10 and the back-surface mirrors are excluded from
further discussion. The front-surface mirrors consist of three basic elements: substrate, reflective film and protective layer.
81
reflected
radiation
Protective layer
Reflective
coating
substrate material
Fig. 4.10. Front-surface mirror.
4.2.1.2 Requirements
The task of the collimator is to project with negligible distortion an image
of temperature distribution on the target plate located at the collimator focal plane
into direction of the tested thermal imager. The condition on negligible distortion
can be fulfilled only when certain requirements on four parameters of IR collimators:
1. Resolution,
2. Aperture,
3. Spectral range/transmittance
4. Thermal properties
are fulfilled.
A. Resolution
According to a popular myth the function of the collimator is to generate a parallel ray beam in direction of the tested imager. Practically, the collimator does not
generate a single parallel ray beam; it generates an infinite number of parallel ray
beams in different directions. The true task of the collimator is to generate
a thermal image closely resembling the temperature distribution at the target plate
located at collimator focal plane. In its ultimate form, an ideal collimator would be
capable of generating a radiation pattern that exactly reproduces the real temperature distribution of the target plate. However, such quality is unattainable. Instead,
a practical design condition should be adopted, based on the requirement that
the collimator spatial resolution should match the spatial resolution capabilities
of the tested thermal imager. We should remember that collimators of too low quality can become a source of significant measurement errors; collimators of too high
quality can unnecessarily increase cost of the test system.
Manufacturers of IR collimators use different ways to characterize performance
of these optical instruments and there is a confusion in area of evaluation methods.
First, accuracy of manufacturing of the collimating mirror is often presented as
a collimator parameter [35]. Values of proclaimed surface accuracy of mirrors used
to built IR collimators vary in quite wide range from about λ/2 to λ/12. However,
manufacturing accuracy of the mirrors is not very useful as criterion of overall quality of collimators for testing thermal imagers.
Generally, perfect mirrors do not necessary mean that the collimator generates
a perfect image. Very precise alignment of these two collimator mirrors is required
82
to obtain the maximal theoretically possible performance. Next, precision, zero
thermal-expansion optical and mechanical elements must be used in collimator
design. Further on, even small imperfections of mirrors coating or simply dust can
degrade quality of images projected by the collimator. Finally, we must remember
that the off axis parabolic mirrors are aberration free only at their focus point; not
for entire area of the target located at the focal plane. Practically this means that
information about mirror manufacturing accuracy does not give precision information about overall collimator performance. Practically, increasing manufacturing
accuracy of the collimating mirror does not always increases the collimator performance but always increases manufacturing costs of the collimator.
Second, collimator manufacturers often claim that the collimator is diffraction
limited [25,27,34]. This claim suggests that the collimator is perfect. Practically
such a claim can be very misleading.
Let us look on the diffraction limited target frequency values for typical collimators produced by a calculator available at a website of one of manufacturers of
equipment for testing thermal imagers [28].
Fig. 4.11. Window of a calculator of diffraction limits5.
The diffraction limits of several collimators calculated using this website calculator are shown in Table 4.3.
Table 4.3. Diffraction limited target frequency values (in lp/mrad) for collimator of different
optical apertures.
Aperture
Wavelength
5µm
12 µm
5
100 mm
150 mm
200 mm
250
300 mm
4.1
1.7
6.1
2.6
8.2
3.4
10.2
4.3
12.3
5.1
http://www.electro-optical.com/eoi_page.asp?h=Diffraction%20Limits
83
As we can see in Table 4.3 values of diffraction limited target frequencies of
typical collimators are low; actually very low. Table 4.3 suggests that resolution of
even big collimators (aperture about 250 mm) during tests of LW thermal imagers
is below 5 lp/mrad due to diffraction limit of the collimator. This means that using
typical off axis reflective collimators for projecting images of targets of frequencies
over 5 lp/mrad we should always get blurred images of these targets generated by
the tested LW thermal imagers. Such situation should occur even if the tested imagers is perfect because the collimator is the limiting factor. It is not true as the author of this book tested some long wavelength thermal imagers that generated
sharp images of targets of frequency over 10 lp/mrad; clearly over the suggested
diffraction limit of the collimators.
The situation described above is possible because the manufacturer [28] used to
calculate the values of limited target frequency νmax using the most pessimistic formula met in literature. The limited target frequency νmax is calculated generally using this formula:
ν
max [1/mrad] =
D[cm]
x ⋅ λ [μμm
(4.1)
where: D is the collimator aperture, λ is the wavelength, and x is the coefficient.
The manufacturer [28] used the coefficient x equal to 2x2.44= 4.88 in a situation
when it is possible to find literature sources where the x coefficient equals one.
Therefore the values of diffraction limited target frequencies presented in Table 4.3
are so low. The practical consequence of using formula (4.1) or the web calculator
[28] is very big relaxation of requirements on so called "diffraction limited" collimator. Even collimator built using poorly manufactured and poorly aligned mirrors
can be treated as so called "diffraction limited collimator".
As we can see defining collimator quality using the diffraction limit as a reference is a risky solution because the diffraction limits can be defined in different
ways. Next, this approach is also logically wrong. We must remember than collimator is always used as a module of a system. The tested thermal imagers is a module of the same system, too. Aperture of the tested imagers is always smaller than
the aperture of the collimator. This means that quality of the final image generated
by the tested thermal imager is degraded by imager aberration blur, imager diffraction blur and collimator aberration blur. Therefore resolution of the collimators used
in real test systems is truly limited only by aberration effects.
Third, interferometric methods are typically used for quality checking of mirrors. These methods are also sometimes used for aligning components of reflective off axis collimators and for characterization of overall collimator quality. In
opinion of the author of this book, the interferometric methods are useful during
aligning process but present misleading results when we want to evaluate overall
collimator quality. The data presented in this form: “wavefront accuracy of the collimator output= λ/8 at 630 nm” suggest a perfect collimator capable to project perfect images not only in infrared range but also in visible range. Practically this in84
formation is truly valid only in case of spot targets where the small spot is located
exactly at the collimator focus or in case of the center point of bigger test patterns.
In case of low F-number off-axis parabolic collimators image quality of projected
big targets or targets located outside the collimator focus can be much lower that the
interferometric data suggest.
To summarize, mirrors accuracy, diffraction blur or collimator wavefront accuracy should not be used as criteria of collimator quality. They all can be misleading parameters. These parameters should be treated as indicators of possible
collimator quality. However they are not the parameters that would give warranty
about quality of collimator at user hands. Collimators should be characterized using
a parameter called spatial resolution that depends on aberration blur and this parameter should be measured at final user facilities.
Such a precise condition on quality of IR collimator was proposed in Ref. 5.
The collimator spatial resolution νcol was defined as the frequency of the smallest
bar pattern projected by the collimator that the observer is able to recognize.
The resolution of the tested imager was defined as the Nyquist frequency νN that
determines thermal imager theoretical limit.
It was shown in Ref. 5 that to have collimator influence on degradation of image
generated by tested thermal imager negligible then the collimator resolution νcol
must be at least 5 times better than the thermal imager resolution νN
ν col ≥5⋅ν N .
(4.2)
The spatial resolution νN defined as Nyquist frequency of the thermal imager
can be calculated using data provided by the manufacturers using this formula
ν N [ mrad −1 ]=
N
,
2⋅FOV [ mrad ]
(4.3)
where N is the number of pixels in horizontal (or vertical) direction of FPA used
in imager design, FOV is imager field of view in horizontal (or vertical) direction.
The spatial resolution of the collimator νcol cannot be calculated but it can be
measured. It can be done using a measurement method that was proposed in Ref. 5.
The method is based on an idea to carry out measurement of collimator spatial resolution in visible spectral range because geometric aberrations of typical reflective
IR collimators do not change with a spectral range. It is also extremely important
that the measurements should be carried out not only when the resolution targets
located exactly in the collimator focus point but in several position located within
a circle around the focus point. It is suggested that the diameter of such the circle
should be at least 14 mm (the area wide enough for a typical multi-pattern target).
If such tests are carried out then we get information about real capabilities of tested
collimator to project high quality images.
85
Fig. 4.12. Multi-USAF 1951 target recommended for measurement of resolution of collimators.
Experiments carried out by the author of this book with infrared collimators
used in different test systems6 showed that the center spatial resolution of these collimators varied significantly from about 30 lp/mrad to over 300 lp/mrad. The reasons for this significant dispersion of resolution of infrared collimators are different:
aging processes, manufacturing errors of the mirrors, alignment errors, deterioration of coating properties, dust on mirror surfaces etc. Now, let us check if such
collimators can be used as important blocks of measuring systems for testing
thermal imagers. We can easily calculate the minimal acceptable collimator resolution using formula (4.2) and some basic data of several thermal imagers.
The calculation results are shown in Table 4.4. We can make two basic conclusions from the data presented in this table.
First, the requirements on spatial resolution of IR collimators significantly depend
on a field of view of the tested thermal imagers . The requirements are very low in
case of imagers working in wide field of view mode but they are many times higher in case of the same imagers working in narrow field of view mode.
Second, in case of testing short/medium range thermal imagers the collimators
of resolution at 25 lp/mrad can be considered as acceptable. Collimators of resolution about 50 lp/mrad enable to carry out tests of all short/medium range thermal
imagers and majority of long range thermal imagers. Please note that such collimators are acceptable even in case of LW IR imagers of very narrow FOV built using
very large optics (240 mm) like Thermovision 2000 (FLIR Inc). Reflective collimators of spatial resolution in the region 70-100 lp/mrad are recommended for testing long range imagers of very narrow field of view designed using very large optics and 640x480 (or higher) resolution FPA.
To summarize, we can say that manufacturing of collimators for testing
short/medium range thermal imagers of wide/medium field of view is relatively
easy; manufacturing good collimators for testing medium/long range thermal imagers of narrow field of view much more difficult as the required spatial resolution
6
Attention: The warranty period of most of the tested collimators expired but the collimators are
used usually many time over the warranty period.
86
of the collimator is several times higher. However, a real challenge in field of reflective collimators is not to design a collimator to be used for testing typical surveillance thermal imagers as listed in Table 4.4 but to design a collimator to be used
for testing space CCD cameras. The requirements on spatial resolution of collimators for testing such CCD cameras are at least five times higher than for collimators
to be used even for testing best thermal imagers. Design of collimators for testing
space imagers is a true technical art where many small details like type of mirror
mount are of utmost importance and there are special requirements on room where
the collimator is to be used. In case of collimators for testing thermal imagers
the situation is much easier but still it is always recommended for users of collimators to calculate required spatial resolution of the collimator using formula (4.2)
and to verify this condition by practical tests to be sure that the collimator projects
the images of proper quality during tests of thermal imagers.
Table 4.4. Requirements on spatial resolution νcol of IR collimators to be used in testing
different thermal imagers.
Thermal
imager
Elvir (Thales
Angenieux)
Thermovision 2000
(FLIR Inc)
Matiz long
range
(SAGEM)
Ultra 275C
(FLIR Inc)
TV camera
for
space
program
FOV
(HFOVxVFOV)
FOV: 8°x6°
(140mrad x105mrad)
WFOV: 25°x18°
(436x314 mrad)
MFOV: 6°x4.32°
(105x75.3mrad)
NFOV: 0.98°x0.71°
(17.1x12.4mrad)
WFOV: 6.53°x4°
(114x69.8mrad)
NFOV: 1.36°x0.91°
(23.7x15.9mrad)
WFOV: 18°x13°
(314x227mrad)
NFOV: 4°x2.89°
(69.8x50.4mrad)
320×256
νN [lp/mrad]
(horizontal)
1.14
Required
νcol [lp/mrad]
5.7
320×240
0.37
1.85
1.52
7.6
9.36
46.8
2.8
14
13.5
67.5
0.5
2.5
4.6
23
FPA
640×480
( microscanning)
320×240
FOV = 1.6°
70
4000 pixel
linear
CCD
detector,
HFOV- horizontal Field Of View VFOV – vertical Field Of View
87
0
B. Aperture/Focal length
Collimator aperture is the diameter of the maximal ray beam that can be generated by the collimator when a point source is used. It is strictly needed for proper
testing that a collimator aperture must be bigger than a diameter of the optics of
the tested thermal camera. It is recommended that the collimator aperture should
be at least 10% bigger than the diameter of the optics of the tested thermal camera.
If this condition is not fulfilled then additional errors of measurement of parameters
of thermal cameras are generated.
Diameters of optics used in modern thermal cameras varies greatly: from
10-30 mm diameter objectives typically used in commercial thermal cameras up to
200-250 mm diameter objectives used in some ultra long range surveillance
thermal cameras. Therefore only big collimators of apertures of about 300 mm can
be used for testing all thermal cameras available on the market. However, bigger
collimator means also more expensive, more bulky instrument. At the same time we
should remember that thermal cameras of optics diameter of over 130 mm are very
rarely met (no more than about 1% of the market, probably much less). We can
expect also some problems when testing thermal cameras of wide field of view with
small optics (like commercial thermal cameras) using big collimator of long focal
length.
Even the biggest targets can be small for the tested imager
and measurement of MRTD at low spatial frequency cannot be carried out. .
Therefore it seems that collimators of aperture of about 150-200 mm represent
an optimal choice. Such collimators enable testing almost all thermal cameras
available on the market. In case when test area is limited to cameras of small
aperture then smaller aperture collimators can be used (aperture of about 100mm).
F-number (ratio of focal length to aperture) of collimating mirrors used in IR
collimators vary from about 5 (low F-number collimators) to about 12 (high
F-number collimators). This means that focal length of collimators of the same
aperture but of different F-number will vary significantly. For example, in case of
150-mm aperture collimators of variable F-number from 5 to 12 the focal length
varies from 750 mm to 1800mm.
There are advantages and disadvantages of both types of the collimators. Low
F-number collimators are characterized by small size that enables to decrease
dimensions of the complete test system. However, thermal stability of low
F-number collimators is lower than in case of high F-number collimators. Next,
manufacturing mirror accuracy is usually better in case of high F-number mirrors.
However, the most important disadvantage of low F-number collimators are
significant geometrical aberrations that occur for off-axis spots (Fig. 4.13). This
means that they project a perfect image of a small spot 4-bar target located in
the center of a collimator field of view but an image of several 4-bar targets located
outside the center can be blurred.
88
1,4
1,2
aberration blur [mrad]
1
0,8
0,6
0,4
0,2
0
0
5
10
15
20
25
30
35
40
45
off-focus distance [mm]
Fig. 4.13. Aberration blur versus off axis distance for several reflective off axis collimators
of 150mm aperture and different F-number (F=5 - triangles down, F=6.6 squares, F=10 - triangles up)7.
To summarize, if small size and mass is important then low F-number
collimators of short focal length should be preferred. If high quality of the images
projected by the collimator in its entire field of view is important then high
F-number collimators of long focal length are recommended. However, in most
cases when the requirements on collimator spatial resolution are not high then both
low F-number collimators and high F-number collimators can project images
of sufficient quality and the test results get using both two types of collimators
are the same.
C. Spectral range/transmittance
IR collimator must projects thermal radiation emitted by the blackbody
and targets located in its focal plane at least within the spectral range of the tested
7
Aberration blur was calculated as a angular diameter of a rectangle detector getting 71% energy
of a ideal point source.
89
thermal imager. This means that spectral range of IR collimator must cover at least
two spectral bands used in thermal imaging: MWIR band (3-5 µm) and LWIR band
(8-14 µm); preferable also the third band: SWIR band (1-3 µm). Therefore we can
conclude that for testing thermal imagers we need collimators of a spectral range
that covers at least the region from 3 µm to 15 µm, preferably from 1 µm to 15 µm.
If the collimator is to be used also for testing visible imaging systems then
the collimator is required to project radiation in the spectral range from 0.4 µm to
15 µm.
Spectral range of the reflective collimators is determined by coatings
of the mirrors. Metallic coatings are typically used as reflective coatings in IR
mirrors. There are three types of most often used metallic coatings: aluminum,
silver and gold. All three types offer high reflectivity over about 95% in the spectral
range of interest: 1-15 µm. As it was discussed earlier all mentioned above coatings
need some kind of dielectric overcoat that arrests the oxidation process or improves
its mechanical properties.
Gold offers consistently very high reflectance (about 99%) from about 0.8 µm to
about 50 µm. . Silver offers slightly lower reflectance (about 97%) but broader
spectrum from 0.3 µm to over 20 µm. Aluminum coatings are characterized by
lower average reflectivity (about 95%) and a certain reflectivity drop in near
infrared. From the other point of view the aluminum coatings are characterized by
the best durability and the lowest costs. Additionally, reflectance of aluminum
coatings increases with a wavelength. Practically, there is only a slight difference
in 3-15 µm spectral region between aluminum mirrors or gold mirrors but only
in case of collimating mirrors, where a mirror surface is nearly perpendicular to
the incoming beam. Silver/gold coated flat mirrors working at about 45 deg angle
are characterized by much better reflectance than their aluminum equivalents,
particularly about 10 µm wavelength.
To summarize, several guidelines on coating of mirrors for IR collimators can
be formulated.
1. Aluminum coated primary collimating mirrors is the best option due to
high reflectance and very good durability.
2. Aluminum coated secondary flat mirrors are not a good choice due to
possible low reflectance of this coating at a wavelength of about 10 µm
when working at 45º angle. If the test area is limited to testing thermal
cameras then gold coating of the secondary mirror is the best option; if the
collimator is to be used to test both thermal imagers and visible/near
infrared cameras then protected silver coating for secondary flat mirror is
the best option due to nearly uniform high reflectance in both visible
and infrared range.
D. Mirror thermal properties
There are four materials that are most often used in mirrors fabrication: optical
crown glass, low-expansion borosilicate glass (LEBG), synthetic fused silica
and Zerodur.
90
The material for mirror fabrication should be chosen on the basis of four parameters: coefficient of thermal expansion, cosmetic surface accuracy, surface accuracy, and material cost.
Optical crown glass (often BK7 type) is an old and low cost material for mirrors. Crown glass has a relatively high coefficient of thermal expansion and is employed when thermal stability is not a critical factor. We must remember that mirror
surfaces can be distorted or even damaged when subjected to wide temperature
changes. Therefore low-thermal expansion substrate materials are critical to successful performance of imaging reflective optical systems to be used at different
ambient temperatures.
Low-expansion borosilicate glass (LEBG) known by the Corning brand name Pyrex - is well suited for high quality front-surface mirrors designed for low optical
deformation under thermal shock. Pyrex coefficient of thermal expansion is lower
than in case of optical crown glass.
Synthetic fused silica has a very low coefficient of thermal expansion. Fused
silica mirrors can be polished to extreme accuracies, thereby minimizing wavefront
distortion and scattering.
Zerodur is a unique glass-ceramic material whose thermal expansion is almost
zero. This stability is essential in diffraction limited systems where the optical figure must not vary under thermal changes.
Parameters of the described earlier materials used for mirrors substrates are
shown in Table 4.5. As we can see the best material for the substrate of mirrors
seems to be Zerodur due to negligible thermal expansion and ultra high surface accuracy. However, Zerodur is also the most expensive material of the four analyzed
materials. Surface mirrors accuracy at the level of over λ/12 is needed only in rare
applications of testing optics for space applications. In case of collimators for testing thermal imagers surface accuracy at the level of λ/8 can be considered as acceptable. Therefore we can conclude that if the collimator is to be used at highly
variable ambient temperature conditions (field conditions) then the collimators mirror should be made from Zerodur, or at least from Pyrex. In case of laboratory conditions when the ambient temperature is almost stable then all optical materials
mentioned earlier are acceptable, but due to lower cost mirrors made from Pyrex or
from optical crown glass should be preferred.
91
Table 4.5. Comparison of four materials used for mirror substrates
Material
Coefficient of Typical
thermal
cosmetic
surface
expansion/°C
quality
crown 10-5
80-50
Optical
glass
(commonly
BK7 type)
Pyrex
5 10-6
Synthetic fused 8 10-7
silica
Zerodur
4 10-7
Typical surface Cost
accuracy
λ/4-λ/12
low
60-40
60-40
λ/4 ÷λ/10
λ/10 ÷λ/20
60-40
up to λ/20
moderate
high/modera
te
high
4.2.2 Blackbody
Blackbody is an ideal body that completely absorbs whole radiant energy striking it and, therefore, appears perfectly black at all wavelengths. The radiation emitted by such a body when heated is referred to as blackbody radiation.
A perfect blackbody has an emissivity equal to unity. Emissivity of real technical
blackbodies is close to unity. There are generally two methods to design technical
blackbodies of emissivity nearly equal to unity.
First method is to manufacture a cavity in a block of material of high thermal conductivity (mostly metal alloys) and regulate temperature of this block using a heating/cooling element. Emissivity of cavity blackbodies is typically over 0.995 even
when emissivity of the cavity walls is much lower (about 0.5-0.8). Most medium,
or high temperature blackbodies are designed using the cavity concept. Typical
commercially available cavity blackbodies are characterized by relatively small
emitting aperture about 1 inch aperture and quite high temporal inertia.
Second method is to put a layer of high emissivity material over a flat metal element of regulated temperature. Some special black paints of emissivity equal to
0.97 are put over blackbody emitters. The latter elements are manufactured from
high conductivity metals (usually copper). It is possible to use the second method
to achieve bigger emitting apertures then using the first method. The blackbodies
designed using the second methods are called area blackbodies. The area blackbodies are also characterized by lower temporal inertia than the cavity blackbodies due
to smaller mass. However, due to lack of high emissivity coatings resistible to high
temperatures the area blackbodies can be used only at low temperatures (typically
the maximal temperature is no more than 400°C).
The emitting area of the blackbodies used in systems for testing thermal imagers
must be bigger than the target plates. This creates requirement that emitting area
must be typically at least equal to about 50 mm. Next, blackbody for the test systems should simulate objects of rather low temperature to simulate typical observa92
tion condition. Further on, both positive and negative temperature differences
(between the target and the blackbody) are needed during testing thermal imagers.
Because of these requirements thermoelectric area blackbodies dominate among
blackbodies used in systems for testing thermal imagers.
Thermoelectric area blackbody is an blackbody that uses Peltier element for temperature control of the emitting element. Peltier element (Peltier module) is a semiconductor-based electronic component that functions as a small heat pump. By applying a low voltage DC power source to a Peltier element (called also often
TEC(thermoelectric cooler because of its ability to cool) heat will be moved
through the element from one side to the other. One face of the element will be
cooled while the opposite face simultaneously is heated. Consequently, a thermoelectric element may be used for both heating and cooling by reversing the polarity
(changing the direction of the applied current). This ability makes TECs highly suitable for precise temperature control applications as well as where space limitations
and reliability are paramount. Due to ability to heat or cool relative to ambient temperature, the thermoelectric blackbodies are usually called differential blackbodies.
There are a few important advantages of differential blackbodies that made this
type of blackbodies an ideal choice for testing modern thermal imagers.
First, standard temperature range of differential blackbodies from about -25°C to
about +75°C overlaps the temperature range needed during tests of surveillance
thermal imagers. Second, it is possible by careful design to develop differential blackbodies of excellent temperature resolution (0.1 mK), stability (1 mK) and uniformity
(10 mK). Third, these blackbodies are characterized by low mass and low temporal
inertia in contrast to cavity blackbodies for the same temperature range (typically liquid based blackbodies or pipeline blackbodies). All these features created situation
when differential thermoelectric blackbodies are practically the only type of blackbodies used by manufacturers of professional test systems for testing surveillance
thermal imagers. Please note however, that the cavity blackbodies are frequently used
in testing accuracy of commercial thermal imagers to be used for non contact temperature measurements due to wider temperature range at high temperatures.
4.2.2.1 Design
Differential blackbodies to be used as components of test systems are offered by
different manufacturers [24,26,30,32,29]. Now we will discuss in details design
of a differential blackbody offered by one of manufacturers [30] but the conclusions
will be generally valid for all high performance differential blackbodies present on the
market.
The blackbodies offered on the commercial market are typically built from two
blocks: the radiator block and the controller block. The diagram of the radiator
block is shown in Fig. 4.14. As it can be seen this block is built from: the radiation
emitter, the Peltier element, two temperature sensors (the sensor of temperature
of the radiation emitter and the sensor of temperature of the front wall), the cooling
radiator integrated with the fans, the electronic module, and the block case.
93
A/D converter
in /out
to CTCB
PTR resistor
R/U converter
Peltier power supply
high emissivity
coating
high emissivity
coating
radiator
PTR resistor
closing
aperture
high reflectivity
coating
fans
isolator wall
emitter plate
hole for the external probe
Fig. 4.14. Construction of the radiator block.
The radiation emitter is manufactured as a sandwich of several metal plates
fixed together. The plates are manufactured from material of high thermal conductivity in order to achieve very good temperature uniformity on the surface
of the emitter. The front side of the emitter plate is painted using a special high
emissivity coating. This technique enables to achieve emissivity of the emitter plate
equal to 0.97±0.01. Emissivity of the emitter plate can be improved up to 0.985 using additionally so called the micro-cavities technique when an array of small micro-cavities is created in the surface of the emitter.
Two high quality platinum resistance thermometers (PRT resistors) are placed in
a hole drilled in the emitter plate and in the hole drilled in the front wall of the of
the RTCB radiator. The task of the second sensor is to measure the ambient temperature.
The PRT resistors are characterized by high linearity, temporal stability
and the high temperature coefficient α. Due to good thermal contact of the PRT
resistor with the emitter plate or with the front wall it is possible to measure accurately temperature of the emitter plate and temperature of the front wall (or further
of the rotary wheel when the wheel is connected to the radiator block). Because of
temporal inertia effect the measurement is typically done with frequency not higher than 1 Hz. Next, due to fixing of the PRT resistors in high thermal conductivity
94
material the influence of the effect of resistor self heating on its resistance is minimized. Further on, the emitter was placed inside a cavity made from low thermal
conductivity material in order to minimize influence of air random vortexes on
temperature distribution on the surface of the emitter
The back side of the emitter plate is closely attached to the Peltier thermo-element of temperature dependent on the applied voltage. It is possible to heat or cool
the emitter applying proper voltage. The other side of the Peltier thermoelement is
closely attached to the cooling radiator equipped with fans. The task of the cooling
radiator is to dissipative quickly the heat from the Peltier element.
Measurement of temperature of the emitter plate and temperature of the front wall
is done by measurement of temperature dependent resistance of the PRT resistors.
The resistance is converted to voltage using a resistance bridge made from resistors
of high linearity, temporal stability and temperature stability. Next, the output signal
is amplified using a low noise preamplifier with corrected temperature drift. Finally
the analogue voltage is converted to digital signal using 24-bit A/D converter and that
digital signal is sent to the controller.
The controller block consists of three basic modules: micro-controller no 1, micro-controller no 2, and power supply module.
RTCB
RS 232
microcontroller 1
Peltier termoelement
microcontroller 2
RS 232
screen
keyboard
power supply
module
Fig. 4.15. Block diagram of the controller block.
There are 3 basic functions of the micro-controller no 1. First, it enables communication with the radiator block, with PC computer through RS 232 port,
and with the micro-controller no 2. Second, the micro-controller no 1 converts values of the output voltage into values of temperature. Third, the micro-controller
no 1 controls, through the D/A converter, the voltage applied to the Peltier thermoelement in the radiator block.
The micro-controller no 2 controls the keyboard and enables the user to set the
required absolute or relative temperature. Next, the micro-controller 2 controls
the screen and enable visualization of current and required values of temperature
of the emitter plate, or the temperature difference between the emitter temperature
and the front wall temperature.
95
Task of the power supply module is to power the micro-controller 1 module,
the micro-controller 2 module and the Peltier thermoelement and analog electronic
module of the radiator block.
a)
b)
Fig. 4.16. Photo of the TCB-2D blackbody a) RTCB radiator block b) CTCB controller
block (courtesy of Inframet).
The main task of the controller is to control and stabilize absolute or differential
temperature of the emitter in the radiator block. Stabilization is a temperature control process of the emitter with aim of achieving its stable temperature equal to
the value set by the user. Temperature control of the emitter plate is done via precision control of the voltage applied to the Peltier element.
The easiest way to shorten time necessary to achieve the stable temperature
of the emitter plate is to decrease thermal capacity of the emitter plate. However,
lower thermal capacity means also lower thermal uniformity of the emitter
and therefore the only reasonable way to shorten stabilization time is to optimize
control algorithm of the voltage applied to Peltier element. Classical PID (proportional-integral-derivative) algorithm can be used for this voltage control. However
due to its low speed a combination of DMC (Dynamic Matrix Control) and PID algorithm is used often in controllers of differential blackbodies. All data required
by these algorithms are determined on the basis of statistical analysis of measurement results obtained during experimental trials.
Before the blackbody can work properly it must be calibrated. Calibration
of the blackbody is a process when the relationships between temperature
of the sensors and output voltages generated by the temperature sensors are determined. The calibration process is carried out using an external temperature probe inserted to a hole in the emitter plate close to the temperature sensors. High quality
certified external temperature meter of temperature resolution 1 mK and stability
2 mK (or better) is used during calibration.
96
The relationship between temperature and voltage is typically determined at at
least 10 temperature points. Later the measurement data is interpolated using a high
degree polynomial and the calibration function is generated in a form of a table. Values of the calibration table are saved in EPROM memory what enables easy editing
during cyclic recalibration.
Practically all blackbodies offered for testing thermal imagers can be at least optionally controlled from PC via RS232 port or USB2.0 port. This way of communication between the PC and the blackbody is more convenient than using controller keyboard as the user has at his disposal a large keyboard, a mouse and a monitor
of the PC instead of a small keyboard and a small screen of the blackbody controller. Next, the control software enables the user also visualization and recording
temperatures versus time and recalibration of the blackbody.
The presented above description, block diagrams and photos refer precisely to
old model of blackbodies offered by Inframet [30]. New models from this company
look a different but basically the work concept is the same as presented earlier.
4.2.2.2 Requirements
Temperature resolution NETD of modern cooled thermal cameras can be as low
as about 10 mK. Temperature resolution NETD of uncooled thermal cameras is
worse (typically about 100 mK) but is improving rapidly. If we want to test accurately thermal imagers then we need blackbodies of temperature resolution a dozen
or more times better than imager temperature resolution (NETD). Temperature resolution of 10 mK is acceptable in case of non-cooled thermal cameras. However,
if cooled thermal imagers are to be tested then blackbodies of 1 mK resolution are
needed. In some extreme cases when imager MRTD at low frequency range is below 10 mK then even 0.1 mK resolution is useful.
Differential temperature range ±10°C at 25ºC ambient temperature can be considered as acceptable during tests of typical surveillance thermal imagers. However,
wider temperature range is useful when testing commercial measurement thermal
imagers. It can be estimated that absolute temperature range from 0°C to 100°C
fulfills typical requirements for temperature range needed for testing surveillance
thermal imagers and partially the requirements on blackbodies for testing commercial thermal imagers8.
Theoretically it is possible to use gray bodies during tests of thermal cameras
and later to correct influence of difference between emissivity of the real blackbody
and emissivity of an ideal blackbody on condition that the emissivity of the real
blackbody is not lower than 0.9 due to problems with reflected radiation. However,
a better option is to use real blackbodies of emissivity close to one when almost no
correction is needed, particularly during differential measurements. Therefore
emissivity not less than 0.97 (or higher) is considered nowadays as a standard requirement.
8
Temperature range of some measurement thermal cameras goes over 1000°C and cannot be
covered using thermoelectric blackbodies.
97
Measurement of some characteristics is carried out for both positive and negative contrast. Later the results are averaged. Theoretically this approach enables full
correction of systematic errors of measurement process (mostly caused by offset
phenomenon). However, practically this correction works properly only when
blackbody does not change its temperature with time. Practically this means that
blackbodies of high temporal stability are recommended. Blackbodies of temporal
stability not worse than ±3 mK are usually acceptable but there are cases when
temporal stability at level ±1 mK is needed.
Non-uniformity of temperature distribution on surface of the blackbody emitter
should not influence the measurement results. The requirements on non-uniformity
are the highest during measurements of subjective characteristic like MRTD. The
observer should not notice any non-uniformity on blackbody surface during MRTD
measurement. Temperature difference during MRTD measurements is usually not
higher than 5°C and therefore it is usually considered that non-uniformity is acceptable if it is below 10 mK at 5°C.
Tests of thermal cameras can be quite time consuming; particularly MRTD
measurements. Therefore blackbody speed (stabilization time) is an important parameter because long settling time means long lasting tests. There is no strict limits on
settling time but it is convenient if blackbody temperature stabilize at time no
longer than about 1 minute in case of small (about 50 mm diameter) blackbodies
or 90 s in case of bigger blackbodies of a size more than 100 mm.
Due to relative nature of measurement of most characteristics of surveillance
thermal imagers accuracy of absolute temperature of the blackbody emitter is not
a crucial parameter. Even significant errors of differential temperature measurement are fully eliminated, or at least significantly reduced, when measurements are
carried out first for positive contrast targets and later – for negative contrast targets.
Blackbody accuracy is important during calibration process of measurement
(commercial) thermal cameras when the blackbody is used as a reference standard.
Absolute accuracy of modern commercial thermal cameras is typically ±2% or
±2°C (whichever higher) in camera temperature range. Accuracy of blackbodies
should be at least ten times better. Therefore it seems that temperature errors of
blackbodies at a level of ±0.2% or ±0.2°C should be considered as acceptable. If
the manufacturer can deliver blackbodies of better accuracy it should be welcome.
98
Table 4.6. Summary requirements on blackbodies
Parameter
Temperature
resolution
Absolute
Temperature range
Differential
Temperature range
Acceptable
10 mK-for testing noncooled imagers
1 mK – for testing cooled
III gen imagers
15°C ÷ +35°C at +25°C
ambient temperature
-10°C ÷+10°C at +25°C
Emissivity
≥ 0,96
Settling time ±10ºC 120s (at ±10 mK level)
step (seconds)
Uniformity
±20
mK
for
±5°C
temperature range
±150 mK for ±30°C
temperature range
Stability
±20
mK- non cooled
imagers
Absolute uncertainty ±0.2% or ±0.2°C
Recommended
1 mK – typical situation
0.1 mK – extreme cases
0°C ÷ +100°C – typical
situation
-15°C ÷ +100°C – extreme
situation
−25°C ÷ + 75 °C – typical
situation
−40°C ÷ + 75 °C – extreme
situation
≥0.97
60s (at ±10 mK level
±10 mK for ±5°C temperature
range
±100
mK
for
±30°C
temperature range
±2 mK – typical situation
±1 mK– extreme situation
(T-25°C)*2+15
[mK]
–
blackbody
exceeding
real
requirements
4.2.3 Rotary wheel
The task of rotary wheel is to enable speedy exchange of the target to be projected by the collimator or to be observed directly by the tested thermal imager. This
task can be also done by horizontal or vertical sliders with a set of different targets.
However due to simplicity, the rotary wheels are used typically to exchange the
targets in systems for testing thermal imagers.
Two basic types of rotary wheels are available on the market: manual rotary
wheels or motorized rotary wheels. A touch of human hand can change slightly
temperature of the wheel. In situation when modern thermal imagers are becoming
extremely sensitive any such temperature variation can cause some measurement
errors. Therefore motorized rotary wheels are recommended when testing high
sensitivity thermal imagers.
Next, air flow can cause some variations of target temperature. This effect can be
reduced if the wheel with targets is put inside a closed enclosure that eliminates exchange of air inside/outside the wheel block.
99
Number of holes for the targets can vary. However, there are usually 6 to 12
holes for targets in the wheel. The wheels are usually covered with a black, high
emissivity coating. The requirements on coating are similar like in case of the targets.
Requirements on positioning accuracy are not high in case of typical tests of
thermal imagers. Slight angular variations of position of the image projected by the
collimator has no influence on measurement results of parameters of thermal imagers. It is enough if positioning repeatability of the wheel is not worse than about
1 mm. However there are some tests of thermal imagers used for automatic target
recognition tasks when much better positioning repeatability close to 0.1 mm level
is required.
Fig. 4.17. Photo of a motorized rotary wheel and differential blackbody (courtesy of Inframet).
During tests of thermal imagers, we need to know temperature of the blackbody
radiator and temperature of the target. Temperature of the blackbody radiator is typically measured using a small temperature sensor inserted to a hole in the radiator.
This direct contact measurement method cannot be used to measure temperature
of the targets because the targets are rotating.
One solution to solve the problem is to use a sliding temperature sensor that
slightly touches the active target and measures its temperature. However, that direct
contact of the sensor with the target, when the latter is moving generates some heat
and this effect creates additional measurement error.
Another solution is to measure target temperature indirectly. The sensor is attached to the rotary wheel. If there is good thermal contact between the targets
and the rotary wheel then difference between target temperature and wheel temperature is negligible and target temperature can be indirectly measured.
100
Both the target plates and the rotary wheel should be put inside an enclosure
that would reduce influence of conditions in a test room on temperature
of the wheel with the targets. We must keep in mind that variations of ambient temperature in test rooms are often at level of several Kelvins in a period of a dozen
minutes. If similar variations of temperature of the target wheel occur then accurate
measurement of parameters of thermal imagers is not possible.
To summarize, we can present the following requirements on the rotary wheels:
1. Manufactured from high thermal conductivity material.
2. Good thermal contact between targets and the wheel where the targets are
fixed.
3. Preferably motorized type.
4. Easy and speedy target exchange.
5. The targets should be protected against influence of external conditions on
their temperature.
6. Positioning repeatability at level about 1 mm (typical tests) or about
0.1 mm (automatic targets recognition tests).
4.2.4 Targets
Targets for testing classical visible/near infrared imaging systems are manufactured by creating opaque or semi-transparent coatings on transparent glass substrate.
When a diffuse light source is put behind the target then the tested visible camera sees a "target" formed by the coating on an uniform bright background (in case
of positive contrast targets). The visible targets can be also manufactured by precise
printing of images of different shape on high quality paper. However, these two
techniques are rarely used to manufacture targets for testing thermal imagers because it is difficult to determine and to control temperature distribution on the surface of such targets. Additionally typical glasses poorly transmit radiation over
3 micrometers. Therefore infrared targets for testing thermal imagers are manufactured using a different technology.
Targets for testing thermal imagers are usually manufactured by creating precision holes of different shapes in metal sheets. When a blackbody is put behind such
a target, the tested thermal camera sees a "target" of shape determined by the holes
on an uniform background. The apparent temperature of this "target" is equal to
blackbody temperature; the apparent temperature of the background is equal to
the temperature of the real target plate.
Fig. 4.18. Image of a 4-bar target (generated by a tested imager during MRTD measurement).
101
Fig. 4.19. Photo of a multiply 4-bar target used for MRTD measurement from two sides.
In order to achieve high thermal uniformity on the surface of the target, the targets are manufactured by cutting the desired holes in a thick metal sheet of high
thermal conductivity (typically copper alloys). Next, one side of the targets is
coated using a special high emissivity black coating. This side of the target should
look into the direction of the IR collimator (or in the direction of the tested thermal
camera). The second side of the target is coated using a high reflectivity coating in
order to minimize influence of the blackbody thermal radiation on the target plate
temperature. The targets are typically fixed to the rotary wheel or directly to
the blackbody.
The targets manufactured using the technology described earlier are called
“emissive targets”. There is also another type of the infrared targets called “reflective targets”. Both sides of such targets are covered using high reflectivity coatings.
When such targets are mounted to a rotary wheel in a collimator based test system
then a tested imager will see through target holes a blackbody behind the active target and collimator enclosure9 reflected by the target reflective surface. If a second
blackbody is located inside the collimator then we can achieve a situation when
both target temperature and the background temperature can be independently regulated (Fig. 4.20).
If the targets are properly manufactured and properly used then both two types
of targets should generate the same test results. However, the “emissive targets” are
preferred because collimators used in the test system optimized for reflective targets
shown in Fig. 4.20 are more expensive than typical collimators ( collimating mirror
of ultra low F-number and big off axis distance is needed). Therefore the reflective
targets are met rather rarely when testing thermal imagers; mostly in case of collimators of modified design with improved baffling.
9
The tested imager can see also itself reflected on the surface of the reflective target.
102
Fig. 4.20. Block diagram of test system optimized for use of reflective targets and two
blackbodies [3]
Targets of different shape are manufactured to enable measurement of different
parameters of thermal imagers. We can distinguish at least fourteen shapes of IR
targets:
1.
2.
3.
4.
5.
6.
7.
Four-bar targets.
Pinhole targets.
Square targets.
Slit targets.
Interlace targets.
Edge targets.
Alignment targets.
8.
9.
10.
11.
12.
13.
14.
Double 4-bar targets.
Multiple 4-bar targets.
Multiple pinhole targets.
Abingdon cross targets.
Distortion targets.
Grey scale target.
Silhouette targets.
Drawings of these targets are shown in Fig. 4.21 and their description in Table 4.7.
1
2
3
4
5
6
7
8
9
10
11
12
13
14
Fig. 4.21. Drawings of different types of IR targets
103
Table 4.7. Application area of different types of IR targets
No Target
type
1
4-bar
Description
Application Comments
single 4-bar pattern
(7:1 bar
proportions) cut in
metal sheet
MRTD
2
pinhole
target
circular pattern cut
in metal sheet
MDTD
3
square
target
single square
pattern cut in metal
sheet
4
slit target
single long slit cut
in metal sheet
ATF or
SiTF,
NETD,
FPN
(option)
SRF, MTF
5
interlace
target
single long, narrow
slit pattern cut in
metal sheet skewed
by 45º
6
edge target a half-moon of
sharp smooth edge
pattern cut in metal
sheet
alignment patterns of pinhole- boresightin
target
and-cross
g, focusing
combinations
and
alignment
double 4- double 4-bar
MRTD
bar target pattern (vertical
and horizontal 4bar pattern)
Multiple
multiple 4-bar
MRTD
4-bar
patterns of different
targets
size cut in a single
metal sheet
7
8
10
multiple
pinhole
-a set of targets with various spatial
frequencies is needed to measure MRTD
characteristic
-it is necessary to rotate targets to measure
both vertical and horizontal MRTD
-a set of targets with various size is
needed to measure MDTD characteristic
-small pinhole target is needed during
PVF measurement
- a set of square targets for ATF
measurement
- single square target for SiTF, NETD,
FPN measurement (old technique)
-a set of slit targets of different width is
needed to measure SRF
-single very narrow slit target for MTF
measurement
scanning
needed to check interlace scanning
adjustment, adjustment, as well as to identify strapped
dead
or dead channels in scanning imagers.
channels
These effects appear in a form of
deviations from the ideal smooth diagonal
line.
ESF, MTF ESF (edge spread function) is measured
directly. MTF is calculated on the basis of
measured ESF.
multiple circular
MDTD
patterns of different
diameter cut in a
single metal sheet
104
different sizes are needed depending on
imager field of view
it is possible to shorten measurement time
of MRTD because both horizontal 4-bar
patter and vertical 4-bar patterns are seen
at the same time
cost-effective solution for MRTD
measurements when test are to be carried
out at 2-3 frequencies. A single multiple
4-bar target with several 4-bar patterns
can replace a series of 4-bar targets with
a single pattern.
cost-effective solution for MDTD
measurements. A single multiple pinhole
target with several pinhole patterns can
replace a series of pinhole targets with a
single pattern.
11
12
Abingdon
cross
target
distortion
target
13
gray
target
14
silhouette
target
single Abingdon
cross pattern cut in
metal sheet
set of narrow lines
creating multiple
square pattern
set of small squares
of different
transmittance
silhouette pattern
resembling real
targets
testing
tracking
systems
distortion
targets are used to evaluate the
effectiveness of image processing
algorithms in presence of noise.
to evaluate linear and angular
displacements due to distortion effect
response
function
can speed up measurement of response
parameters
evaluation
of
surveillance ranges
targets are used for evaluation of
surveillance ranges of real targets
A process of cutting holes in metal sheets necessary to manufacture IR targets
looks simple. However, practically it is quite difficult to manufacture proper IR targets that can fulfill presented below requirements.
1. High thermal uniformity of temperature distribution on target surface.
The uniformity of the temperature distribution on the target plates should
be a few times better than MRTD or MDTD values obtained with these targets. In order to fulfill this requirement the targets should be manufactured
from material of high thermal conductivity. Copper or copper alloys are
acceptable but steel sheets should be avoided. Next, the metal sheets cannot
be too thin as thin sheets are characterized by low thermal conductance
even if manufactured from proper material. It seems that 0.3-0.5 mm can
be considered as minimal thickness of metal sheets for target manufacturing even in case of copper sheets.
2. High accuracy of pattern manufacturing. If there are significant differences
between area of the bars in 4-bar targets, then accuracy of MRTD measurement is reduced because spatial frequency of such a target is determined
with some error. In general, the following tolerances are recommended:
2% for patterns of minimal dimension over 1 mm and 4 % for patterns below 1 mm but over 0.3 mm, and 8% for pattern below 0.3 mm.
3. High emissivity of the target side surface facing the tested imager. The target emissivity should be the same as the blackbody emissivity to avoid
situation when the target is seen not due to temperature difference but due
to emissivity difference. Therefore target emissivity should be at least 0.97
to resemble ideal blackbody surface.
4. High reflectivity of the target side surface facing the blackbody. Targets
should be polished or coated to get reflectance of at least 0.9 in order to
eliminate influence of blackbody temperature on target temperature.
As we can see in Table 4.7 the list of types of infrared targets is quite long.
However, a typical set of targets for testing surveillance thermal imagers is rather
short:
1. A set of six to twelve 4-bar targets (for MRTD measurement),
105
2. Edge target (for MTF measurements),
3. Distortion target (for distortion/FOV measurement).
The set of 4-bar targets is built typically from several single targets (bigger patterns) and several double 4-bar (smaller patterns). Single big 4-bar targets are used
because simply there is no space for double patterns in the target plate if the 4-bar
pattern is big.
The edge target is typically preferred over slit target during MTF measurement.
There are several advantages of edge targets but one of most important is the fact
that several slit targets are needed for testing different thermal imagers in situation
when a single edge target can be used for measurement of MTF of any thermal imager.
The distortion target is used for measurement of distortion. The distortion effect
in thermal imagers of narrow/medium field of view is usually small, almost negligible. However, the same target can be used also for measurement of imager field of
view. It is important to measure the latter parameter because only when we known
field of view there is any sense to compare MRTD characteristics of several thermal
imagers.
It may be surprising for some readers that square targets are not included in this
basic set of IR targets. The square targets were traditionally used for several decades during measurement of NETD of thermal imagers. However, it should be
noted that these targets were used to measure NETD of scanning thermal imagers
using oscilloscopes. Nowadays, frame grabbers are typically used instead of oscilloscopes. Next, staring thermal imagers are typically tested instead of scanning
imagers. Finally, modern software enables analysis of any part of images generated
by thermal imagers. Therefore the rectangle targets are not strictly needed for measurement of noise parameters. These targets are needed for measurement of ATF but
it is a rather rarely measured characteristic.
Other types of IR targets listed in Table 4.7 are needed in case of extended tests
of thermal imagers or when by use of multi-pattern targets we want to speed up test
procedure. Applications of these targets are presented in the same table.
4.2.5 Image acquisition/analysis module
Image acquisition/analysis module is built from the following blocks: PC, frame
grabber (video card), and test software. It is practically a specialized PC to carry
out tasks needed in testing thermal imagers. The module should enable acquisition
of the output signal from the tested thermal imager, analysis of the captured images,
and semi-automatic determination of important characteristics of thermal imagers.
4.2.5.1 PC
In general, PC should enable processing of the input data from the frame grabber, and calculation and visualization of characteristics of thermal imagers. Practically, all modern PCs can handle such tasks.
106
4.2.5.2 Frame grabber
Almost all surveillance thermal imagers generate output images in form of analog video electrical signal: PAL standard or NTSC standard. However, more and
more thermal imagers generate output images in form of digital signal: Fire Wire,
USB 2.0, Camera Link, GigE, LVDS. Especially the latter three standards (Camera
Link, GigE, LVDS) are popular for designers of high resolution/high speed thermal
imagers.
The task of a frame grabber (video card) is to capture sequences of images generated by tested thermal imager. The ideal frame grabber should accept input data
in all typical electronic standards: PAL, NTSC, Fire Wire, USB 2.0, Camera Link,
GigE, LVDS. Next, it is critical that there should be no noticeable degradation
of image quality caused by the frame grabber. Please note that most low cost frame
grabbers are designed with the aim to be used in applications where quality of the
captured images is not critical but compression ratio is the most important parameter.
Each frame grabber device should provide a proper software driver, which
should contain routines compatible with one of existing, commonly used APIs
(Application Programming Interfaces). Image acquisition applications (software
modules) are based on such standards as e.g. TWAIN, or more native to Microsoft’s
operating systems interfaces as DirectShow, or WIA (Windows Image Acquisition).
Main functionality of image acquisition software module is to get image from video
capture device in form of separate frames or – in most cases – in form of video
sequence. Such collection of image data can be passed on for further processing
and analysis.
4.2.5.3 Test software
There are four tasks of test software used in systems for testing thermal cameras:
1. Remote control from PC of the test system hardware (blackbody, rotary
wheel).
2. Acquisition of the output images generated by the tested thermal camera.
3. Software support during measurement of subjective parameters: MRTD,
MDTD.
4. Semi-automatic measurement of objective parameters of tested thermal
imager.
The tasks mentioned above can be handled in different way by different computer
programs. Here we will formulate basic requirements and recommendations for test
software.
1. Easy to learn, graphical method for control of blackbody temperature
and position of rotary wheel.
2. Tools for software support during MRTD/MDTD measurements:
a) Storing test conditions (type of tested imagers and its serial number, test
date, ambient temperature, collimator transmittance, target frequencies),
107
b) Calculation of target frequencies in lp/mrad using user inserted data
of bar width in mm,
c) Automatic inserting current blackbody temperatures to the test table
at temporal points determined by the user,
d) Correction of influence of two test parameters (ambient temperature
and collimator transmittance) on MRTD/MDTD measurement results,
e) Presentation of measured MRTD/MDTD in graphical form or tables.
f) Generally the software should limit requirements on the user only to
make decision whether he recognize the 4-bar pattern and carry out all data
analysis, visualization and recording.
3. Ability to cooperate with different types of frame grabbers capable to capture video signals of different standards. Software should enable capturing
images with no compression, or using compression methods that would not
degrade in noticeable way quality of the captured sequence of images10.
4. Test software should enable semi-automatic measurement of most important parameters of surveillance thermal imagers: noise parameters, SiTF,
MTF, distortion, distortion, FOV.
5. Test software should enable measurement of most important parameters
of measurement thermal imagers: accuracy, NETD, and SRF.
To summarize, good test software should guide the user through the measurement process and minimize possible errors. This requirement can be fulfilled by
semi-independent software modules designed to support measurement of specific
characteristic that make the user to carry out steps of the measurement algorithm
and give the user precise instructions about the measurement steps.
1,4
1,2
1
MTF
0,8
0,6
0,4
0,2
0
0
1
2
3
4
5
6
7
spatial frequency [1/mrad]
Fig. 4.22 Exemplary noise window of test
software.
Fig. 4.23 MTF of two different thermal
cameras.
10
Typical commercial video capturing software was developed with the aim to capture and record
long video sequences using as least as possible memory on hard disk. Therefore such software
often degrades image quality of the captured images and this degradation can influence
measurement results.
108
4.2.6 Optional blocks
It is impossible or at least very difficult to carry out testing thermal imagers
without such blocks of the test system like: collimator, blackbody, rotary wheel, set
of targets, PC, frame grabber, and test software. There are also some blocks that are
not strictly needed but still can be useful.
4.2.6.1 Temperature chamber
Thermal imagers are usually tested at laboratory conditions in a situation when
they are expected to work properly at extreme ambient temperatures. It is a commonly forgotten truth that parameters of thermal imagers can vary significantly with
ambient temperature. This dependence or in other words imager temperature stability can be measured by placing the tested imager inside a temperature chamber
of variable ambient temperature and then by measuring imager characteristics.
There are two methods to measure temperature stability: the first by putting to
the chamber both the imager and the blackbody, the second – by putting to
the chamber the imager and using a chamber with a transparent window. The latter
method is more convenient for the test crew.
There are many commercially available temperature chambers on the market.
However, they are typically not optimized for testing thermal imagers: they are too
big, have too high thermal/temporal inertia, and the chambers often are not
equipped with infrared transparent windows. Therefore it is recommended to use
for testing thermal imagers small temperature chambers of low thermal inertia
equipped with an infrared transparent window. Temperature range of the temperature chamber should fit to the temperature range of the environment where the tested
imager is to be used. Such a temperature chamber can be also very useful during
calibration process (spatial noise correction) during manufacturing process.
4.2.6.2 Optical table
Special expensive anti-vibration optical tables are not generally needed as a place
where the test equipment is to be located. The required accuracy of alignment of
the test system is much lower than accuracy of alignment of some laser systems or
holographic equipment. In most cases the test equipment can be properly aligned
on any large, heavy and stable wooden (stone, metal) table. However, special care
should be taken during testing long range thermal imagers of very narrow field
of view. Vibration of the table can influence image quality of the image from
the tested imager and can distort measurement results. In this case it is recommended to use expensive optical anti-vibration tables or to use modified typical tables
with additional vibration damping parts.
4.3 Manufacturing/R&D support equipment
So far we have discussed in detail systems for testing thermal imagers
understood generally as final, ready products. The tests using presented earlier test
systems deliver a lot of information useful to verify final quality and to localize
109
weak points of manufactured thermal imagers that should be improved. However
other types of test equipment are needed for manufacturing thermal imagers and
for research&development projects. Before a thermal imager is ready for final tests,
several important operations must be carried out:
1. Correction of spatial noise.
2. Calibration of measurement thermal imagers.
3. Boresighting to a reference optical/mechanical axis.
4.3.1 Correction of spatial noise
Image generated by modern IR FPA sensors, particularly non-cooled sensors, is
typically very noisy. Spatial noise is the dominant type of the noise. Correction
of spatial noise is needed to obtain a clear image generated by thermal imagers.
There are many algorithms that are used to correct spatial noise in thermal imagers. However, they are generally based on a concept of IR FPA module/thermal
imager looking into an internal/external uniform radiation source (Fig. 4.24). We
can say that in order to correct spatial noise we must create a data array that records
values of this noise at different ambient temperatures and at different input signal
levels.
Practically, such data array is determined by putting a tested IR FPA module
or tested thermal imager, located at a very short distance to an area blackbody, to
a temperature chamber; and by recording images at different chamber temperature,
for different blackbody temperature, and for different imager settings (gain, level,
etc). This operation provides primary data base used for spatial noise correction.
Recalibration of thermal imagers using internal mechanical chopper provides only
additional secondary data base.
Some manufacturing teams carry out corrections of spatial noise on the basis
of data obtained during tests of IR FPA modules; others carry out corrections
of spatial noise on the basis of data get during tests of complete thermal imagers.
The first case is more convenient because smaller blackbodies and smaller temperature chambers of low power and low thermal inertia can be used. In the second
case bigger blackbodies and bigger temperature chambers must be used, but
the test conditions resemble well work conditions of real thermal imagers and better effectiveness of correction of spatial noise can be achieved.
110
temperature chamber
black
body
temperature chamber
IR FPA
module
black
body
a)
thermal
imager
b)
Fig. 4.24. Typical concept of correction of spatial noise.
From test hardware point of view two basic test modules are needed to carry out
measurement of spatial noise of tested thermal imager: a temperature chamber
and an area blackbody.
The task of these two modules is to simulate real environmental conditions
of work of the tested imager/IR FPA module. Therefore the requirements vary depending on geographic region but let us propose requirements on these two modules that make them suitable for testing thermal imagers supposed to work in any
climatic conditions.
Table 4.8. Requirements on temperature chamber.
Parameter
Requirement
Temperature range
-30ºC to +60ºC
Temperature uniformity
better that ±0.5ºC
Volume
Optimized to number of imagers to be tested at the
same time
Temperature regulation speed Full temperature range below 45 minutes
Table 4.9. Requirements on blackbody.
Parameter
Requirement
Blackbody emitter size
-at least 10% bigger than diameter of optics of tested
imager
-at least four times bigger than size of IR FPA sensor
Work
range
ambient
temperature -30ºC to +60ºC
Differential temperature range −10°C÷+40°C
Absolute temperature range
-40ºC to 80ºC
111
As we can see in Table 4.9, the requirements on blackbody to be used for correction of spatial noise of thermal imagers differ significantly from requirements on
blackbodies to be used in typical test systems that were discussed in Section 4.2.2.
We must remember that generally typical test systems are designed to work at
laboratory conditions in a situation when the tests of spatial noise are done in extreme temperature conditions. Therefore there are big differences in requirements
on work temperature and on absolute temperature range. Next, there are also some
differences in requirements on size of the blackbody emitter. In case of typical test
systems a blackbody of emitter size equal to 50x50 mm can be considered as sufficient because the holes in the targets are typically smaller than about 40 mm. The
blackbodies that are to be used in temperature chambers they must be bigger than
diameter of the optics of tested imager. Optics of a diameter of about 100 mm is
commonly met in many non-thermal imagers. Therefore blackbodies of a size at
least about 125 mm can be considered as acceptable for spatial noise tests of majority of thermal imagers.
Theoretically it is possible to use one big blackbody both for testing calibration
(spatial noise correction) of surveillance imagers and for typical tests of thermal imagers. However, such compromise solution is not convenient for the user due to necessity of manual moving heavy blackbody, test speed is reduced, and finally blackbody reliability can deteriorate, too. Therefore it is recommended to use two specialized blackbodies: a smaller blackbody as a module of a system for testing
thermal imagers, and bigger blackbody for spatial noise correction.
4.3.2 Calibration of measurement thermal imagers
Calibration of measurement thermal imagers is a process where relationship
between temperature of a blackbody and output signal generated by tested imager is
determined for different settings of the imager. The calibration principle is simple:
the imager is looking into a blackbody located in its field of view as shown in Fig.
4.25.
The environmental requirements on measurement thermal imagers are not as
harsh as such requirements on surveillance imagers. Next, due to some design
differences the influence of ambient temperature on image generated by
measurement imagers is not as significant as in case of surveillance imagers.
Therefore it is recommended to carry calibration of measurement thermal imagers
at several ambient temperatures using a temperature chamber but this
recommendation can be treated as an optional one.
Calibration of measurement thermal imagers could be potentially carried out using
a typical system for testing surveillance thermal imagers when the tested
measurement imagers is looking into the blackbody via the collimator. However
practically blackbodies from systems for testing surveillance imagers can be used
only for partial calibration of measurement thermal imagers. The absolute
temperature range of typical blackbodies used for testing surveillance range (from
112
0ºC to 100ºC)
is too narrow for calibration of measurement thermal imagers
designed for non-contact temperature measurement of targets of temperature
variable from about -20ºC to about 300ºC (sometimes up to 1000ºC).
There are on the market some differential blackbodies of extended temperature
range from about -15ºC up to about 150ºC-180ºC [24,30]. Such blackbodies can
be used for calibration, even more for recalibration, of measurement thermal
imagers optimized for temperature ranges no more than only slightly bigger than
the absolute temperature range of these blackbodies. However, upper limit of
temperature range of most thermal imagers is typically much higher than 180ºC.
Therefore several blackbodies of wide combined temperature range are needed to
carry calibration of most measurement thermal imagers.
temperature chamber
thermal
imager
black
body
Fig. 4.25. Concept of calibration of measurement thermal imagers.
4.3.3 Boresighting to a reference optical/mechanical axis
Boresighting is a process to align optical axis of a single system or a series
of optical or electro-optical systems with a certain reference optical axis
or mechanical axis.
Basically the aim of boresighting of a thermal imager is to achieve a situation
when:
a) optical axis of the thermal imager is parallel to axis of other electro-optical
surveillance systems (the case when the thermal imager is a part of a bigger multisensor surveillance system),
b) optical axis of the thermal imager is parallel to a reference mechanical axis.
In other words the aim of boresighting process is to achieve a situation when:
a) all subsystems of bigger electro-optical imaging systems are looking into
the same point (assumption: the distance is hundreds times bigger than the focal
length of the optics of the subsystems),
b) an imaging system (the thermal imager) is looking at a point of exactly known
coordinates relative to the reference mechanical axis).
When the boresighting process is not carried out properly we can get a situation
when:
113
a)the thermal imager generates an image of a slightly different area that the area
seen on the image produced by the TV camera (the two images are slightly
displaced); laser range finder can measure a distance but not to the point marked on
the image generated by the thermal imager,
b) the thermal imager generates an image of the target of interest but we cannot
determine accurate relative/absolute coordinates of the target.
Boresighting of thermal imagers can be done using special versions of systems
for testing thermal imagers or using specialized systems optimized for boresighting
task.
There are generally three types of systems for boresighting of thermal imagers
or multi-sensor surveillance systems.
The first systems are based on a concept of a collimator generating output beam in
direction of exactly known angular coordinates.
The second systems are based on a concept of an additional imaging sensor fixed to
a reference mechanical axis looking into direction of the test collimator.
The third systems use an additional imaging sensor fixed to a reference mechanical
axis looking into infinity target (real target at long distance).
Boresighting process is generally outside area of interest of this book and shall
not be discussed further. More detailed information about equipment for
boresighting of thermal imagers can be obtained from manufacturers of equipment
for testing thermal imagers who can optionally deliver also boresighting equipment.
4.4 References
1. ASTM standard E 1213-2002 “Standard Test Method for Minimum Resolvable Temperature
Difference for Thermal Imaging Systems”
2. ASTM standard E 1311-99 “Standard Test Method for Minimum Detectable Temperature
Difference for Thermal Imaging Systems”
3. Bryant P., Grigor J., McHugh S., Performance comparison of reflective and emissive target
projector systems for high-performance IR sensors, Infrared Imaging Systems: Design,
Analysis, Modeling, and Testing XIV, SPIE Vol. 5076, pp.242-249, 2003.
4. Chrzanowski K., J. Fischer, W. Wrona, Testing of Thermal Imagers For Non-Destructive
Thermal Testing Applications, ASTM Journal of Testing and Evaluation, 28, 395-402 (2000).
5. Chrzanowski K., Evaluation of IR collimators for testing of thermal imaging systems,
Optoelectronics Review, 1/2007.
6. Chrzanowski K., Lee H.C., Wrona W., A condition on spatial resolution of IR collimators for
testing of thermal imaging systems, Optical Engineering., 39 (5), 14137-1417 (2000).
7. Chrzanowski K., Evaluation of commercial thermal cameras in quality systems, Optical
Engineering, Vol. 41, No. 10 (2002).
8. Digital Signal Processing Application with the TMS320 Family, Theory, algorithms and
implementations, Vol.2, Texas Instruments, 1990, 570-573.
9. Guide to the expression of uncertainty in measurement, International Organisation for
Standarisation-International Electrotechnical Commission-International Organisation of Legal
Metrology-International Bureau of Weights and Measures, TAG 4/WG 3, 1993.
10. Holst G.C., Testing and evaluation of infrared imaging systems, JCD Publishing Company
(2008).
114
11. Holst G.C., The Infrared & Electro-Optical Systems Handbook, Vol.3: Electro-Optical System
Design, Analysis, and Testing, Chapt. 4, pp. 206-207, SPIE (1993).
12. Holst G.C., Infrared Imaging System Testing, Vol.4, Chapt. 4 in The Infrared & ElectroOptical Systems Handbook, Michael C. Dudzik ed, SPIE 1993.
13. International Lighting Vocabulary, CIE Publ. No. 1 7.4, IEC Publ. No. 50(845) (1987).
14. ISO 15529, Principles of measurement of modulation transfer function (MTF) of sampled
imaging systems, 1999
15. Li .X. An investigation into the stability of industrial platinum resistance thermometer, Hart
Scientific
16. Lloyd J. M., The Infrared & Electro-Optical Systems Handbook, Vol.3: Electro-Optical
System Design, Analysis, and Testing, Chapt. 1,SPIE (1993).
17. MIL-STD-1859: Thermal Imaging Devices, Performance Parameters Of, 1983.
18. Driggers R., Van Hodgkin A., Vollmerhausen R., O'Shea P., Minimum resolvable
temperature difference measurements on undersampled imagers, Proc. SPIE Vol. 5076
Infrared Imaging Systems: Design, Analysis, Modeling, and Testing XIV; 2003.
19. STANAG 4349, Measurement of minimum resolvable thermal difference (MRTD) of thermal
cameras, 1995.
20. Tavener J.P., Common errors in industrial temperature measurement., Isotech Journal of
Thermometry Vol.6 No.2 1995, 20–27.
21. The Photonics Handbook, Book 3, p. H398-H404, Laurin Publishing Co. (1993).
22. Walker R., Achieving 0.25mK uncertainty with an integrated-circuit resistance thermometer
readout., Hart Scientific.
23 Wood L., Laboratory Bench Analysis of Thermal Imaging Systems, Opt. Eng., 15,
G193-G197 (1976).
24. www.ci-systems.com
25. www.ci-systems.com/eo/flir/mets.asp
26. www.eoi.com
27. www.electro-optical.com/datashts/collimtr/collimat.htm
28. www.electro-optical.com/eoi_page.asp?h=Diffraction Limits
29. www.hgh.fr
30. www.inframet.com
31. www.inframet.com/testing_infrared_imaging_systems.htm
32. www.sbir.com
33. www.optikos.com
34. www.sbir.com/stc_collimators.htm
35. www.sorl.com/productline/oaps/offaxisparabolas.htm
115
5 Test procedures
Methods of testing thermal imagers do not depend on test equipment used for
measurements. There are many similarities in procedures of measurement of parameters of thermal imagers using test equipment from different manufacturers but
there are also some differences, particularly resulting from the fact that nowadays
most of these measurements are supported using specialized software [8,10]. Therefore in this chapter, the simplified test procedures independent of software of test
equipment will be presented. These simplified test procedures refer directly to
equipment manufactured only by one of manufacturers of test equipment (Inframet
www.inframet.com) as only this equipment was at disposal of the author. However,
the presented in this chapter test procedures should be valid also for test equipment
from other manufacturers.
Over twenty parameters of thermal imagers can be measured to characterize accurately tested thermal imagers. Here in this chapter, we are to discuss measurement
procedures of only a small but the most important group of parameters of thermal
imagers; MRTD, MTF and noise parameters (NETD, FPN, non-uniformity, 1/f
noise, 3D noise components, NPSD).
The main emphasis was put on measurement of MRTD due to two basic reasons.
First, MRTD is considered as the most important parameter of thermal imagers
and it is commonly measured by both user of thermal imagers and by manufacturers
of these imagers. Second, in spite of apparent simplicity the measurement of MRTD
is difficult and it is easy to make errors in measurement procedure that can significantly reduce accuracy of the test results.
It is highly probable that a test team capable to carry out accurately MRTD
measurement of modern thermal imagers shall have no problems to carry out measurement of other parameters of thermal imagers.
5.1 MRTD
MRTD is considered as the most important parameter of thermal imagers.
MRTD measurement is both simple and difficult. Simple because the decisions are
made by humans; no tools for recording and processing electronic images are
needed. Difficult because many sources of possible measurement errors exist.
A classical subjective measurement of MRTD is a time consuming process.
The measurement can be shortened by using semi-automatic MRTD measurement
method. However, the latter one can be used practically only by manufacturers.
In order to carry out semi-automatic MRTD measurement, it is necessary to carry
out first classical MRTD measurement of a few imagers of the same type in order to
determine correction coefficients. The coefficients are valid only for just this type
of thermal imagers. This requirement makes the semi-automatic MRTD measurement attractive only when large number of imagers of the same time is to be tested.
116
5.1.1 Test team
MRTD is a subjective measurement when decision about test results is made by
a human observer. It is natural that there is some variability of human sight within
human population. In order to correct this variability, both standards and specialized
literature recommend to carry out MRTD measurement by several (at least three
observers) and then to average test results [1-4]. In this way, the variability of
results get by different test teams should be theoretically eliminated. Practically,
differences between MRTD measurement results of the same thermal imager
obtained by several test teams at the level as high as 50% are quite common [2,3].
There are two basic reasons for this situation. First, differences in test
equipment, detection criterion, observation conditions, and in a measurement
procedure used during testing. Second, training level of the test crew. There is
a general tendency that observers who spend hundreds of hours working with
thermal imagers are well adapted to typical noisy thermal images and they get
better results and the results are more stable. Therefore it is highly recommended to
carry out MRTD measurement only by test teams employing people who are socalled “qualified MRTD observers”. The latter ones are the people having no
medical problems with their eyes and who passed special training where they
became familiar with MRTD measurement. They made exemplary MRTD tests for
at least dozen or more hours and then repeatability of their test results and their
ability to detect and recognize low contrast targets in noisy environment was
confirmed. The training of qualified MRTD observers should be done using a series
of different real market thermal imagers. Such training can be also supported using
computer simulators11.
During real work, the observation time is quite often limited. The observer must
hurry up to detect and recognize the target he is looking for in the scenery.
However, it is commonly accepted that during MRTD tests the observer is allowed
unlimited (in reasonable range) viewing time. It improves little test results in
comparison to the limited-time test conditions.
5.1.2 Detection criterion
It is generally accepted in literature that the observer can consider that he “sees”
the 4-bar pattern when he is able to count four separate bars. The bars do not to be
seen all the time. They can be covered by temporal and spatial noise but still the observer must be sure that he can recognize all four bars. The bars can be distorted.
One or two bars can be wider than the others but still the observer must be able
to recognize separately four bars.
11
VIRTEST computer program freely available from www.inframet.com website can be used for
training.
117
5.1.3 Test environment
Observation conditions like ambient illumination, ambient temperature can
significantly influence measurement results. It is generally considered that ambient
illumination conditions during the MRTD tests should be similar to normal working
condition of the tested thermal imager. Next, the recommended ambient
temperature by the test standrds is 20 ±2°C. If tests are carried out at different
temperatures, then the test results should be corrected.
Influence of two factors on measurement results should be taken into account
and corrected: ambient temperature and transmittance of the optical channel
between imager and the test system. Ambient temperature depending on exact value
can both decrease or increase MRTD measurement results. Limited transmittance
always increases measurement results.
Influence of ambient temperature on measurement results can be corrected by
multiplying the measurement results by a certain correction coefficient cor.
In case of non-cooled thermal imagers (it can be assumed that imager noise does
not depend on ambient temperature), the coefficient can be determined using
the following formula:
∂ M (λ , Tba )
sys (λ )dλ
∂ Tba
∆λ
cor ( Tba ) =
,
∂ M (λ , Tba ( s ) )
sys
(
λ
)
d
λ
∫ ∂T
ba ( s )
∆λ
∫
(5.1)
where Tba is the ambient temperature for which the measurements were made, Tba(s)
is the standard background temperature,
M(T,λ) is the spectral exitance
at the temperature T and the wavelength λ, sys(λ) is the imager relative spectral
sensitivity, and ∆λ is the imager spectral band.
In case of cooled thermal imagers (it is assumed that BLIP detectors of ambient
temperature depending on noise are used) the coefficient cor can be determined
using this formula:
cor ( Tba ) =
∂ M (λ , Tba )
sys(λ )dλ
∂ Tba
∆λ
.
∂ M (λ , Tba ( s ) )
sys (λ )dλ
∫ ∂T
ba ( s )
∆λ
∫
(5.2)
If we assume that the reference ambient temperature equals 20°C, then for typical
thermal imagers of the 3-5 µm and the 8-12 µm spectral bands, the correction coefficient cor can be presented as shown in Fig. 5.1.
118
1,8
1,6
Coefficient
1,4
1,2
1
0,8
0,6
0,4
0,2
0
0
5
10
15
20
25
30
35
40
45
temperature [C]
Fig. 5.1. The correction coefficient cor for typical thermal imagers of the spectral bands
3-5 µm and the 8-12 µm: squares – non-cooled 3-5 µm; rhombus - noncooled 8-12 µm; triangle up - cooled 8-12 µm; triangle down - cooled 3- 5 µm).
Using the values of the coefficient cor shown in Fig. 1.1 and Table 1.1 it
is theoretically possible to correct MRTD measurement results when measurements
were carried out at a range of ambient temperatures from 0°C to 40°C. However,
the real thermal imagers fulfill relatively well assumptions taken to derive formulas
for the coefficient cor only in the range from about 10°C to about 30°C. Therefore
it is recommended not to carry out MRTD outside this temperature range.
Influence of transmittance of the optical channel can be corrected by
multiplying the results by a value of transmittance of the channel. In case of a
variable target test system, the distance between the test system and the imager is
very short, influence of atmosphere on radiation propagation is negligible, and
transmittance of the optical channel is equal to collimator transmittance.
Values of collimator transmittance can vary quite significantly from about 0.85 to
about 0.96. Next, collimator transmittance depends on a spectral range. Because
of this significant variability, the user should always get information from
manufacturer about collimator transmittance in the spectral range of interest.
The correction is done using the formula presented below:
MRTDcor= MRTDm τcol ,
(5.3)
where MRTDcor is the corrected MRTD, MRTDm is the original measurement
result, and τcol is the transmittance of the collimator.
In case of variable-distance test systems there is no collimator in the optical
channel but the distance imager-test system is longer. In typical conditions when
119
the distance is below about 100 m and measurement is done at good atmospheric
conditions we can consider that atmospheric transmittance is almost unity and does
not carry out any corrections. However, when the measurement is done at longer
distances or at poor atmospheric conditions then atmospheric transmittance should
be calculated and its influence on measurement results corrected.
The correction is done using the formula presented below
MRTDcor= MRTDm τa ,
(5.4)
where τa is the atmospheric transmittance.
Table 5.1. The correction coefficient cor for typical thermal imagers of the spectral bands
3-5 µm and the 8-12 µm at different ambient (background) temperature.
Temperature
Tba
0
2
4
6
8
10
12
14
16
18
20
22
24
26
28
30
32
34
36
38
40
Non-cooled
3-5 μm
0.55
0.58
0.62
0.66
0.7
0.74
0.79
0.84
0.89
0.94
1.0
1.06
1.12
1.18
1.25
1.32
1.39
1.46
1.54
1.62
1.7
Non-cooled
8-12 μm
0.78
0.8
0.82
0.84
0.87
0.89
0.91
0.93
0.96
0.98
1.0
1.03
1.05
1.07
1.1
1.12
1.15
1.17
1.2
1.22
1.24
Cooled
3-5 μm
0.74
0.76
0.79
0.81
0.84
0.86
0.89
0.91
0.94
0.97
1.0
1.03
1.06
1.09
1.12
1.15
1.18
1.21
1.24
1.27
1.3
Cooled
8-12 μm
0.88
0.89
0.91
0.92
0.93
0.94
0.95
0.97
0.98
0.99
1.0
1.01
1.03
1.04
1.05
1.06
1.07
1.08
1.09
1.1
1.12
5.1.4 Targets
MRTD is a continuous function of temperature difference on target spatial frequency. However, MRTD is measured only at several points. The results are later
approximated and MRTD curve is presented.
It is typically considered that MRTD should be measured at at least three measurement points that area located at three spatial frequency ranges: low, medium,
120
and high. In case of staring thermal imagers the frequency of the smallest target
(the highest frequency) should be about the Nyquist frequency. The latter one can
be calculated as 1/(2 IFOV).
Three measurement points is the minimal number. It is recommended to carry
out measurements at more points. Practically it means that for testing a set of different thermal imagers available on the market a set of at least twelve 4-bar targets
is needed.
Next, if the specifications of the tested imager present its MRTD values it
is recommended to carry out measurements at exactly the same spatial frequencies
as reported in the specifications.
Spatial frequency of 4-bar patterns is calculated as
ν [lp/mrad]=f' [m]/(2 a [mm]) - in case of variable target test systems,
ν [lp/mrad]=R [m]/(2 a [mm]) - in case of variable target test systems,
where ν is the spatial frequency of the 4-bar target, f' is the focal length of the collimator, R is the distance between the test system (target plane) and the imager (optics plane), and a is the width of a single bar in the 4-bar target.
Spatial frequencies of exemplary targets used in several variable target systems
and in a variable distance system are shown in Table 5.2-Table 5.3. In the first case
it was assumed that a series of 4-bar targets of a bar width variable from 0.1 mm to
4 mm and variable collimator focal length from 1 m to 3 m were assumed. In
the second case it was assumed that the variable distance test system uses two 4-bar
patterns: bigger 10 mm bar; smaller 4 mm bar.
International standards recommend to carry out MRTD measurements using targets with a single 4-bar pattern [1-4]. The target can be rotated to have the bars in
horizontal, vertical or other position. The aim of this is to help the observer to concentrate and make his task easier because he can expect to find only one 4-bar pattern on a uniform background and there are no other objects that can distract attention of the observers. However, practical experience of the author shows that placing two 4-bar patterns (one vertical 4-bar pattern and one horizontal 4-bar pattern)
do not reduce significantly accuracy of MRTD measurement but speeds up measurement process as within one process both horizontal MRTD and vertical MRTD
can be determined. Therefore it is recommended to use double 4-bar targets in
MRTD measurement process, particularly when differences between horizontal
MRTD and vertical MRTD are expected.
a)
b)
Fig. 5.2. Two 4-bar targets: a)single 4-bar pattern b)double 4-bar pattern
121
Table 5.2. Spatial frequencies of exemplary series of 4-bar targets in case of four variable target test systems of different collimator focal length f'
bar width
[mm]
4.00
3.36
2.83
2.38
2.00
1.68
1.41
1.19
1.00
0.84
0.71
0.59
0.50
0.42
0.35
0.30
0.25
0.21
0.18
0.15
0.13
0.10
spatial frequency
[1/mrad]
f'=1000 mm
0.13
0.15
0.18
0.21
0.25
0.30
0.35
0.42
0.50
0.60
0.70
0.85
1.00
1.19
1.43
1.67
2.00
2.38
2.78
3.33
3.85
5.00
spatial frequency
[1/mrad]
spatial frequency
[1/mrad]
spatial frequency
[1/mrad]
f'=1500 mm
0.19
0.22
0.27
0.32
1500
0.45
0.53
0.63
0.75
1500
1.06
1.27
1.50
1.79
1500
2.50
3.00
3.57
4.17
1500
5.77
7.50
f'=2000 mm
0.25
0.30
0.35
0.42
0.50
0.60
0.71
0.84
1.00
1.19
1.41
1.69
2.00
2.38
2.86
3.33
4.00
4.76
5.56
6.67
7.69
10.00
f'=3000 mm
0.38
0.45
0.53
0.63
0.75
0.89
1.06
1.26
1.50
1.79
2.11
2.54
3.00
3.57
4.29
5.00
6.00
7.14
8.33
10.00
11.54
15.00
122
Table 5.3. Spatial frequencies (in lp/mrad] of two 4-bar patterns as a function of the distance R
between the imager and the variable distance test system and the width of target bar a
R[m]
a=10
[mm]
0.05
0.1
0.15
0.2
0.25
0.3
0.35
0.4
0.45
0.5
0.55
0.6
0.65
0.7
0.75
0.8
0.85
0.9
a=4
[mm]
0.125
0.25
0.375
0.5
0.625
0.75
0.875
1
1.125
1.25
1.375
1.5
1.625
1.75
1.875
2
2.125
2.25
R
[m]
19
20
21
22
23
24
25
26
27
28
29
30
31
32
33
34
35
36
a=10
mm
0.95
1
1.05
1.1
1.15
1.2
1.25
1.3
1.35
1.4
1.45
1.5
1.55
1.6
1.65
1.7
1.75
1.8
a=4
R
a=10
[mm] [m] [mm]
2.375 37 1.85
2.5
38 1.9
2.625 39 1.95
2.75
40 2
2.875 41 2.05
3
42 2.1
3.125 43 2.15
3.25
44 2.2
3.375 45 2.25
3.5
46 2.3
3.625 47 2.35
3.75
48 2.4
3.875 49 2.45
4
50 2.5
4.125 52 2.6
4.25
54 2.7
4.375 56 2.8
4.5
58 2.9
a=4
[mm]
4.625
4.75
4.875
5
5.125
5.25
5.375
5.5
5.625
5.75
5.875
6
6.125
6.25
6.5
6.75
7
7.25
R
[m]
60
62
64
66
68
70
72
74
76
78
80
82
84
86
88
90
95
100
a=10
[mm]
3
3.1
3.2
3.3
3.4
3.5
3.6
3.7
3.8
3.9
4
4.1
4.2
4.3
4.4
4.5
4.75
5
a=4
mm
7.5
7.75
8
8.25
8.5
8.75
9
9.25
9.5
9.75
10
10.25
10.5
10.75
11
11.25
11.875
12.5
1
2
3
4
5
6
7
8
9
10
11
12
13
14
15
16
17
18
*R – distance, a=10 mm – width of a single bar of the bigger pattern; a=4 mm – width of a
single bar of the smaller pattern
Multiple 4-bar targets can speed up measurement process even more. However,
the use of these targets is more risky due to not verified influence on measurement
accuracy in situation when the observer sees several patterns at the same time.
Next, parabolic off axis collimator are theoretically aberration-free but only for onaxis point. Images of 4-bar patters located outside the target center can be distorted
noticeably in case of collimator of low F-number. Therefore, the multiple 4-bar targets should be used only when short measurement time is critical.
Fig. 5.3. Multiple 4-bar target
123
Rotation of the pattern bars always influence test results. The worst results we
can get when the rotation angle is about 45°. However, the standards and specialized literature recommend to carry out the measurements for two cases: vertical
bars (so called horizontal MRTD) and horizontal bars (so called vertical MRTD)
and to average results. In case of staring thermal imagers the difference between horizontal MRTD and vertical MRTD is usually small. Totally inverse situation is in
case of scanning thermal imagers. Horizontal MRTD is usually significantly better
(50% or more) than vertical MRTD (Fig. 5.4). Therefore it is necessary to be very
careful with a target position when testing scanning thermal imagers. A simple 90º
rotation is enough to change drastically test results.
Fig. 5.4. Image of double 4-bar target generated by a scanning thermal imager.
5.1.5 Offset
International standards recommend to carry out MRTD measurements first for
positive patterns, later for negative pattern, and finally to average results [1-4].
The aim of this recommendation is to correct influence of offset effect on MRTD
measurement results. Offset exists when minimal positive temperature difference
(set by the blackbody controller) needed to recognize positive 4-bar pattern of low
frequency target is not equal to minimal negative temperature difference needed to
recognize negative 4-bar pattern of the same target. We can also less accurately say
that offset exists when the observer can recognize 4-bar pattern in situation when
the blackbody controller indicates differential temperature equal to zero. Such
a situation generates a constant bias in differential temperature readout.
There is a set of different factors that could create offset: limited accuracy measurement of target temperature using indirect method (the temperature probe is not
inserted into the target plate but into the rotary wheel wall), difference of emissivity
values of the target plate and blackbody radiator, limited temperature uniformity on
the surface of blackbody radiator, etc.
If the MRTD measurement is done only for positive contrast patterns then offset
can create significant measurement errors. If the MRTD measurement is done for
both positive and negative contrasts, and the results are averaged then influence
of the offset on MRTD results is corrected. However, this offset correction method
is based on assumption that the offset does not change with time. The time from
the moment when MRTD measurement was done for positive contrast to the mo124
ment when MRTD measurement was done for negative one can be estimated as
2-4 minutes. Offset can change quite significantly during that time if tests are carried out at room of low stability of ambient temperature and the test system is not
protected well against ambient temperature variability.
As we see, the effectiveness of the offset correction method depends directly on
temporal stability of the temperature difference between the target and the blackbody; indirectly - on quality of a test system and the environmental conditions in
the test room. Therefore it is highly recommended to use for MRTD measurement
of modern cooled staring thermal imagers (the highest requirements) only test systems that of highly reduced offset variations. If not, the measurement results at low
spatial frequency range shall not be repeatable.
If ofset stability is confirmed then we have an opportunity to speed up measurement process. We can first correct the offset and next carry out MRTD measurements only for positive contrast.
In case of most test systems offset can be easily measured and later eliminated
using blackbody controller. It can be measured and later calculated using this formula:
offset = (∆T+ + ∆T− ) / 2 .
(5.5)
∆T+ is the minimal positive temperature difference when the observer recognizes
the target and ∆T- is the minimal negative temperature difference when the observer
can recognize the target.
When offset was calculated using the formula presented above the observer
should insert offset value into electronic memory of the controller. Then the bias in
indications of differential temperature is eliminated and we can consider the test
systems as “offset free” at least for some limited time.
5.1.6 Imager settings
Observers are allowed to regulate all imager settings until they consider that
they get the best image during MRTD measurement. Here we present several
guidelines:
a) set gain (contrast) to maximum (during measurements when low frequency
targets are used),
b) set brightness (level) to average position,
c) set edge improvement (electronic boost) off when MRTD is measured at
low frequency range,
d) set edge improvement (electronic boost) on when MRTD is measured at
medium/high frequency range.
These guidelines should not be treated as “must to do” conditions. There are imagers when at different settings better test results can be get.
125
There are many thermal imagers with built in display. For such imagers, two
display configurations are possible: 1)test are carried out using original imager display; 2)tests are carried out using a special high quality monitor. The first approach
is recommended as only then we can get information about real capability of tested
thermal imagers.
5.1.7 Static/dynamic images
Classical MRTD definition refers to static targets and MRTD is generally
a measure of imager ability to detect, recognize and identify static targets. However,
during real work of thermal imagers the image of static targets becomes slightly
dynamic due to imager movement (human hands vibration when portable imager is
kept; movement or vibration of a tank equipped with a thermal imager etc). Next,
the head of the observer is rarely fully static during real work, too. Therefore it
looks logically that the observers should be allowed to move slightly both the imagers and their heads during MRTD measurement to simulate real work conditions.
It can surprise but minimal movements of the imager can quite significantly improve MRTD measurement results particularly in case of non cooled imager with
high fixed pattern noise due to phase effects. In case of staring imagers, when the
imager is slowly vibrating it is often easier to detect 4-bar pattern in comparison to
situation when the imager is fully stabilized.
5.1.8 Differential temperature steps
Stanag 4349, Measurement of minimum resolvable thermal difference (MRTD)
of thermal cameras that regulates measurement of MRTD of thermal imagers
presents precise guidelines about steps of differential temperature that should be
used during test procedure (Table 5.4). These recommendations were perfect two
decades ago when typical temperature resolution of thermal imagers was about
200 mK. Regulation of differential temperature with 10 mK step is perfectly
acceptable for such imagers. However, regulation of differential temperature with
10 mK step is totally not acceptable in case of modern thermal imagers; particularly
cooled staring imagers of temperature resolution often below 20 mK. Next,
the recommendations about steps for temperature differences over 2°C are useless
because this temperature range is not practically used during tests of modern
sensitive thermal imagers.
Therefore the author updated the table with
recommended differential steps to the form shown in Table 5.5.
Table 5.4. Recommended steps of differential temperature during MRTD measurement.
∆T
below 0.5°C
0.5°C – 1.0 °C
1°C – 2.0 °C
step
0.01 °C
0.02 °C
0.05 °C
∆T
1°C – 2.0 °C
2°C – 8.0 °C
over 8.0 °C
126
step
0.1°C
0.2°C
0.4°C
Table 5.5. Updated recommended steps of differential temperature during MRTD measurement.
∆T
<0.02°C
0.02°C – 0.1 °C
0.1°C – 0.5 °C
step
0.002 °C
0.005 °C
0.01 °C
∆T
0.5°C – 1.0 °C
1°C – 2.0 °C
1°C – 2.0 °C
step
0.02 °C
0.05 °C
0.1°C
5.1.9 Measurement methods
There are two basic methods to measure MRTD:
1. Keep constant spatial frequency and vary temperature difference,
2. Keep constant temperature difference and vary spatial frequency.
In case of classical test systems (variable target test system), only the first method is
possible. In case of variable distance test systems, both methods can be used; but
practically the second method is applied.
In case of the first method, in order to measure MRTD at one measurement point
spatial frequency is kept constant but temperature difference varies. Practically, this
means that a single target is used but the observer regulates temperature difference
between the bars and the background until he finds that he can recognize the 4-bar
pattern. The procedure is repeated by several observers and then a target is exchanged and measurement of a new MRTD point is carried out.
In case of the second method, in order to measure MRTD at one measurement
point, temperature difference is kept constant but spatial frequency varies. Practically this means that the blackbody controller keeps constant temperature difference
but the distance between the test system and the tested imager is slowly increased
(spatial frequency is increased) until the observer finds that this is the highest distance when he still can recognize the 4-bar pattern. The procedure is repeated by
several observers and then new temperature difference is set and measurement of
a new MRTD point is carried out.
127
MRTD [K]
100
10
1
0.1
0.01
0
1
2
3
5
4
Spatial frequency
ν
6
[1/mrad]
Fig. 5.5. MRTD measurement results of three observers using the constant spatial frequency and variable temperature measurement method.
MRTD [K]
100
10
1
0.1
0.01
0
1
2
3
5
4
Spatial frequency
ν
6
[1/mrad]
Fig. 5.6. MRTD measurement results of three observers using the constant temperature
difference and variable spatial frequency method.
Both methods should deliver the same final MRTD curve. The advantage
of the first method is semi-automatic control of the temperature difference
and the spatial frequency (target number) using the test software. Next, the variable target test systems that use this method require little space to carry out measurement and the tests can be carried out even in a small room.
The variable-distance test systems require usually manual change of the distance
between the imager and the test system. Next, more space is required during the test
128
procedure. A long corridor of 20-50 m length is typically required but in case
of tests of long range thermal imagers longer distances are sometimes needed.
These requirements create logistical problems for some potential users of test equipment.
There are, however, several serious advantages of the variable-distance test systems. First, the measurement speed is high in case of testing portable thermal imagers or in any case when a distance change can be quick. Second, a big advantage
of the variable distance test systems is the possibility of carrying out measurement
at any spatial frequency. We must remember, that in case of variable target image
projectors measurement or MRTD can be carried out only at spatial frequencies
that are equal to spatial frequencies of the set of 4-bar targets the user posses. This
latter feature saves a lot of problems and money when it is necessary to test different thermal imagers at different spatial frequencies. Third, the variable-distance test
systems can be optionally used at field conditions to enable testing thermal imagers
located at their mechanical carriers. Please note however that it is difficult to carry
out accurately MRTD measurement at field conditions due to possible influence of
environment conditions on measurement results. It is necessary to protect the test
system against wind, direct sun, rain, etc. In other words, it is necessary to achieve
relatively stable ambient temperature to enable accurate MRTD at field conditions.
It is typically done by using some kind of protection of the test equipment: buildings with open window or door, tents, etc.
A. Case of variable target test system
Here a detail procedure for MRTD measurement using a variable target test
system is presented.
1. Write down basic test data: imager type, imager serial number, its field
of view; date of the test; number and names of the observers; ambient
temperature; collimator transmittance; orientation (vertical or horizontal)
of the bar pattern.
2. Fix to the rotary wheel a set of 4-bar targets keeping proper bar pattern
orientation. Spatial frequencies of the targets should be equal to spatial
frequencies of the needed measurement points. The targets should be
arranged in the following order: the largest target of the lowest spatial
frequency becomes target no 1, the smallest target of the highest spatial
frequency gets the highest number on the wheel.
3. Put the tested thermal imager at the output of the collimator. The imager
should look into the collimator. Attention: the optics of the imager should
be kept as close to the hole in the collimator output wall as possible.
4. Turn on the imager.
5. Turn on the blackbody controller.
6. Wait for at least 15 minutes. Give time for both the imager and the test
system to reach thermal equilibrium.
7. Set temperature difference equal of the blackbody controller to 2ºC.
129
8. Put target of the lowest spatial frequency in the active position (the position
when target is located at collimator focal plane and can be seen by
the tested thermal imager).
9. Focus the imager until you get a sharp image of the 4-bar pattern.
10. Rotate the imager until the image of the 4-bar pattern is located in the
center of imager field of view.
11. Set using the blackbody controller temperature difference equal to zero.
12. Increase slowly (see recommended steps of differential temperature
showed in Table 5.5) positive temperature difference until observer I starts
to recognize 4-bar patter. Write the current temperature difference value as
ΔT+ to Table 5.7.
13. Decrease slightly the positive temperature difference until the 4-bar pattern
disappears.
14. Exchange observers.
15. Increase slowly positive temperature difference until observer II starts
to recognize 4-bar pattern. Write the current temperature difference value
as ΔT+ to column 7 of Table 5.7.
16. Decrease slightly the positive temperature difference until the 4-bar pattern
disappears. Exchange observers.
17. Increase slowly positive temperature difference until observer III starts
to recognize 4-bar pattern. Write the current temperature difference value
as ΔT+ the Table 5.7.
18. Decrease temperature until the observer I starts seeing negative 4-bar
target. Typically it is needed to get temperature difference below zero
to see negative 4-bar target. However, in case of test systems with
a significant offset the negative target can be seen even for positive
temperature differences close to zero (see exemplary case in Table 5.7).
Write the current temperature difference value as ΔT- to Table 5.7.
19. Decrease slightly the negative temperature difference until the 4-bar pattern
disappears. Exchange observers.
20. Increase slowly negative temperature difference until observer II starts to
recognize 4-bar pattern. Write the current temperature difference value as
ΔT- to Table 5.7.
21. Decrease slightly the negative temperature difference until the 4-bar pattern
disappears. Exchange observers.
22. Increase slowly negative temperature difference until observer III starts
to recognize 4-bar pattern. Write the current temperature difference value
as ΔT- to Table 5.7.
23. Exchange targets using the rotary wheel. Target number 2 should be placed
in the active position.
24. Repeat points 8-18.
25. Repeat points 19-20 until the MRTD measurement was done for all 4-bar
targets.
130
26. Calculate MRTD values for each observer as an average from recorded
positive temperature differences ΔT+ and negative temperature differences
ΔTMRTD = ∆ T =
∆ T+ − ∆ T−
.
2
Fill the ΔT columns for each observer in the test results table.
27. Calculate raw measurement MRTDm as an average MRTD
from each observer
(5.6)
MRTDm=(ΔT1+ΔT2+...+ΔT n)/n ,
(5.7)
where MRTDn is measurement result for n observer (n=3 in case presented
in Table 5.7) . Fill the MRTDm column.
28. Correct the raw measurement MRTDm results using this formula
MRTDcor=MRTDm cor(Ta) τcol
(5.8)
where cor(Ta) is the correction coefficient (see Table 5.1) and τcol is transmittance of the collimator. Fill the MRTDcor column.
The procedure presented above enables us to measure MRTD at one orientation.
The exemplary data shown in Table 5.6 and Table 5.7 refer to vertical bar orientation that enabled to measure horizontal MRTD. In order to measure vertical
MRTD it is necessary to change orientation of the single 4-bar targets fixed to the
rotary wheel on horizontal orientation, and to repeat the earlier presented algorithm
and insert the test results to Table 5.8.
Attention: If double 4-bar targets (see Fig. 5.2) are used then both horizontal MRTD
and vertical MRTD can be measured at one measurement process.
Table 5.6. Exemplary test conditions.
No
Test conditions
Value
1
Imager name, type, number and field Marico, cooled 8-12 μm, no 232,
of view
FOV: 2°x1.5°
2
Number of observers and names
3 (F. Fotell, K. Novak, Y. Russon)
3
Test date
November 12,2006
4
Test place
Factory laboratory no 10
5
Test system type and number
DT 2000 no A12/2005
6
Ambient temperature
16°C (correction coefficient 0.98)
7
Collimator transmittance
0.94
8
Target type and bars position
Single 4-bar pattern, vertical position
131
Table 5.7. Exemplary table with horizontal MRTD test results.
Observer I
N a
o
ν
ΔT+
ΔT-
Observer II
ΔT+
ΔT+
ΔT-
ΔT3 MRTDm MRTDcor
1 2,00 0,50 -0,02 0,08 0,05 -0,02 0,08 0,05 -0,03
0,09
0,06
0,05
0,05
2 1,00 1,00 -0,05 0,11 0,08 -0,07 0,13
0,1
-0,09
0,15
0,12
0,1
0,09
3 0,67 1,50 -0,13 0,19 0,16 -0,17 0,23
0,2
-0,22
0,28
0,25
0,2
0,19
4 0,50 2,00 -0,27 0,33
0,3
-0,34 0,4
0,37 -0,37
0,43
0,4
0,36
0,33
5 0,40 2,50
0,47 0,53
0,5
-0,55 0,61 0,58 -0,61
0,67
0,64
0,57
0,53
6 0,33 3,00 -0,77 0,83
0,8
-0,84 0,9
0,87 -0,87
0,93
0,9
0,86
0,79
7 0,29 3,51 -1,47 1,53
1,5
-1,47 1,53
1,5
-1,77
1,83
1,8
1,6
1,47
8 0,25 4,00 -3,17 3,23
3,2
-2,97 3,03
3
-3,47
3,53
3,5
3,23
2,98
ΔT1
ΔT-
ΔT2
Observer III
a - bar width in mm; ν - spatial frequency in lp/mrad; ΔT - temperature difference in °C units;
MRTD - in °C units
Table 5.8. Exemplary table with vertical MRTD test results.
Observer I
Observer II
Observer III
N a
o
ν
1 2,00
0,50 -0,03 0,09 0,06 -0,02 0,08
0,05 -0,03
0,09 0,06
0,06
0,05
2 1,00
1,00 -0,06 0,12 0,09 -0,05 0,11
0,08 -0,09
0,15 0,12
0,1
0,09
3 0,67
1,50 -0,15 0,21 0,18 -0,19 0,25
0,22 -0,27
0,33
0,3
0,23
0,21
4 0,50
2,00 -0,32 0,38 0,35 -0,37 0,43
0,4 -0,52
0,43 0,47
0,43
0,4
5 0,40
2,50 -0,62 0,68 0,65 -0,67 0,62
0,64 -0,77
0,73 0,75
0,72
0,66
6 0,33
3,00 -1,07 1,13
1,1 -1,37 1,43
1,4 -1,37
1,43
1,4
1,3
1,2
7 0,29
3,51 -3,47 3,53
3,5 -3,17 3,23
3,2 -3,37
3,43
3,4
3,37
3,1
8 0,25
4,00 -
ΔT+
ΔT-
-
ΔT+
ΔT1
-
-
ΔT-
-
ΔT2
-
ΔT+
-
ΔT-
-
ΔT3 MRTDm MRTDcor
-
-
-
a - bar width in mm; ν - spatial frequency in lp/mrad; ΔT - temperature difference in °C units;
MRTD - in °C units
The measurement algorithm presented earlier generated two significantly different MRTD curves: horizontal MRTD and vertical MRTD. This is a typical situation
for scanning thermal imagers: horizontal MRTD significantly better than vertical
MRTD particularly in high frequency range. In case of staring thermal imagers
the differences between horizontal MRTD and vertical MRTD are typically small,
sometimes negligible. There is also no rule which MRTD is better for staring imagers.
132
MRTD [deg C]
2
0,63
0,2
0,06
0,02
0
0,5
1
1,5
2
2,5
3
3,5
4
4,5
frequency [1/mrad]
Fig. 5.7. Exemplary horizontal MRTD and vertical MRTD measurement results (squares – horizontal MRTD; triangles – vertical MRTD, no symbols – average MRTD).
There is a question of big importance what to do when there is a difference
between horizontal MRTD and vertical MRTD. People usually prefer to get a single
MRTD curve instead of MRTD curves. The problem is that we will get slightly different MRTD curves depending on averaging method we choose: to average temperatures or to average spatial frequencies, to use algebraic averaging or geometric
averaging. Literature proposals are inconsistent in this matter. The author typically
uses frequency averaging using algebraic mean method because this way can be
used for all measurement points
(5.9)
νav=(νh + νv)/2 ,
where νh is the spatial frequency of horizontal MRTD curve at ΔT level, νv is
spatial frequency of vertical MRTD curve at ΔT level, νavg is average spatial
frequency of MRTD curve at ΔT level.
The algorithm to calculate average MRTD curve is based on three steps.
1. Determine functions that approximate (interpolate) measured MRTDh and
MRTDv data. Two functions are obtained: MRTDh (ν) and MRTDv (ν).
2. Calculate νh and νv at several levels of temperature difference ΔT: MRTDh
and MRTDv(ν).
3. Use formula (5.9) to calculate νav at several levels of temperature
difference ΔT.
After carrying out these three-step algorithm the average MRTD can be calculated
as in exemplary case presented in Fig. 5.7.
Please note that, other options of calculation of average MRTD are also possible as
long as it is clearly stated in the test report what method was used.
133
The presented earlier in detail classical measurement procedure is time consuming; particularly if imagers of several fields of view are to be tested. For each FOV
a separate MRTD curve should be measured; both horizontal MRTD and vertical
MRTD. The measurement procedure can be speed up if horizontal MRTD and vertical MRTD could be measured at the same time using the same target. It can be
done if a double pattern 4-bar target is used instead of a typical single pattern 4-bar
target (Fig. 5.2). Next, the measurement procedure can shorten more if MRTD is
measured only for positive contrast targets. Such a solution is acceptable only is
the offset is stable and was corrected to a negligible level.
It means that MRTD measurement can be made for positive contrast targets
only for test systems of small offset and having additionally some kind of offset
monitoring. Generally the test team should be informed about offset temporal
changes.
Next, it is always recommended at the beginning of testing a new thermal imager to
make offset measurement, correct offset using available software tools, and only
then to carry out MRTD measurement for positive contrast targets.
The simplified MRTD measurement algorithm for positive contrast is presented
below.
1. Carry out preliminary points 1-6 of the classical algorithm.
2. Set differential temperature to equal zero. Regulate slowly temperature
difference around zero. Determine the minimal positive temperature
difference when the observer recognizes the target ∆T+. Determine
the minimal negative temperature difference ∆T- when the observer can
recognize target. Calculate the offset as
offset = (∆T+ + ∆T− ) / 2
(5.10)
3.
4.
5.
6.
7.
Attention: Both ΔT+ or ΔT- can be positive or negative numbers.
Insert the offset value to blackbody software memory (please refer to
blackbody operational manual). Blackbody indications are corrected and
offset influence is eliminated.
Increase slowly (see recommended steps of differential temperature
showed in Table 5.5 positive temperature difference until observer I starts
to recognize the vertical 4-bar pattern. Write the current temperature
difference value as horizontal ΔT+ to test results table.
Decrease slightly differential temperature until both patterns disappear and
then increase it slowly until observer I starts to recognize horizontal 4-bar
pattern. Write the current temperature difference value as vertical ΔT+ to
test results table.
Exchange observers.
Repeat the previous two points until all observers carried out MRTD measurements for the current target (spatial frequency point)
Exchange targets using the rotary wheel for a new target of higher spatial
frequency.
134
8. Repeat points 3-6 until MRTD measurement was done for all targets.
9. Calculate MRTD values for each observer at one spatial frequency as the
recorded positive temperature differences ΔT+
MRTD = ∆ T+
Fill the columns of the test results table.
10. Calculate raw measurement MRTDm as an average MRTD from each observer
MRTDm=(MRTD1+MRTD2+...+MRTDn)/n
(5.11)
where MRTDn is the measurement result for n observer. Fill the MRTDm
column.
11. Correct the raw measurement MRTDm results using this formula
MRTDcor = MRTDm cor(Ta) τcol
(5.12)
where cor(Ta) is the correction coefficient (see Table 5.1) and τcol is transmittance of the collimator. Fill the MRTDcor column.
Table 5.9. Exemplary table with horizontal MRTD test results using the simplified procedure.
Observer I Observer II Observer III
No a
ν
ΔTh
ΔTh
ΔTh
MRTDm
MRTDcor
1 2,00
0,50
0,05
0,05
0,06
0,05
0,05
2 1,00
1,00
0,08
0,1
0,12
0,1
0,09
3 0,67
1,50
0,16
0,2
0,25
0,2
0,19
4 0,50
2,00
0,3
0,37
0,4
0,36
0,33
5 0,40
2,50
0,5
0,58
0,64
0,57
0,53
6 0,33
3,00
0,8
0,87
0,9
0,86
0,79
7 0,29
3,51
1,5
1,5
1,8
1,6
1,47
8 0,25
4,00
3,2
3
3,5
3,23
2,98
a - bar width in mm; ν - spatial frequency in lp/mrad; ΔT - temperature difference in °C units;
MRTD - in °C units
135
Table 5.10. Exemplary table with vertical MRTD test results using
the simplified procedure.
No a
ν
Observer
I
Observer II
Observer III
ΔTv
ΔTv
ΔTv
MRTDm MRTDcor
1 2,00
0,50
0,06
0,05
0,06
0,06
0,05
2 1,00
1,00
0,09
0,08
0,12
0,1
0,09
3 0,67
1,50
0,18
0,22
0,3
0,23
0,21
4 0,50
2,00
0,35
0,4
0,55
0,43
0,4
5 0,40
2,50
0,65
0,7
0,8
0,72
0,66
6 0,33
3,00
1,1
1,4
1,4
1,3
1,2
7 0,29
3,51
3,50
3,2
3,4
3,37
3,1
8 0,25
4,00
-
-
-
-
-
The test procedure can be shorten even more if measurements are made by only
one, but well trained observer. It is a risky solution but if it was earlier verified that
the observer indications are close to group of average indications then the solution
can be considered as acceptable.
B. Case of variable distance test system
Variable distance test systems are systems built using a large area blackbody
integrated with a large area multi-pattern target surrounded by a special shield.
Multi-pattern target can be built using a set of different patterns. However, two
double 4-bar patterns shown in Fig. 5.8 are typically used as such multi-pattern targets [8]. The target plate is not changed during measurements and the pattern linear size of these two 4-bar patterns is constant. However, the test team can vary angular size of the 4-bar patterns (spatial frequency of the two patterns) by changing
distance between tested imager and test system.
In case of variable distance test systems it is typically acceptable to use simplified measurement algorithm and to carry out vertical/horizontal MRTD measurement only for positive contrast after offset correction at the beginning of the test
procedure12.
12
Attention: Stable offset must be confirmed before measurement.
136
Fig. 5.8. Exemplary multi pattern target (black color-holes, white color – metal plate).
It is possible to measure MRTD using a variable distance test system but keeping the same measurement method used by variable target test systems. This means
by keeping constant spatial frequency of the target and changing target temperature difference during measurement of a single MRTD point. It is, however, a rather
slow measurement procedure. When we change temperature difference of the blackbody we must wait typically about 60 s for temperature difference to stabilize.
If we consider that we need often ten steps or more to find proper temperature
difference then we see that measurement of a single MRTD point can take a dozen
or more minutes. Therefore, in case of variable distance systems MRTD is typically
measured by keeping temperature difference constant but changing spatial frequency (distance) even for a single MRTD point. If we can change the distance
quickly then we can save a lot of time by using this measurement method. Therefore this method is highly recommended in case of testing small portable thermal
imagers that can be easily moved. In case of testing bigger thermal imagers it is recommended to regulate a distance by changing position of the test system placed on
a movable platform. It is preferable if the test system is battery powered.
Due to the presented above advantages of the constant temperature-variable spatial frequency method only for this method will be presented. Next, the measurement are shall be only for positive contrast targets. Further on, to simplify procedure only MRTD test results for targets of vertical orientation are presented.
This simplified MRTD measurement algorithm is presented below.
1. Write down basic test data: imager type, number and its field of view; date
of the test; number and names of the observers; ambient temperature. As
in the previous case we assume that ambient temperature equals 16°C
(correction coefficient 0.98).
2. Calculate spatial frequencies of the 4-bar patterns at different distance
imager-test system (or use data provided by the manufacturer of the test
system like in the form shown in Table 5.3).
3. Turn on the blackbody controller. Set temperature difference equal to 2ºC
(or more).
4. Turn on the imager. Put the imager at a short distance that can be
considered as the minimal imager focus distance. To determine this
137
distance please check imager specifications or simply reduce the distance
until the image of the target becomes blurred13.
5. Wait at least 15-30 minutes to enable both the imager and the test system to
work in stable conditions.
6. Correct blackbody offset. Set differential temperature to equal zero.
Regulate slowly this temperature around zero and determine the minimal
positive temperature difference when the observer recognizes the target
∆T+
and the minimal negative temperature difference ∆T- when
the observer can recognize target. Calculate offset as
offset = (∆T+ + ∆T− ) / 2
7.
8.
9.
10.
11.
12.
13.
14.
15.
16.
17.
18.
19.
20.
21.
(5.13)
Attention: ΔT+ or ΔT- can be positive or negative numbers.
Insert the offset value to blackbody software memory (please refer to
blackbody operational manual). Blackbody indications are corrected and
offset influence is eliminated.
Regulate temperature difference of the test system to get value equal to
12 mK. If the 4-bar pattern cannot be resolved then increase the temperature difference to 25 mK or more (50 mK, 100 mK).
Increase gradually a distance between test system and the tested imager to
find the longest distance when you can still recognize the 4-bar pattern
(two patterns can be used: big or small)
Convert the value of the distance in meters to spatial frequency in lp/mrad
using Table 5.3.
Insert the measured value of the spatial frequency to Table 5.11.
Increase temperature difference to 25 mK and repeat points 7-9.
Increase temperature difference to 50 mK and repeat points 7-9.
Increase temperature difference to 100 mK and repeat points 7-9.
Increase temperature difference to 200 mK and repeat points 7-9.
Increase temperature difference to 400 mK and repeat points 7-9.
Increase temperature difference to 800 mK and repeat points 7-9.
Increase temperature difference to 1600 mK and repeat points 7-9.
Repeat points 6-17 by the second observer.
Repeat points 6-17 by the third observer.
Calculate average spatial frequency of the 4-bar target that can be resolved
using this formula
(5.14)
νav=(ν1 + ν2 + ν3 )/n ,
where n means number of observers.
Fill the suitable column.
Correct the raw measurement MRTDm using this formula
13
The latter method is recommended because in specifications manufacturers usually repeat
requirements developed by military who are not interested in very short distances. Therefore real
minimal focus distance is usually a few times lower that value shown in specifications.
138
MRTDcor= MRTDm cor(Ta) τa ,
(5.15)
where cor(Ta) is the correction coefficient (see Table 5.1) and τa is effective
atmospheric transmittance (typically equal to one). Fill the suitable
column.
When the presented above measurement procedure is carried out we get eight measurement points and shape of MRTD curve determined accurately. Four measurement points can be still considered as satisfactory high number for typical tests. If
MRTD of tested imager can be roughly predicted then the number of measurement
points can be reduced to three points.
Test results obtained using the presented measurement algorithm are shown in
Table 5.11. Please note that the test results shown in Table 5.11 obtained using
a variable distance test system are almost the same as test results shown in Table
5.9-Table 5.10 obtained using a variable target test system. Therefore the conclusion
is that if properly used then both two types of test systems generate the same test
results. It should be also noted that in case of measurement using the exemplary
variable test system two 4-bar patterns of different bar width (8 mm and 4 mm)
were used. Bigger 4-bar pattern (8 mm bar width) was used during measurement at
low frequency points; smaller (4 mm bar width) at high frequency range). This
solution was used in order to minimize the distance needed to carry out MRTD
measurement at the required spatial frequency range from 0.5 lp/mrad to 4 lp/mrad.
Table 5.11. Exemplary table with vertical MRTD test results obtained using a variable distance
test system.
Temperature difference [K]
MRTDm
MRTDcor
Spatial frequency [lp/mrad]
ν1
ν2
ν3
νav
0.0120
0.0118
x
x
x
x
0.025
0.0245
x
x
x
x
0.05
0.049
0.51
0.5
0.49
0.49
0.1
0.098
1.03
1
0.96
0.96
0.2
0.196
1.55
1.51
1.45
1.45
0.4
0.392
2.06
2.02
1.97
1.97
0.8
0.784
3
2.92
2.95
2.95
1.6
1.568
3.54
3.52
3.4
3.4
139
10
1
MRTD [K]
0
1
2
3
4
0,1
0,01
spatial frequency [lp/mrad]
Fig. 5.9. MRTD measurement results obtained using two methods: squares – variable target method, triangles – variable distance method.
5.1.10 Software support
The MRTD is a subjective parameter that describes ability of the imager-human
system for detection of low contrast details of the observed object. The human is to
make decision when he can resolve the thermal image of the bars. Therefore computer technology is not generally needed during MRTD measurements. However
software support can still be useful during MRTD measurements. Most manufacturers of equipment for testing thermal imagers provide also computer programs
that help human observer to carry out MRTD measurement.
In detail the tasks of these support programs are following:
1. Recording measurement conditions (imager name or other identification
data, number of observers, test date, test place, ambient temperature, collimator transmittance, collimator focal length, test orientation),
2. Calculation of spatial frequency of 4-bar targets in lp/mrad on the basis
of known bar width in mm unit,
3. Correction of influence of measurement conditions on test results (correction of influence of ambient temperature and of collimator transmittance)
4. User friendly control from PC of blackbody temperature and position
of rotary wheel
5. Presentation of MRTD measurement results in form of tables and graphs.
6. Recording test results.
140
Fig. 5.10. Windows of TCB Control program used for support of MRTD measurement [8].
5.1.11 Interpretation of MRTD measurement results
MRTD tests generate two functions: horizontal MRTDh(ν) and horizontal
MRTDv(ν) that can be graphically represented as two separate curves. MRTD requirements usually do not refer directly to horizontal MRTD or vertical MRTD but
to MRTD in general.
As it was mentioned in Section 5.1.9 there is no consensus in specialist literature what averaging method should be used (algebraic mean or geometric mean;
temperature averaging or frequency averaging). Literature proposals are inconsistent in this matter. The author typically uses frequency averaging using algebraic
sum because this method can be used for all measurement points. However, other
options are also possible as long as it is clearly stated in the report what methods
was used.
Even when MRTD test results are presented in form of a single curve it is often
not easy to decide whether the tested imager fulfills the MRTD requirements or
not. Now, let us assume that after measurements we get the average MRTD curve
shown in Fig. 5.7. Next, let us consider several versions of requirements on imager MRTD shown in Table 5.12 and find out whether the tested thermal imager
fulfills these requirements.
141
Table 5.12. Exemplary requirements on MRTD of a thermal imager.
frequency[lp/mrad]
MRTD requirements
Version A
Version B
Version C
Version D
0,5
<0,12°C
<0,02°C
<0,1°C
0,04
1,5
<0,35°C
<0,1°C
<0,25°C
0,16
2,5
<0,95°C
<0,3°C
<0,55°C
0,5
3,5
<3,5°C
<1,3°C
<1,9°C
1,7
Before we decide whether the imager fulfills MRTD requirements we must
consider the fact that only measurement result with error (uncertainty) indicator is
truly valid measurement data. It is frequently reported in literature that during
MRTD measurement variability as high 50% are often cited from laboratory-tolaboratory and 20% at one laboratory [3]. Let us assume this worst case scenario of
50% measurement error. MRTD measurement results (with 50% measurement errors) of the analysed imager and exemplary three versions of MRTD requirements
are shown in Fig. 5.11.
10
MRTD
1
0,1
0,01
0
0,5
1
1,5
2
2,5
3
3,5
4
frequency [lp/mrad]
Fig. 5.11. MRTD test results (continuous curve with errors bars) and three different versions of
MRTD requirements (version A – triangles down; version B-triangles up; version Csquares, version D-double triangles).
It is clear that in case A the tested thermal imager fulfills the MRTD
requirements. It is also clear that in case C the tested imager does not fulfill
the requirements. There is however a question what should be a proper decision in
case B and case D. There is no clear answer what to do in this situation in
142
international standards and literature. Totally different decisions can be taken on
the basis of the presented above data:
1. Thermal imager fulfills requirement only in case A. This is the worst
scenario for manufacturer but very safe situation for the final user.
2. Thermal imager fulfills requirement in case A, B and D. This scenario
assures that no good imager is classified as non-fulfilling specifications
but this scenario is very risky for the final user.
3. Thermal imager fulfills requirement in case A, B. Now the risk due to
limited accuracy of MRTD measurement method is divided fifty to fifty
between the manufacturer and the final user.
The decision which interpretation method should be applied to the MRTD test
results should be determined immediately when MRTD requirements are decided.
As we see in the example presented earlier not only MRTD measurement results
are important but also method of their interpretation.
5.2 MTF
5.2.1 Measurement concept
Modulation Transfer Function (MTF) is a measure of sharpness (or blurring) of
images generated by thermal imagers, or in general by any imaging system. There
are over a dozen possible methods to measure MTF of imaging systems. However,
in case of testing thermal imagers only two measurement methods are typically
used.
Method one, an image of a slit target generated by tested imager is acquired ,
analysed and MTF of the tested imagers is calculated as a module from Fourier
transform of Line Spread Function (normalized blur distribution in the image of the
narrow slit target)
(5.16)
MTF(ν )=│F[LSF(x)]│.
Method two, an image of an edge target generated by tested imager is acquired,
analyzed and later MTF of tested imager is calculated as a module from Fourier
transform of the differentiated Edge Spread Function (normalized blur distribution
in the image of the edge target)
(5.17)
MTF(ν )=│F[ESF'(x)]│.
Both methods are characterized by some advantages and disadvantages.
A. Slit method
1. Low sensitivity to noise inherent in image to be analysed (+),
2. Measurement result must be corrected depending on width of the slit used
for measurement (-),
3. Several slit targets are needed when testing imagers of different field
of view (-),
4. High temperature difference (over 10 K or more) is required as assure
a clear image of the slit target (-).
143
B. Edge method
1. High sensitivity to sensitivity to noise inherent in image to be analysed (-),
2. One edge target enables measurement of MTF of any type of thermal imagers (+),
3. Low temperature difference (over 3 K) is required as assure a clear image
of the edge target (+),
4. It is technologically easier to manufacture high quality edge target than slit
target (+).
Due to lower sensitivity to noise the slit target method was the preferred MTF
measurement method in the past. Noways, manufacturers of equipment for testing
thermal imagers generally prefer measurement of MTF of thermal imagers using
edge target method [8,10]. Therefore only the edge method shall be discussed later
in details. However, it should be reminded that the edge method is a modified slit
method because differentiated Edge Spread Function equals Line Spread Function.
Finally, we should remember that if properly applied then both two
measurement methods should generate the same MTF measurement results.
Typical simplified measurement principle used by most modern test systems for
MTF measurement is presented below.
1. Projection of an image of the edge target by the collimator into direction
of tested imager.
2. Tested imager generates a blurred copy of projected image of the edge target.
3. Frame grabber captures images generated by the tested imager.
4. Test software using the frame grabber captures images, of the edge target,
generated by the tested imager.
5. Test software carries analysis of the captured images, calculates MTF
function, and presents the measured data in a graphical form or in form
of a table.
Practical implementation of this algorithm is not so simple as there are high requirements on both collimator, target, blackbody, frame grabber and test software
that must be fulfilled to generate accurate measurement results:
•
Collimator: to generate image of the edge target without any noticeable degradation of image quality
•
Blackbody: to generate a stable uniform image of the edge target (requirement on temperature temporal stability and temperature uniformity)
•
Edge target: the angular differences between the real edge and the ideal
edge must be many times smaller than the angular size of pixel of the
tested thermal imager (requirement on manufacturing accuracy of the target
edge)
•
Frame grabber: to enable capturing image of the edge target generated by
the tested imagers without any noticeable degradation of quality of the
captured image (requirement on ability to capture images from imagers
144
generating electronic image signals in different standards: PAL, NTSC,
FireWire, USB 2.0, CameraLink, GigE)
•
Test software: user friendly software that enables calculation of MTF using
advanced algorithms resistible to noise inherent in captured images.
As we can see, typical test systems used for MRTD measurement (built from the
following modules: collimator, blackbody, rotary wheel, set of targets, frame grabber, PC, test software) are also used for MTF measurements. The only difference in
hardware blocks is that the edge target is used for this measurement instead of typical 4-bar targets.
5.2.2 Measurement procedure
Different manufacturers use slightly different detail measurement procedures
of MTF measurement. Here we will present simplified typical MTF measurement
procedure.
1. Rotation of the rotary wheel with the targets using the control software until the edge target is in the active position (the target is at the collimator focal plane and can be seen by tested thermal imager). The edge target should
be vertical if horizontal MTF is to be measured, horizontal if vertical MTF
is to be measured.
Some manufacturers use also “tilted MTF” measurement method when
the edge target is not horizontal or vertical but tilted by 45º. This method
can increase measurement accuracy in case when blurring in the analyzed
image is very small (smaller than about 3-5 pixels).
2. Setting proper settings of thermal imager: typically Gain to minimal, Level
to average.
3. Regulation temperature difference (differential mode) using control software until a clear image of the edge target can be seen. Typically differential temperature in the range from about 2 K to 8 K is used. The contrast
of the target should be moderate. It should be avoided situation when bright
semi-moon target is very white and background is very dark. The situation
when the contrast of the target and background is low should be also
avoided. Generally the aim is to get situation when both the target temperature and the background temperature are in the linear range of SiTF function of the tested imager. Some manufacturers offer software tools that enable easy checking of brightness of the target and the background to speed
up a process of finding proper contrast of the image of the targets. Situation
when we have brightness of the target in the range from about 120 to 150
(grey levels), brightness of the background in the range from about 60 to
90 can be treated as a safe solution.
4. Focusing of tested thermal imager to get maximal sharpness of image generated by the imager. The sharpness can be evaluated subjectively by human eye but use of objective evaluation tool is recommended. Some manufactures of test equipment offer software modules called “Live MTF” or
145
“Continuous MTF” that enable online measurement of sharpness of edge
image generated by the tested imager [8,10]. User is only requested to
mark a part of the edge to be analyzed.
Due to significant noise in analyzed images accuracy of “Live MTF”
measurement is high and true measurement of MTF must be made later
using some noise reduction methods.
a)
b)
Fig. 5.12. a)Image of the edge target with marked area to be analyzed b)MTF graph.
5. Determination of relationship between image dimension in pixels and true
dimension in angular units (mrad). Knowledge about the edge target dimensions and the collimator focal plane is used to find this relationship.
This operation is often called Distance Calibration. The operation is carried
automatically by software or the user is expected to mark some points on
the image generated by the tested imager.
6. Capturing a video sequence of images of the edge target. A series of images
is captured in order to reduce temporal noise by simple averaging method.
Some test computer programs use also more advanced image processing
techniques that can reduce additionally high frequency spatial noise fixed
pattern noise).
7. Analyzing the image of the edge target after noise reduction process. MTF
of the tested imager is calculated by the test software.
8. Storing the MTF measurement results in form of table, text file, or a graphics.
5.2.3 Interpretation of measurement results
Accurate MTF measurement of thermal imagers is not easy. The same can be
said about interpretation of the measurement results as there are several factors that
can influence measurement accuracy.
First, measured MTF always depends significantly on proper focusing of tested
thermal imager. Therefore, the focusing stage in the MTF measurement procedure
should be done very carefully.
146
Second, MTF measurement results depend often on setting of the tested imager
like gain, level or image processing. Therefore, write down always measurement
conditions (Gain, Brightness, Image processing features etc) used when MTF
measurements were carried out. As we can see in the graph below, MTF of the same
imager can be drastically different when measurements are carried out at different
imager settings. Therefore please compare several thermal imagers only if the imagers were tested having the same settings.
It is typically recommended to have the following settings during MTF measurement: Gain – minimal, Level – medium. However for low Gain in order to achieve
reasonable contrast between the target and the background temperature difference
at level over 2 K are needed. There are however on the market cooled IR FPAs that
show bigger blurring for such temperature difference (due to crosstalk effect) than
for lower temperature difference (below 2 K). For such imagers, it is necessary to
use medium Gain level.
a)
b)
Fig. 5.13. MTF of the same thermal imager: a)Edge enhancement turn off; b)Edge enhancement
turn on.
5.3 Responsivity function (SiTF)
Responsivity function is a function of an output signal (screen luminance,
or electrical signal) versus target temperature (absolute or relative) in case of large,
constant size target. The responsivity function is usually S shaped. The responsivity
function depends strongly on imager settings, like level or gain. There is no a
single responsivity function that could characterize fully even simple thermal imagers. Measurement of at least several functions is need to get precise information
about imager performance at different combinations of gain and level settings.
The responsivity function can be also presented in simpler form of three digital parameters (SiTF, saturation level, and dynamic range) that are determined on
the basis of measurement results of the responsivity function. The signal transfer
function SiTF (or the responsivity) is the most important parameter from the set
of parameters mentioned earlier.
147
The signal transfer function SiTF is determined on the basis of the linear part of
the responsivity function. It is calculated as tangent of the angle between linear part
of the responsivity function and the temperature axis (the slope of the linear part).
Blackbody temperature in mK is typically treated as the input signal and the screen
luminance in digital gray scale levels is treated as the output signal. The formula
used for SiTF calculation is shown below
SiTF =
( S 2 − S1 )
(T2 − T1 )
,
(5.18)
where S1 and S2 are the output brightness of the monitor in grey level units
generated by the input target temperatures T1 and T2. The values of T1 and T2
must be in the linear range of the responsivity function.
Practically, knowledge about responsivity function (or responsivity functions
in most cases) is useful for several reasons.
First, analysis of S shape of the responsivity function deliver precise information if the electrical analog video signal is properly set (case of imagers generating
output image using PAL, NTSC formats). A situation when output signals in the
range from about 0 to 255 are generated by target of temperature in the required
temperature range is usually desired. The "required temperature range" depends on
geographical regions. If the video signal is not properly set, then imager dynamics
can be lower than expected. In other words we can have a situation when image
of even very cold targets shall not be truly black and image of a very hot target is
not white. It is also possible to have a situation when the imager saturates for temperatures from the required temperature range or the screen brightness is zero also
for temperatures of this range.
Second, analysis of captured sequences if images generated by tested thermal
imager can deliver information about all noise parameters: NETD, FPN, non uniformity, 1/f, 3D noise model components, NPSD. However these parameters are
calculated by test software in digital levels as frame grabbers digitize input analog
video images generated by typical thermal imagers. When SiTF is known then
noise parameters can be converted from digital level units to more easy to understand temperature units. The following formula is used for this conversion.
Noise [mK] =
Noise [digital levels]
.
SiTF [digital level/mK]
(5.19)
Measurement principle of both the responsivity function or its simplified form
SiTF is simple.
Tested imager is looking into the blackbody of regulated temperature. Changing
blackbody temperature changes brightness of the blackbody image. The task
of the test software is to regulate blackbody temperature and to measure brightness
of the blackbody image. If temperature regulation span is wide then complete re-
148
sponsivity function is measured. If this span is narrow (and fit properly to the linear
range of the responsivity function), then only SiTF is measured.
Fig. 5.14. Image of a blackbody during responsivity function measurement (white mark- the area
where the brightness is measured).
Typical measurement algorithm of the response function is presented below.
1. Tested imager is looking via collimator into the blackbody of regulated
temperature. Changing blackbody temperature changes brightness of the
blackbody image. Test software acquires images generated by the tested
imager.
2. User marks an area of the blackbody image to be analysed.
3. User determines the temperature regulation range of the blackbody and
temperature regulation step to be used during measurement of the responsivity function.
4. The test software carried out measurement of output brightness of the
blackbody image for different values of blackbody temperature.
5. The responsivity function is presented in a graphical form and table form.
149
Fig. 5.15. A table with exemplary data of measurement of responsivity function (measurements
for low gain settings)
5.4 Noise parameters
5.4.1 Measurement concept
The list of noise parameters is quite long: NETD, FPN, non uniformity, 1/f
noise, 3D noise model components, NPSD. However measurement of all noise
parameters is based on the same concept of capturing a sequence of images
generated by tested imager when viewing an uniform target. Such a sequence
of images carried out information about temporal noise, spatial noise, and noise
frequency spectrum.
Fig. 5.16. Image of an uniform target used for measurement of noise parameters.
150
Analysis of only a sequence of images of uniform target can give information
about imager noise in gray level units (or in volts in analog electrical signal is analysed) not in temperature units as required. The conversion of noise in gray level
units to temperature units can be done only when SiTF is known. SiTF gives information about relationship between input temperature of the target and output
brightness of image of this target. Therefore in order to determine noise parameters we must first measure responsivity function (or SiTF) as described in the previous section. Sometimes measurement of SiTF is treated as part of noise measurement procedure and SiTF is presented together with noise parameters.
Manufacturers of equipment for testing thermal imagers use different measurement procedures to measure noise parameters. These differences can generate some
differences in test results.
The differences can be divided into two groups:
A. Method of generation of uniform image,
B. Type of output signal generated by the tested imager to be analysed: analog
video signal or digital signal.
Uniform image needed for noise measurement can be generated using several
methods:
1. Thermal imager is looking into a small active blackbody (temperature regulation possible) used as a part of a typical variable target test system based
on off axis collimator.
2. Thermal imager is looking into a big blackbody located within focus range
of the tested imager.
3. Thermal imager is looking into a medium size active blackbody (a bit bigger than imager optics) located at very short distance from imager optics.
4. Thermal imager is looking into a passive large blackbody located at short
distance to the imager optics.
5. Thermal imager optics is covered using a cap, black cloth or other materials.
Method number one is the most easiest to be used. The needed blackbody is
a part of typical test systems. However, field of view of tested thermal imagers is
usually much bigger than angular size of image of the blackbody projected by the
collimator. Therefore analysis area is limited only to a part of images generated by
thermal imagers and measurement using this method generates significantly lower
value of spatial noise measurement. Temporal noise is sometimes also lower than
true measurement results for full field of view.
The disadvantage of the methods no 2-3 is the fact that an additional large
size/medium size blackbody is needed for noise measurement. Another option is
that the blackbody used as a part of the variable target test system (if the blackbody
size is big enough to cover the imager optics) must be moved to a new position
very close to the optics of the tested imager.
151
For method no 4, a large passive blackbody of non regulated temperature that
keeps ambient temperature is needed. An advantage of this method is lower manufacturing costs than in case of methods 2-3.
The method no 5 is the simplest and the cheapest. However, temperature distribution on surface of a such a "ad hoc blackbody" is not uniform. At the same time
the temperature distribution is not temporarily stable. Therefore this method generates often non stable test results (particularly spatial noise) and should be avoided.
One of earlier discussed methods to generate uniform image should be used.
All thermal imagers of the past and majority of thermal imagers present on the
market generate images in form of an analog video signal (PAL/NTSC standard).
This means that practically the output image is generated as analog electrical signal.
Therefore, in the past the noise of thermal imagers was almost exclusively measured using typical measuring tools for analog electrical signals: the oscilloscopes.
The measurements results were obtained in Volts units, and later converted into
temperature units.
Frame grabber cards for modern PC units give easy possibility to convert output
analog signal from tested thermal imagers into a digital image. Analysis of digital
images using modern computer technology is much easier than analysis of analog
electrical signals using oscilloscopes (although there are also big improvements in
digital oscilloscopes). Therefore nowadays noise parameters are usually determined
by analysis of sequence of digital images generated by frame grabbers. However,
we should remember that there are still laboratories (mostly manufacturers labs)
where the tests of thermal imagers are done by analysis of analog video signal using
oscilloscopes. However this method of measurement of noise parameters is rarely
used and shall not be discussed later.
5.4.2 Measurement procedure
Measurement of noise parameters of thermal imagers is typically carried out according to the algorithm presented below:
1. Regulation of settings of the tested imager.
If thermal imagers were truly linear imaging systems then noise parameters
would not depend on imager settings like gain or brightness level. However
thermal imagers are only quasi linear systems and measured noise parameters
depend on setting of the tested imager. The tests are typically done for the following settings: Gain: maximal; Brightness level: medium. However it is not
a rule. In any case, the imagers settings (Gain. Level, Image Enhancement)
should be written down for future analysis.
Next, it is critical for successful measurement of noise parameters that the imager setting like Gain/Level should be the same as settings used during measurement of SiTF.
Further on, it is strictly forbidden to use Auto Gain mode during noise measurements.
152
2. Regulation of angular position of the tested imager relative to the uniform target
(or inverse).
As it was discussed in previous section, different methods to generate uniform
image are used. Therefore position of the tested imager relative to the uniform
target (blackbody) can be different. Version one: the imager is looking into
the collimator. Version two: the imager is looking into a large blackbody located
at some distance within imager focus range. Version three: the blackbody is located just behind the imager optics.
3. Marking area of interest.
The blackbody that simulates the uniform target typically fills entire field
of view of tested imager. However, sometimes some parts of video image generated by the tested imager are not active (black frame around the true active image - see Fig. 5.17). This effect is usually met in thermal imagers using IRFPA
modules optimized for resolution of NTSC standard but generating output video
image in PAL standard. If such a case occurs then the user must mark area of
the active part of the image to be analysed. If not measurement results of spatial
noise parameters can be significantly distorted.
4. Capturing of a sequence of images.
Capturing of a video sequence of images of the uniform target is crucial part
of procedure to measure noise parameters. The capturing should be done using
high quality analog frame grabbers (case of imagers generating signal in
PAL/NTSC standard) that do not distort captured images. The same requirements are also valid for the test software. The compressing algorithms of captured frames should not distort the output images in noticeable way. Most typical frame grabbers and video acquisition software are not useful for the task
of capturing images from thermal imagers as these frame grabbers/acquisition
software was optimized for a task of capturing images with significant degradation of image quality in order to save disk memory needed for storing long video
sequences.
There is a different situation in case of professional frame grabbers/acquisition
software capable to capture digital video images in the following standards:
Fire-Wire, USB 2.0, CameraLink, GigE or LVDS.
5. Calculation of noise parameters.
One of the tasks of computer programs offered by manufacturers of equipment
for testing thermal imagers is to do the analysis of the video sequence and calculate the noise parameters. The offered programs differ by the numbers
of noise parameters they calculate and by other features.
On one side, there are computer programs developed only to calculate one parameter (NETD) and to present it in form of a number. On the other side are more
advanced computer programs that calculate not only a long series of noise parameters: NETD, FPN, non-uniformity, 1/f noise, 3D Noise components, NPSD;
but also bad pixel number, bad pixels location; and provide graphical representation of some noise parameters. The choice in this matter belongs to the user
153
of the software depending on the requirements on the test system. Exemplary
noise measurement results are shown in Fig. 5.18 and Fig. 5.19.
Noise parameters depend on ambient temperature, particularly in case of MWIR
thermal imagers. The ambient temperature at which the measurement is carried
out can differ significantly from a typical laboratory temperature about 20ºC. In
such a case the measurement results should be corrected. Most of computer programs used to support testing of thermal imagers can do this task.
6. Storing noise parameters.
Storing measurement results is a simple operation for modern software. However practically it is extremely important to enable storing not only the measurement results in form of several numbers but storing measurement results together with all parameters that describe measurement conditions (gain/level/image enhancement settings of the thermal imager; ambient temperature, test date,
test place, test team, etc. Such data is very useful if comparison of test results
of different imagers is to be made.
Fig. 5.17. Thermal image with non-active parts.
Fig. 5.18. Table with three basic noise parameters: NETD, FPN, non-uniformity.
154
Fig. 5.19. Window of TAS-T program presenting calculation results of VHT components of 3D
noise model.
5.4.3 Interpretation of measurement results
There are quite many reasons why interpretation of noise measurement results is
often difficult.
First, there are no internationally accepted standards that could regulate measurement on noise related parameters of thermal imagers. There are different recommendations in specialized literature. Therefore there is a certain chaos in measurement of noise parameters. A prime example of this chaotic situation is a situation
with the main noise parameter of thermal imagers: the NETD. According to one
school NETD is a measure of only high frequency temporal noise, and FPN is
a measure of high frequency spatial noise. However according to a second school
NETD is a measure of both high frequency temporal noise and high frequency spatial noise. Thus, it is necessary to be very careful in comparison of “NETD” parameter measured by two different test teams.
Second, noise related parameters like NETD, FPN, NU depend on settings
of tested thermal imagers; mostly on Gain (contrast) and Level (brightness) but in
most cases this relationship is not very strong. However, image processing (like
edge enhancement) can change noise measurement results drastically. By pressing
the button “Image enhancement” on the imager keyboard the measured noise parameters can be increased even by a factor of two times. Therefore it is recommended to compare several thermal imagers of the same type only if the tests were carried out for the same settings of the tested imagers.
Third, parameters of some IR FPAs used in modern thermal imagers can vary in
time. Sometimes such effects are noticeable after a dozen minutes even if the ambient temperature is stable. If ambient temperature varies then stronger variation
of noise parameters (NETD, FPN, NU) can be expected. Such a situation most often
155
occurs in case of non cooled imagers, but sometimes occurs also for thermal imagers built using cooled IR FPAs.
Fourth, the noise parameters of thermal imager can vary significantly when
the imager heats up even in case of thermal imagers built using IRFPA modules
of good temporal stability. Therefore the tests should be started not earlier than after
at least 15-30 minutes of work of both the tested imager and the test system. If this
condition was not fulfilled then repeatability of test results can be bad.
To summarize, because of inconsistent literature recommendations, inherent dependency of noise related parameters (NETD, FPN, NU) on imager setting and possible temporal variations the user should not expect very good agreement of measurement noise data with data provided by manufacturer or other laboratories. Agreement at the level about 20-30% should be considered as acceptable situation.
5.5 References
1. ASTM standard E 1213-2002 “Standard Test Method for Minimum Resolvable Temperature
Difference for Thermal Imaging Systems”
2. Holst G.C., Infrared Imaging System Testing, Vol.4, Chapt. 4 in The Infrared & Electro-Optical
Systems Handbook, Michael C. Dudzik ed, SPIE 1993..
3. Holst G.C., Testing and evaluation of infrared imaging systems, JCD Publishing Company
1993.
4. STANAG 4349, Measurement of minimum resolvable thermal difference (MRTD) of thermal
cameras, 1995.
5. www.ci-systems.com
6. www.eoi.com
7. www.hgh.fr
8. www.inframet.com
9. www.optikos.com
10. www.sbir.com
156
6 STANAG 4349 requirements
STANAG 4349 present some technical requirements on equipment used for
testing thermal imagers. Here, there is presented a table with a list of these
requirements and comments about technical capabilities of modern test systems.
The comments can be useful for laboratories that implemented quality systems
according to ISO/EN standards and which need to prove that their test system fulfill
requirements of this well known standard.
Table 6.1. Comments on Stanag 4349.
No
1
2
3
4
5
STANAG 4349 requirement
4. The MRTD is the minimum temperature difference which allows an observer
to resolve a test pattern in accordance
with a given criterion. MRTD is a function of spatial frequency of the test pattern.
NOTE 1: The MRTD measured at a given
temperature can be converted to the
MRTD at other temperatures, if necessary. The conversion factor depends on
the spectral response of the thermal imager and has to be determined in each
case.
5.1. The observer shall have normal visual acuity (post-correction defects less than
+ 0.25 diopters) and good color vision
and be experienced in this type of measurement.
5.2.The test pattern shall be a plate containing four rectangular slots, forming a
square of four bars and three spaces.
Length/width ratio of the rectangular slot
is 7:1.
The space width should be equal to width
of the rectangle. The test pattern is positioned in front of a black body, the temperature of which can be varied, giving a
temperature difference ( at) between the
bars and the spaces.
Test equipment
All manufacturers of test equipment use the same definition of
MRTD.
5.2.1. The spatial-frequency of the
resolving power measurement targets
must be within ±5% of the nominal
value.
Point 5.2.1 presents requirements
on
manufacturing
tolerances of 4-bar targets and
tolerances of focal length of the
157
Test software corrects measurement results depending on ambient temperature and spectral response of tested thermal imager.
Requirement on users of test
equipment. This requirement can
be fulfilled if proper observers are
chosen and trained
Targets for MRTD measurement
are manufactured as a plate containing four rectangular slots,
forming a square of four bars and
three spaces. Length/width ratio of
the rectangular slot is 7:1.Target is
fixed to a rotary wheel that is positioned in front of the blackbody.
6
7
5.2.2. The emissivities of the test pattern
and the black body must both be at least
0.95.
5.2.3. The blackbody must make it possible to achieve temperature differences
of ±10°C. The accuracy must be 0.5%
generally, and 0.01°C for ∆Ts between
0°C and 2°C.
8
5.2.4. Any variation in temperature across
the useful area of the test pattern shall be
so small as not to be detectable on the image by the observer
9
5.2.5. The measurement temperature is
that of the test pattern, which should be
20 ±2°C unless otherwise specified.
10
5.3.The transmission losses between the
test pattern and the imager and the
emissivities of the test pattern and the
black body should be known and taken
into account when results are calculated.
158
collimator. Relative uncertainty
of spatial frequency of 4-bar
targets
manufactured by
Inframet is 4%. Uncertainty of
determination of focal length of
IR collimators offered by most
manufacturers of test equipment
is below 1%.
Emissivity of TCB series blackbodies is 0.97 ±0.01. Emissivity
of typical IR targets offered on the
market is 0.97 ±0.01; sometimes
>0.98.
Typical differential temperature
range for blackbodies used in test
systems is: -25°C and +75°C
(much wider than required). Differential accuracy of blackbodies
is not worse than 0.01°C at entire
temperature range ±10°C
Non uniformity of blackbodies
for temperature differences below
5°C is typically below 10 mK and
is non detectable for thermal imagers.
This is an requirement to be fulfilled by users of test equipment,
not requirement on the test equipment. However, this requirement
can be easily fulfilled if air conditioning is used. Next, please note
that the standard allows to carry
out measurement at ambient temperatures outside this range and to
correct the measurement results
(4.Note 1)
Transmittance of the collimator,
emissivities of
blackbody,
emissivity of the 4-bar targets are
known and they are taken into account by test software when corrected MRTD results are calculated.
11
12
5.4. In carrying out the measurements, the
observer may optimise results by altering
both the illumination level in the room
and any settings on the imager, adjusting
the distance of his eye from the display,
and slightly altering the position of the
test pattern within the field of view. If a
monitor is used it must be of the type
normally used with that imager, and it is
recommended that, once set up, it should
not be adjusted during measurement.
6.1. Starting from an invisible test pattern, the method is based on the determination of the temperature difference
(+ or -) required to make the test pattern
visible. Owing to limitations in the test
equipment, the indicated temperature differences may not be the true temperature
differences between test pattern and black
body. Therefore the following procedure
is recommended to establish the MRTD:
starting with the temperatures of the test
pattern and black body approximately
equal (see Note 2), the temperature of the
black body shall increase until the test
pattern appears in positive contrast (hot
bars). When the observer can just resolve
the test pattern, the, temperature difference (∆T+) is recorded. The black body
temperature is then reduced causing the
test pattern to disappear, and then to reappear with negative contrast (cold bars).
When the observer can just resolve the
test pattern again the temperature difference (∆T-) is recorded (see Note 3). The
two measurements must be taken without
delay so that temperature drift is avoided
(see Note 4).
Note 2 : The procedure can be speeded up
by starting with a temperature difference
between the test pattern and the black
body of 0.8 ∆T both for positive and
negative contrast.
159
This is an requirement to be fulfilled by users of test equipment,
not requirement on equipment.
This is an requirement to be fulfilled by users of test equipment,
not requirement on equipment.
13
14
Note 3 : If it can be established that the
temperature drift is negligible, both positive and negative contrast measurement
need to be made only for the lowest spatial frequencies, in order to determine the
“∆T offset" of the test equipment. This
“∆T offset" is then calculated as the mean
of the temperature differences for the
positive and negative contrasts (that
is“∆T offset" = 0.5 [“∆T+” + “∆T-“], and
its value is then subtracted from the temperature differences measured for a single
contrast for each of the remaining spatial
frequencies in the test run. Positive contrast measurements for these frequencies
are recommended.
Note 4 : It is proposed that the black body
temperature be varied in steps as follows:
∆T
Proposed
step
∆T
<0.5 °C
0.01°C
2°C to
4°C
0.5°C to
1°C
0.02°C
4°C to
8°C
1°C to
2°C
0.05°C
>8°C
15 6.2. It is recommended that the MRTD be
measured with horizontal and vertical orientation of the bars. Any other orientation
is optional.
16
6.3. The criterion to be used for resolution is that it should be possible to see
four bars (not just some modulation) on
160
Offset is calculated in test software that controls blackbody using the formula recommended in
Note 3.
Most blackbodies used for testing
thermal imagers enable temperature control with 0.001°C steps
(much better than required).
Most rotary wheels are designed
in a way that enables the 4-bar
targets to be fixed by the user in
vertical orientation or horizontal
orientation.
This is an requirement to be fulfilled by users of the test equipment, not requirement on the
17
the display, although it is not necessary
that all of each of the four bars be visible
at the same time.
6.4. Measurements shall be taken at a
minimum of four (4) spatial frequencies
distributed approximately uniformly over
the useful range of the imager. A minimum of three (3) measurements shall be
taken for each pair of contrasts, at each
spatial frequency, in each orientation, by
each observer. Measurements shall be
taken until stable results are observed. A
single observer may be used, although
multiple observers are recommended.
18
7.1. If positive and negative contrasts have
been measured, the individual MRTD
value is (∆T+ + ∆T)/219 7.2 The MRTD results shall be tabulated
(see Annex) and plotted on a graph (with
a logarithmic .scale for temperature differences and a linear scale for spatial frequencies) for each observer and each orientation. The measurement conditions,
values used for calculation and all the results must be shown. Any significant deviation or rejection of results must be explained.
161
equipment.
Manufacturers of test equipment
offer typically a series of at least
twenty standard 4-bar targets of
different spatial frequency. Next,
they can optionally deliver custom designed 4-bar targets of spatial frequencies outside the list of
standard targets. Such a situation
gives users of test system possibility to fulfill requirements of
point 6.4 on targets used for
MRTD measurement.
Test control software uses the formula recommended in point 7.1.
The measurement results can be
recorded using the test software
in several typical data formats
(MS Excel). Later the data can be
presented graphically using any
software for data presentation.
7 Guidelines for buyers of test equipment
Systems for testing thermal imagers are built from at least six blocks: collimator, blackbody, rotary wheel, set of targets, PC, frame grabber, software. Blocks
of the system for testing thermal imagers were presented and discussed earlier.
There were also presented requirements on blocks of such test systems.
However, any potential user or buyer of equipment for testing thermal imagers
should be reminded that total value of such a test system is much more than a sum
of system blocks. One weak block reduces greatly value of a test system. Thus,
writing detail requirements on all blocks of a test system optimized for specific applications is an expert task. It is quite easy to make an error on details as there are
many parameters that are inter-dependent.
Now, we will present several
recommendations for potential buyers/users
of systems for testing thermal imagers. If these recommendations not implemented
then there is a high probability that the buyer will get a costly test system that is not
optimal for his applications.
First, it is recommended for potential buyers of test systems to concentrate more
on requirements on the test system than on requirements on blocks of the system.
The best way to write safe for the user/buyer requirements on test system is to
write a list of required test capabilities of the system understood as a list of parameters to be measured or list of other system functions. It is a common error found in
many tender requirements that detail, sometimes not-needed, requirements on collimator, blackbody, rotary wheel are presented but a detail list of parameters that are
to be measured is not presented.
Second, equipment for testing thermal imagers is expensive. Therefore take care
that your funds are well spent on equipment truly useful in your work. Manufacturers can deliver, or at least should be able, different versions of the same test system
of different measuring capabilities and at different price level. Try to find a version
of the test system that is optimal for your needs.
Third, testing thermal imagers is difficult even having good test equipment, particularly for newcomers to thermal imaging technology. Test system shall generate
measurement results but cannot automatically and properly interpret these results.
Such data must be interpreted by human users of test equipment who must do this
difficult task. We must remember that test results of a thermal imager often depend
on imager settings, environment conditions, test equipment parameters etc. Therefore it is recommended to guarantee in the contract some support from equipment
manufacturer covering also help in interpretation of test results.
Fourth, buyers of equipment for testing thermal imagers often forget about
problem of recalibration of test systems or rather about the problem of recalibration
of some crucial blocks. Costs of frequent recalibration of test equipment can be in
long term almost equal to the original cost of purchase of this test equipment.
Therefore please check what are recommended recalibration intervals, what is price
of recalibration by the manufacturer, and finally, if it is possible to recalibrate the
162
test system in local conditions. In most cases recalibration of such blocks like
blackbody or collimator can be done in local metrological centers assuming that
some technical information is revealed by the manufacturer.
Sixth, typical twelve month warranty time is quite short. Extended warranty often means well spent funds as such warranty guarantee full manufacturer responsibility in much longer time.
Seventh, you will spend well your time by reading the educational section at
websites of manufacturers of test equipment or by reading other available
specialized literature. It will be later easier for you to communicate with
the manufacturers because you will then know exactly what you need.
Eight, it is possible to built a system for testing thermal imagers by buying some
blocks (collimator, blackbody, targets) and developing other needed blocks (rotary
wheel, control software, test software). However, it is a risky policy recommended
only for technologically advanced scientific/manufacturing centers with deep
knowledge of metrology of thermal imaging. Probability of commercial losses due
to long time needed for development of such a combined test system, and due to
possible technical problems, is high in most cases.
Ninth, systems for testing thermal imagers offered on international market by
different manufacturers are generally similar. The differences are created by small
technical details. Some of these details are very important: main test capabilities
(number of parameters that can be measured) or other system capabilities (accepted
standards of output electronic images from thermal imagers, boresighting capabilities, etc). There are also some technical details like dimensions and mass of systems blocks of no real importance for typical applications. Other parameters like
blackbody accuracy, blackbody temperature range are important when testing
commercial thermal imagers for non contact temperature measurement but not critical when testing surveillance thermal imagers. Further on, if the tests are to be
done at laboratory conditions then wide working ambient temperature range
offered by one manufacturer is not a real advantage over a system from another
manufacturer capable to work only at laboratory conditions. We have a totally different situation if the blackbody from the test system is to be used also in temperature chambers for calibration applications. Therefore it is always recommended to
think carefully about requirements on the test system and limit these requirements
only to truly needed level. This recommendation is important as equipment characterized by some non typical parameters is often much more costly than typical test
system.
To summarize, both cost-effective buying and effective use of systems for testing thermal imagers are difficult tasks. Well educated, properly trained test team is
needed in both these tasks.
163
About Author:
Krzysztof Chrzanowski received his Ph.D., and D.Sc. both in Electronics, from
Military University of Technology in Warsaw, Poland. He works currently as Professor in the mentioned above university. He is also CEO of a spin off company:
Inframet (www.inframet.com). His main scientific interests include analysis, testing and computer simulation of electro-optical surveillance systems (thermal imagers, night vision devices, TV cameras, laser range finders, multi-sensor surveillance systems), non-contact thermometry and general metrology. He is an author or
co-author of over 100 scientific papers and conference communications.
This books presents knowledge of the author on testing thermal imagers that was
accumulated during over two decades of scientific work in the field of electro-optical technology interconnected with a series of practical projects. The author hopes
that this book can become a practical guide in field of testing thermal imagers for
a wide community of people interested in this fascinating technology of thermal
imaging.
164