1
Porgy Documentation
Release 2.0
Tulip Team
December 15, 2015
CONTENTS
1
2
3
4
5
Porgy User Interface
1.1 Menu . . . . . . . . .
1.2 Workspace/Views . .
1.3 Rule widget . . . . . .
1.4 Graph widget . . . . .
1.5 Derivation tree widget
1.6 Strategy widget . . . .
1.7 Log widget . . . . . .
.
.
.
.
.
.
.
.
.
.
.
.
.
.
.
.
.
.
.
.
.
.
.
.
.
.
.
.
.
.
.
.
.
.
.
.
.
.
.
.
.
.
.
.
.
.
.
.
.
.
.
.
.
.
.
.
.
.
.
.
.
.
.
.
.
.
.
.
.
.
.
.
.
.
.
.
.
.
.
.
.
.
.
.
.
.
.
.
.
.
.
.
.
.
.
.
.
.
.
.
.
.
.
.
.
.
.
.
.
.
.
.
.
.
.
.
.
.
.
.
.
.
.
.
.
.
.
.
.
.
.
.
.
.
.
.
.
.
.
.
.
.
.
.
.
.
.
.
.
.
.
.
.
.
.
.
.
.
.
.
.
.
.
.
.
.
.
.
.
.
.
.
.
.
.
.
.
.
.
.
.
.
.
.
.
.
.
.
.
.
.
.
.
.
.
.
.
.
.
.
.
.
.
.
.
.
.
.
.
.
.
.
.
.
.
.
.
.
.
.
.
.
.
.
.
.
.
.
.
.
.
.
.
.
.
.
.
.
.
.
.
.
.
.
.
.
.
.
.
.
.
.
.
.
.
.
.
.
.
.
.
.
.
.
.
.
.
.
.
.
.
.
.
.
.
.
.
.
.
.
.
.
.
.
.
.
.
.
.
.
.
.
.
.
3
3
5
6
7
8
8
9
Presentation of the views
2.1 Rule View . . . . . .
2.2 Graph View . . . . . .
2.3 Derivation Tree view .
2.4 Additional trace views
.
.
.
.
.
.
.
.
.
.
.
.
.
.
.
.
.
.
.
.
.
.
.
.
.
.
.
.
.
.
.
.
.
.
.
.
.
.
.
.
.
.
.
.
.
.
.
.
.
.
.
.
.
.
.
.
.
.
.
.
.
.
.
.
.
.
.
.
.
.
.
.
.
.
.
.
.
.
.
.
.
.
.
.
.
.
.
.
.
.
.
.
.
.
.
.
.
.
.
.
.
.
.
.
.
.
.
.
.
.
.
.
.
.
.
.
.
.
.
.
.
.
.
.
.
.
.
.
.
.
.
.
.
.
.
.
.
.
.
.
.
.
.
.
.
.
.
.
.
.
.
.
.
.
.
.
.
.
.
.
.
.
.
.
.
.
.
.
11
11
12
14
15
Porgy data structure
3.1 Portgraphs . . .
3.2 Rules . . . . . .
3.3 Graphs . . . . .
3.4 Derivation trees .
.
.
.
.
.
.
.
.
.
.
.
.
.
.
.
.
.
.
.
.
.
.
.
.
.
.
.
.
.
.
.
.
.
.
.
.
.
.
.
.
.
.
.
.
.
.
.
.
.
.
.
.
.
.
.
.
.
.
.
.
.
.
.
.
.
.
.
.
.
.
.
.
.
.
.
.
.
.
.
.
.
.
.
.
.
.
.
.
.
.
.
.
.
.
.
.
.
.
.
.
.
.
.
.
.
.
.
.
.
.
.
.
.
.
.
.
.
.
.
.
.
.
.
.
.
.
.
.
.
.
.
.
.
.
.
.
.
.
.
.
.
.
.
.
.
.
.
.
.
.
.
.
.
.
.
.
.
.
.
.
.
.
.
.
.
.
.
.
19
19
20
21
21
Rewriting in action - A tutorial
4.1 Import new graph . . . . .
4.2 Rule creation . . . . . . .
4.3 Applying a rule . . . . . .
4.4 Strategies . . . . . . . . .
4.5 Afterword . . . . . . . .
.
.
.
.
.
.
.
.
.
.
.
.
.
.
.
.
.
.
.
.
.
.
.
.
.
.
.
.
.
.
.
.
.
.
.
.
.
.
.
.
.
.
.
.
.
.
.
.
.
.
.
.
.
.
.
.
.
.
.
.
.
.
.
.
.
.
.
.
.
.
.
.
.
.
.
.
.
.
.
.
.
.
.
.
.
.
.
.
.
.
.
.
.
.
.
.
.
.
.
.
.
.
.
.
.
.
.
.
.
.
.
.
.
.
.
.
.
.
.
.
.
.
.
.
.
.
.
.
.
.
.
.
.
.
.
.
.
.
.
.
.
.
.
.
.
.
.
.
.
.
.
.
.
.
.
.
.
.
.
.
.
.
.
.
.
.
.
.
.
.
.
.
.
.
.
.
.
.
.
.
.
.
.
.
.
.
.
.
.
.
.
.
.
.
.
.
.
.
.
.
23
23
24
31
32
36
Porgy in details
5.1 Property Manager . . . . . . . . . . .
5.2 The Ban property . . . . . . . . . . . .
5.3 Checking a rule application on a graph
5.4 Strategies . . . . . . . . . . . . . . . .
.
.
.
.
.
.
.
.
.
.
.
.
.
.
.
.
.
.
.
.
.
.
.
.
.
.
.
.
.
.
.
.
.
.
.
.
.
.
.
.
.
.
.
.
.
.
.
.
.
.
.
.
.
.
.
.
.
.
.
.
.
.
.
.
.
.
.
.
.
.
.
.
.
.
.
.
.
.
.
.
.
.
.
.
.
.
.
.
.
.
.
.
.
.
.
.
.
.
.
.
.
.
.
.
.
.
.
.
.
.
.
.
.
.
.
.
.
.
.
.
.
.
.
.
.
.
.
.
.
.
.
.
37
37
40
40
41
.
.
.
.
.
.
.
.
.
.
.
.
i
ii
Porgy Documentation, Release 2.0
PORGY is an interactive visual environment, based on Tulip, for modelling complex systems through graphs and
graph rewriting rules. Graph rewriting systems appear as a powerful formalism to capture and study phenomena
occurring in complex systems, such as the evolution of bio-molecular networks, adhoc communication networks or
interaction nets.
CONTENTS
1
Porgy Documentation, Release 2.0
2
CONTENTS
CHAPTER
ONE
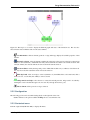
PORGY USER INTERFACE
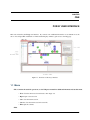
This section describes the Porgy user interface. If you need some additional information on an element move the
cursor on it and press F1 on Windows or Linux and the help key on Mac to gain access to the help page.
Figure 1.1: Overview of the Porgy interface
1.1 Menu
• File: Contains the usual file operations, see the Tulip user manual for additional information about this menu.
– New: Clear the current session and create a new empty one.
– Open: Open a saved session.
– Save: Save the current session.
– Save As: Save the current session in a new file.
– Exit: Quit the software.
• Edit:
3
Porgy Documentation, Release 2.0
– Undo: Undo the last operation.
– Redo: Redo the last undo operation.
– Copy: Copy the selected portnodes and edges from the active view to the clipboard. This option is
only available if the active view is a Rule view or a graph view.
– Cut: Cut the selected portnodes and edges from the active view. This option is only available if the
active view is a Rule view or a graph view.
– Paste: Paste the portnodes and the edges from the clipboard to the active rule view. This option is
only available if the active view is a Rule view or a graph view.
– Select all: Clear the selection then add the portnodes and the edges present in the active view.
– Deselect all: Clear the selection.
– Invert selection: Invert the selection. Selected elements become unselected and unselected become
selected.
– Delete selection: Delete portnodes and edges selected in the active view. This option is only available
if the active view is a Rule view or a graph view.
– Property manager: Allows users to select the properties to use during rewriting operations as matching parameters (for more information, consult Property Manager).
• Algorithm: Allows the user to compute and apply algorithm.
– Measure: Compute and assign a value to the ‘viewMetric’ property of graph elements. For example,
when running the ‘Portnode’s degree’ algorithm, the degree (the number of neighbors) is computed
and stored, for each portnode, into its ‘viewMetric’ property.
– Selection: Selects nodes and/or edges based on advanced criteria. (Selecting means assigning the
‘viewSelection’ property).
– General: Contains all the base porgy algorithms. This menu is made for an advance use of Porgy.
• Docks: Allows to show and hide dock widgets in the Porgy user interface.
• Windows: Manages the sub-windows of the view window.
• Help: Gives access to this documentation.
1.1.1 Toolbar
•
New: Clear the current session and create a new empty one.
•
Open: Open a saved session.
•
Save: Save the current session.
•
Save As: Save the current session under a specific name.
•
Undo: Undo the last operation.
•
Redo: Redo the last undo operation.
•
4
Copy: Copy the selected portnodes and edges from the active view to the clipboard. This option is only
available if the active view is a Rule view or a graph view.
Chapter 1. Porgy User Interface
Porgy Documentation, Release 2.0
•
Cut: Cut the selected portnodes and edges from the active view. This option is only available if the active
view is a Rule view or a graph view.
•
Paste: Paste the portnodes and the edges from the clipboard to the active rule view. This option is only
available if the active view is a Rule view or a Graph view.
•
Snapshot: Take a snapshot of the current view.
•
Help: Show the help widget.
1.2 Workspace/Views
The workspace is the central place where the visualizations are displayed. Every time a graph, a rule or a derivation
tree is opened, its corresponding view will be displayed in this space. If one or more views are already present in the
workspace, the new one will be set in the last position. More information concerning the specific views can be found
in Presentation of the views.
1.2.1 Navigating into the views
There is different ways to switch the views displayed in the workspace:
• Change the workspace layout: using the control buttons located at the bottom-right of the workspace, you can
change the number of views displayed at a same time. Some layouts are only available when enough views are
opened simultaneously and the required number of views is reach. By default only one view is displayed at
once.
1.2. Workspace/Views
5
Porgy Documentation, Release 2.0
• Switch displayed views: the current view can be changed by clicking on the left or right arrow buttons located
at the bottom of the workspace.
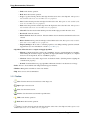
• Use the Expose mode: click on the expose button at the bottom left of the workspace to switch to the Expose
mode. In this mode, each view is represented by a preview and can reordered by drag and dropping.
• Reorder the views in the workspace: drag and drop the view using the move view handler located in the
top-right corner of each view.
1.2.2 Configuring a view
The list of the configuration widgets for each view appear in as tabs at the top-right corner of each view. To edit those
parameters, just click on a tab to expand the configuration widget. Click on the small cross in the tab to close the
opened widget.
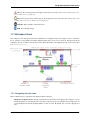
1.2.3 Changing the current interaction tool
To select an interaction tool just click on the icon of the interaction tool you want in the list. The current interaction
tool button will be updated with the tool name and icon.
Some interaction tools can be configured by clicking on the interaction tool button at the top left side of the view
toolbar. The configuration widget will pop up. If the interaction tool cannot be configured a short description of the
tool will appear. To close the configuration widget click again on the current interaction tool button.
1.3 Rule widget
Click on Rules tab to access to the Rules management widget. Here one can create, visualize and destruct rules. Use
the text line at the top of the widget to filter rules using rule names.
There is four preview mode :
• List: Display the rules in a list without any preview
• Small icons: Rules are shown using a small preview icon.
• Medium icons: Intermediate sized icons.
• Large icons: Enlarged rule previews.
To display an even bigger preview of a rule, hover it with your mouse cursor and wait a second.
6
Chapter 1. Porgy User Interface
Porgy Documentation, Release 2.0
1.3.1 Contextual menu
By right-clicking in the rule widget, a menu appear offering the following options:
• Show : A rule must be selected to enable this action. Displays a visualization/edition view for the selected rule.
One can also double click on the rule or drag and drop the view on the workspace to display it.
• Create new : Create a new empty rule.
• Rename : Rename the hovered rule.
• Clone : A rule must be selected to enable this action. Clone the selected rule, i.e create a copy of the rule with
the same port nodes and the same values.
• Delete : A rule must be selected to enable this action. Delete the rule. If the rule is used in an existing graph it
cannot be deleted.
• Import : Open a file browser window allowing to import one or several rules previously exported (files must
have the appropriate extension: x.porgy.rule).
• Export : Independently save the currently hovered rule for later import.
More information concerning the Rule view is available in the Rule View section.
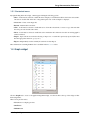
1.4 Graph widget
Click on Graphs tab to access to the graphs management widget. Use the text line at the top of the widget to filter
them using names.
There is four preview modes:
• No icons: Do not display previews.
• Small icons
• Medium icons
1.4. Graph widget
7
Porgy Documentation, Release 2.0
• Large icons
To display a larger preview, hover one of the graphs in the list. After a moment, a tool-tip with a larger preview will
appear. You can display a visualization/edition view for a graph by double clicking on it or by dragging it and dropping
it on the workspace.
More information concerning the Graph view is available in the Graph View section.
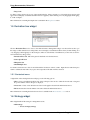
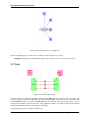
1.5 Derivation tree widget
Click on Derivation Trees tab to access to the Derivation Trees management widget. Use the text line at the top of
the widget to filter derivation trees using names. You can display a visualization/edition view by double clicking on it
or by dragging it and dropping it on the workspace. There is several kinds of visualizations (see the views section for
more information on Porgy views).
• Derivation Tree view: This is the general visualization for derivation trees.
• Scatter plot 2D view
• Histogram view
• Small multiple view
To rename a derivation tree select it and click with the left button on the it’s name. Input the new name then press
return to validate the new name. If you press the escape button the edition will be canceled.
1.5.1 Contextual menu
A right-click on the existing derivations will propose the following options:
• Show : Create a visualization/edition view on the workspace. One can also double click on the rule or drag and
drop a list element on the workspace to display it.
• Create new : Create a new derivation tree based on the graphs selected in the main derivation tree.
• Delete :Destruct the selected element. One cannot delete the main derivation tree.
More information concerning the derivation tree view is available in the Derivation Tree view section.
1.6 Strategy widget
This widget handle all the strategies’ management actions.
• Add strategy :
– Create an empty strategy
8
Chapter 1. Porgy User Interface
Porgy Documentation, Release 2.0
– Strategy from derivation tree : try to compute the strategy from the selected graph elements in the
main derivation tree.
– Import from a file : load a strategy from a file. The new strategy will have the name of the file loaded
without the file extension.
• Remove strategy: remove the selected strategy
• Export strategy : save the selected property on the disk.
1.6.1 Edition
When selecting a strategy by clicking on its name in the widget, its code appear in the editor on the right. From here,
instructions can be typed to specify in details how the rules can be applied. A complete syntax and set of instruction
exist and the entire grammar can be consulted in details in the following section.
1.7 Log widget
This widget will display the information, warning and error messages send by porgy.
1.7. Log widget
9
Porgy Documentation, Release 2.0
10
Chapter 1. Porgy User Interface
CHAPTER
TWO
PRESENTATION OF THE VIEWS
You will find here additional information on each of the views available in Porgy.
2.1 Rule View
This is the visualization/edition view for all the rules.
Figure 2.1: The Rule view allows to create, customize and visualize rewriting rules
2.1.1 Interaction tools
You will find in it the following interactors:
•
Navigation: move, rotate and zoom the view. Zooming behavior: the point under the cursor is moved
closer to the center.
•
Get information: click an element (portnode or edge) and Porgy displays all available properties of that
element in the properties widget.
11
Porgy Documentation, Release 2.0
•
Rectangle selection: select all elements touching the selection box (the previous selection is replaced, but
can be recovered with Undo). With Shift, the newly selected elements are added to the current selection; with
Ctrl (Alt on Mac), the selected elements are removed from the current selection.
•
Selection edition: modify the shape and position. Shift-click modifies only coordinates. Ctrl-click modifies only size. Left-click outside the selection resets the selection.
•
Edit edge bends: click on an edge to select it (with this tool), then Shift-click to add a new bend, click a
bend to move it, or Ctrl-click (Alt on Mac) to remove a bend.
•
Add portnodes: allow the user to create,edit and add portnodes. Edges can also be added between ports
only by clicking the source node first then the target node. Optionally bends may be added by clicking outside
of a node.
•
Delete element: click a portnode or edge to delete it.
2.1.2 Configuration
The following options can be customized using the tab on the right-side of the view:
• Scene: identical to the options available in Tulip; allows to customize the view.
• Rule Attribute: contains all the specific options of the current rule
– Layout algorithm: select the layout algorithm to perform on the rewritten graph after applying this
very rule.
2.1.3 Contextual menu
Perform a right-click (Ctrl-click Mac) to display this menu:
• Center view: move the camera the view all the elements.
• Redraw: redraw the rule and center the view.
• Take snapshot: open the screenshot tool.
• Selection: allows you to select specific parts of the rule.
2.2 Graph View
This is the visualization/edition view for graphs.
2.2.1 Interaction tools
You will find in it the following interactors:
•
12
Navigation: move, rotate and zoom the view. Zooming behavior: the point under the cursor is moved
closer to the center.
Chapter 2. Presentation of the views
Porgy Documentation, Release 2.0
Figure 2.2: The Graph view is used to display the different graphs and states of the derivation tree. The view also
allows first the creation then the edition of the states elements.
•
Get information: click an element (portnode or edge) and Porgy displays all available properties of that
element.
•
Rectangle selection: select all elements touching the selection box (the previous selection is replaced, but
can be recovered with Undo). With Shift, the newly selected elements are added to the current selection; with
Ctrl (Alt on Mac), the selected elements are removed from the current selection.
•
Selection edition: modify the shape and position. Shift-click modifies only coordinates. Ctrl-click modifies only size. Left-click outside the selection resets the selection.
•
Edit edge bends: click on an edge to select it (with this tool), then Shift-click to add a new bend, click a
bend to move it, or Ctrl-click (Alt on Mac) to remove a bend.
•
Add portnodes and edges: allow the user to create,edit and add portnodes. Edge can also be added by
clicking the source node then the target node. You can only add edge between two ports.
•
Delete element: click a portnode or edge to delete it.
2.2.2 Configuration
The following options can be customized using the tab on the right-side of the view:
• Scene: identical to the options available in Tulip; allows to customize the view.
2.2.3 Contextual menu
Perform a right-click (Ctrl-click Mac) to display this menu:
2.2. Graph View
13
Porgy Documentation, Release 2.0
• Center view: move the camera to visualize all the ports in the graph.
• Redraw: redraw the graph and center the view. You can choose between a force drawing algorithm (GEM
(Frick)) or a hierarchical drawing algorithm (Sugiyama (OGDF))
• Take snapshot: open the screenshot tool.
• Save selection: allow the user to save the current selection in a new local property or in an existing one. Click
on New property and input the name of the new property to create a new property. To erase an existing one just
click on the name of the property to replace. This is useful to create P and Ban properties.
• Restore selection: allow the user to replace the current selection by the selected property.
2.3 Derivation Tree view
This is the base view for derivation trees. Displays the graphs present in a derivation tree as a hierarchy. Each
edge between two graphs represents the transformation of the source to the destination. A transformation can be an
application of a rule (simple rule), an application of a strategy or a modification of the P property (Set position).
Figure 2.3: The Derivation tree view keeps a complete trace of all user operations and can be used to explore the
evolution of the graphs after rewriting.
2.3.1 Interaction tools
You will find in it the following interactors:
•
•
14
Navigation: move, rotate and zoom the view. Zooming behavior: the point under the cursor is moved
closer to the center.
Get information: click an element (portnode or edge) and Porgy displays all available properties of that element.
If you hoover an edge it will display the transformation information as a tool tip and it will highlight
portnodes involved in this transformation. Here is the color code used when highlighting portnodes
Chapter 2. Presentation of the views
Porgy Documentation, Release 2.0
involved in a transformation: * Simple rule: LHS portnodes are in red and RHS are in blue. * Set position:
portnodes that are only in the original P property are in red, portnodes only in the new P property are in
blue and portnodes in both old and new are in green.
•
Rectangle selection: select all elements touching the selection box (the previous selection is replaced, but
can be recovered with Undo). With Shift, the newly selected elements are added to the current selection; with
Ctrl (Alt on Mac), the selected elements are removed from the current selection.
•
Zoom box: draw a rectangle and zooms on this area.
•
Open in a new graph view: click on a graph and it will be displayed a new view.
•
Selection edition: modify the shape and position. Shift-click modifies only coordinates. Ctrl-click modifies only size. Left-click outside the selection resets the selection.
•
Edit edge bends: click on an edge to select it (with this tool), then Shift-click to add a new bend, click a
bend to move it, or Ctrl-click (Alt on Mac) to remove a bend.
2.3.2 Configuration
The following options can be customized using the tab on the right-side of the view:
• Parameters:
– Labels: choose whether you wish to display the nodes or meta-nodes labels.
– Rendering parameters: allows you to enable the edge size interpolation or to scale each label size according
to their node size.
2.3.3 Contextual menu
Right-click (Ctrl-click Mac) to display this menu:
• Center view: move the camera the visualize all the elements in the derivation tree.
• Redraw: redraw the derivation tree and center the view.
• Take snapshot: open the screenshot tool.
• Show Overview: toggle top left overview
If a graph is present under the cursor some other options are available:
• Open in a new graph view: show the graph under the pointer in a new view.
• Add to/Remove from the selection: if the graph is present in the current selection remove it else add it.
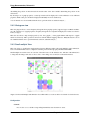
2.4 Additional trace views
2.4.1 Scatter plot 2D View
This view allows to create 2d scatter plots of graph nodes from graph properties (supported types are Metric and
Integer). A scatter plot is a type of mathematical diagram using Cartesian coordinates to display values for two
variables for a set of data. The data is displayed as a collection of points, each having the value of one variable
2.4. Additional trace views
15
Porgy Documentation, Release 2.0
determining the position on the horizontal axis and the value of the other variable determining the position on the
vertical axis.
By selecting a set of graph properties, a scatter plot matrix will be displayed for each combination of two different
properties. Each scatter plot can then be displayed individually in a more detailed way.
A set of interaction tools are bundled with the view to perform selection, statistical analysis, ...
2.4.2 Histogram view
This view plug-in allows to create frequency histograms from graph properties (supported types are Metric and Integer). By selecting a set of graph properties, frequency histograms are computed and displayed for values associated to
nodes (or edges).
This view also allows to map visual properties (colors, sizes, glyphs, ..) of the graph elements with respect to a graph
metric in a visual way. These operations can be done with the “Metric mapping” interactor. Many interaction tools are
also bundled with the view to perform elements selection, statistical analysis, ...
2.4.3 Small multiple View
This view allows to visualize the transformations between different graphs using small multiples and/or animation.
User can add intermediate states to emphasize elements present in the P property, the LHS and the RHS.
Small multiples are useful to have an overview of the whole states of the derivation tree. The aim of the animation is
to interpolate the change each states to show a video of the change. You see the film of the transformations.
Figure 2.4: The small multiple and animation view which enable to see the evolution of a branch of a derivation tree.
Configuration
• General:
– Intermediate states: add the corresponding intermediate states between two states.
16
Chapter 2. Presentation of the views
Porgy Documentation, Release 2.0
– Widgets: customize the view by selecting the widgets to display (Small multiples or Animation).
– Node labels: show or hide the node label and scale the label size in function of the node size
• Animation:
– Animation duration: animation duration between two states.
– Rule preview: display or hide a preview of the rule involved in the current transformation if the current
transformation involve a rule.
• Small multiples:
– Rendering parameters: offers to force the labels of the small multiples to take the whole available space
or to have an uniform font size. The margin between each preview can also be customised.
– Small multiples layout: set the display options for the small-multiple view. Go for the default layout or
force a specific number of lines.
2.4. Additional trace views
17
Porgy Documentation, Release 2.0
18
Chapter 2. Presentation of the views
CHAPTER
THREE
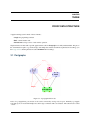
PORGY DATA STRUCTURE
A graph rewriting system is made of these elements :
• Graph: the graph being rewritten.
• Rule: a transformation rule.
• Derivation tree: keeps a trace of each rewrite operation.
Graph and rules are made with a specific graph structure called a Portgraph. To be fully understandable, this part of
the documentation requires a good knowledge of the Tulip data structure and the latest publication about Porgy (see
the Porgy web site and the publication at the GRAPHITE 2014 workshop).
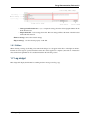
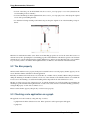
3.1 Portgraphs
Figure 3.1: A portgraph with 5 nodes.
Nodes of a portgraph have ports and two nodes can be connected by an edge only via ports. Internally, a portgraph
node with 4 ports is made with 5 Tulip nodes and 4 edges connected with a star structure. The central node is called
‘’center’‘.
19
Porgy Documentation, Release 2.0
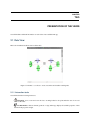
Figure 3.2: Internal structure of a portgraph node
The following Tulip property is used in order to identify correctly each part of a portnode:
• NodeType: Integer Property which handle node types. Two possible values: 1 for center and 2 for ports.
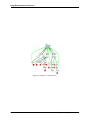
3.2 Rules
Figure 3.3: Rewriting rule example
A rule is composed of a left-hand side (LHS), a right hand-side (RHS) and a bridge which connects both sides. The
red edges represent connections of equivalent ports between LHS and RHS. For instance, the two ports labeled 1 in
the LHS EGFR portnode is connected to the RHS EGFR port also labeled 1. These specific edges allow to restore
node properties and their connections to the rest of the graph after rewriting. All connections between the left-hand
side and the right-hand side must go through a port of the bridge.
Some additional properties are required to define a rule:
20
Chapter 3. Porgy data structure
Porgy Documentation, Release 2.0
• Arity: Arity of a LHS port. Sometimes a port needs to be connected to some other ports in the graph which
are not part of LHS. This property is used to indicate the minimum required degree of a port.
• RuleSide: for nodes and edges indicates in which part of the rule the element is (Integer property).
There are four possible values: 1 for LHS, 2 for RHS, 3 for the bridge (red edges for instance), 4 to
identify a port of the bridge and 5 to identify specific edges which connect two LHS ports via the bridge.
The value 4 is used to indicate which node is the center of the bridge. It is also used for the edges on
either side of the bridge. The value 5 is used for edges only when a subgraph of LHS have to be replaced
by a single edge. The edge is going from a port a of LHS to a port of the bridge, then from this latter to
another LHS port called b. Then, the rewriting will consist in removing LHS
• M: RHS only. When sets to true, the element is added to the current position set after rewriting.
• N: RHS only. When sets to true, the element is added to the current ban set after rewriting.
3.3 Graphs
Graphs have some additional properties to keep a trace of each transformation: * new: Boolean property set to true if
the edge or the portnode is new, i.e. it has been created or modified by the last transformation.
The morphisms between a rule LHS and a graph G are saved as subgraphs of G. Each subgraph is the instantiation of
a rule LHS and uses some specific properties and graph attributes:
• tag: Integer property filled with the Tulip id of the corresponding node or edge in the rule LHS.
• P Property: graph attribute which handles the property name used as the position set or NoPosition if positions
were not used.
• Ban Property: graph attribute which handles the property name used as the ban set or NoBan if ban was not
used.
• rulename: graph attribute which handles the name of the rule used.
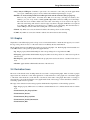
3.4 Derivation trees
The nodes of the derivation tree are Tulip metanodes associated to each generated graphs. There is a black or purple
edge between two metanodes a and b if the application of a rule transforms a source graph a into a destination graph
b. The label of the metanodes (on the left side of each node) is the name of the graph. The result of a strategy is
represented by a green edge between the source graph and the result of the strategy. A red node indicates a failure, i.e.
a rewriting operation was not possible.
The edges of the derivation tree has many properties which handles all parameters of the rewriting operations:
• Type: Integer property which can be 0 to indicate a standard metanode of 1 to indicate that the node is a failure
node.
• Transformation_Ban_PropertyName:
• Transformation_Instance:
• Transformation_PPropertyName:
• Transformation_Parallel_Information:
• Transformation_Rule:
3.3. Graphs
21
Porgy Documentation, Release 2.0
Figure 3.4: Example of a derivation tree.
22
Chapter 3. Porgy data structure
CHAPTER
FOUR
REWRITING IN ACTION - A TUTORIAL
In the following sections, we will explain the guidelines to start working using Porgy. We will:
• start using a random graph,
• create a few different rules using specific properties for the pattern matching,
• apply the rules a few times separately,
• create a strategy for applying the rules in a specific order and, finally,
• execute the strategy some times to obtain a few branches on the derivation tree.
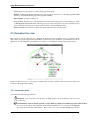
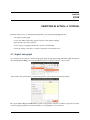
4.1 Import new graph
As a starting point, we generate a random simple graph using the appropriate plugin embedded within the platform.
After having launched Porgy, choose the item Random Simple PortGraph in the File > Import menu.
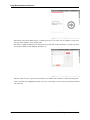
A new window will open allowing you specify the generation options. We use the following settings:
The options nodes, edges and Connected are specific to the generator and allow to indicate respectively how many
nodes and edges the graph will contain and whether or not the graph have to be connected.
23
Porgy Documentation, Release 2.0
The two remaining options are specific to Porgy:
• Additional ports: By default, each connection to a portnode is achieved using a different port (i.e., if a node
is of degree X then, it will have X ports, one for each in- or out-coming edge). Enabling the Additional ports
option will give the exact same number of ports to every portnode while disabling it will reduce the number of
ports to one.
• Same In/Out ports: By default, edge orientation is not considered in Porgy, setting this option to false differentiate the existing ports in two distinctive ones labelled In and Out. Edges will leave a portnode through an Out
port and arrive using an In port.
Those options are also available when importing a tlp graph. A new option is then accessible, proposing to keep the
previously used layout or recompute a new one.
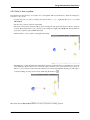
The graph is generated and imported in the list of graphs as G0 (see Graph widget). You can see that creating this first
graph also create TraceMain, the main derivation tree. The list of available traces is available in the Derivation tree
widget.
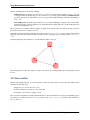
If generated using the same parameters, your G0 should be similar to this one:
The visual properties of the nodes’ and ports’ shapes, sizes and colours are using default values. We keep them as such
for now.
4.2 Rule creation
With the initial graph imported, we can start the rule creation. For this tutorial, we will create three different rules
achieving the following goals:
• change the color of a node from red to blue,
• divide an existing blue node in two yellow nodes and
• merge three yellow nodes in a single red node.
The colour will consequently be an important information for our rules and will need to be used as a matching property.
To enable this, we must activate the viewColor property in the Property Manager (accessible in the menu Edit >
Property Manager).
24
Chapter 4. Rewriting in action - A tutorial
Porgy Documentation, Release 2.0
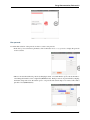
4.2.1 Rule 1: red to blue
One can create a new rule by performing a right click in the Rule widget and selecting Create a new rule in the
contextual menu:
After having specified the name of the newly created rule (we choose to call it red-blue), a double click on the rule
icon in the Rule widget (or using a right click and selecting Show) will create a new Rule View.
The view only contains a bridge node for now. This element is used to mark the transition between the left-hand side
and the right-hand side. We consequently use it as a visual cue indicating the limit between the LHS and the RHS.
Our rule is supposed to change the color of a node from red to blue, we thus have to create a red node on the left, a
blue node on the right and link the two elements appropriately.
Red portnode
• First, we must select the interactor allowing to create portnodes
.
• Clicking on the name of the interactor display its parameters
4.2. Rule creation
25
Porgy Documentation, Release 2.0
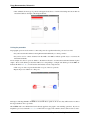
• The interactor lists all the different types of existing portnodes. For now, the only one available corresponds to
the red portnode similar to those existing in G0.
• We will use a slightly modified version of this portnode, double-click on the red element to open the customization widget in which we will change the field Name to 1
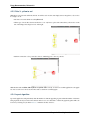
• The new variation of the red portnode found in G0 is now available and is marked as 1 with a red background.
• Click on it in the list to highlight it and click on the left of the bridge to create a new portnode in the left-hand
side of the rule.
26
Chapter 4. Rewriting in action - A tutorial
Porgy Documentation, Release 2.0
Blue portnode
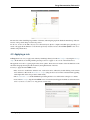
To add the blue variation of the portnode, we have to create a new portnode.
• In the Add a portnode interactor parameters, click on the button Create a new portnode to display the portnode
creator assistant.
• Here we can customized the new portnode by changing its name, colour and number of ports. We set the name to
2 and change the default colour to a light blue (RGB=0,85,255). Each port can also be personalized by adapting
their name, shape and colour. We add two ports to our portnode and set their shape to be a Rounded Box with a
pure blue colour (RGB=0,0,255).
4.2. Rule creation
27
Porgy Documentation, Release 2.0
• Once validated, the new type of portnode will appear in the list as a 2 with a blue background. It can then be
selected and added to the right of the bridge in the rule.
Linking the portnodes
In portgraphs, ports are used as means to connect the portnodes together. In the rules, ports use is twofold:
• they can be used in the left-hand or the right-hand side indifferently to connect portnodes
• they can be used to connect elements from the LHS to the RHS to indicate specific ways to reconnect the
transformed elements.
In our example case, the two ports are similar so the fashion followed to reconnect the transformed element is quite
simple. We set each distinct port from the LHS to be corresponding to a unique and distinct port in the RHS. To
indicate this in the Rule View, we will use the same interactor used to add portnodes.
• Click on a port of the red portnode then click on a port of the blue portnode.
• Repeat the process with the two other ports.
Red edges connecting the LHS to the RHS are created with these operations. In our case, they will be used to reconnect
the edges attached to the red portnode.
The red-blue rule is now finished and can be directly applied to the graph to start rewriting operations. If your are
impatient to proceed, consult the next section to find out how to apply a rule otherwise, there is still two rules to create.
28
Chapter 4. Rewriting in action - A tutorial
Porgy Documentation, Release 2.0
4.2.2 Rule 2: blue to yellow
Now that the bases have been set, we are able to move a bit quicker. This second rule have to divide an existing blue
node in two yellow nodes.
• As previously seen, we start by creating a new rule (in the Rule widget, right-click then Create new) called
blue-2yellow.
• We add a blue portnode on the left of the bridge.
• We create a new portnode variation with two ports following the steps previously shown for the blue portnode
creation. The portnode name is set to 3 and its colour is changed to a light yellow (RGB=255,255,127) while its
ports receive a primary yellow (RGB=255,255,0).
• We then add two yellow portnodes on the right of the bridge.
• Deciding how to connect the transformed elements is a bit more specific this time as we divide the blue portnode
in two different portnodes. We choose to reroute the edges connected to a blue port toward only one yellow port.
The two yellow portnodes, result of the transformation, are connected through their unused ports. The edge is
created by clicking on each port successively when using the interactor
.
This achieve the rule blue-2yellow which is now ready to be used in a rewriting operation.
4.2. Rule creation
29
Porgy Documentation, Release 2.0
4.2.3 Rule 3: yellow to red
With the two previous rules achieved, this last one will be set in no time. We simply want to merge three yellow nodes
in a single red one.
• We create a new rule which we call 3yellow-red.
• All the type of nodes have been created before so we only have to place and connect three yellow nodes on the
left of the bridge and a single red one on the right.
• We then connect the yellow portnodes to the two remaining ports to the red portnode.
With the three rules red-blue, blue-2yellow and 3yellow-red now ready, we can focus on their application to the graph
G0. Let us see how we can use each of these rules to transform our initial graph.
4.2.4 Layout algorithm
Upon rule application, and particularly when the number of elements appearing is greater than the number of elements
being replaced, the layout can become unclear. In those case, it is advisable to redraw the graph altogether. This can
be done by selecting a layout in the Rule View under the tab Rule Attribute:
30
Chapter 4. Rewriting in action - A tutorial
Porgy Documentation, Release 2.0
Be aware that, when visualizing large number of elements, redrawing the graph can disturb the mental map of the user
because of the possible change of each node position.
In our case, we choose the FM^3 layout, a force directed layout quick to compute and which gives generally good
results. We apply this modification to all the rules previously created, however, the rule blue-2yellow is the one to
which it will profit the most.
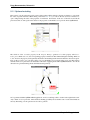
4.3 Applying a rule
In Porgy there is two way to apply a rule, either by launching it directly from the Rule widget or by using the Strategy
widget. Both methods are working with drag and drop actions on a graph or onto a node of the derivation tree.
The application of a rule to a given graph consists in two phases: find at least one instance of the left-hand side of the
rule inside the graph, then replace this instance by the right-hand side of the rule.
Let us try to apply the rule red-blue on G0:
• First, we need to visualize the derivation tree, such action can be achieved by double-clicking on the current
trace called TraceMain in the Derivation tree widget (using the Show action in the contextual menu appearing
with a right-click on the trace produces similar result).
• The Derivation Tree view and the thumbnail representing G0 have to be visible in the workspace to continue.
• Now, in the Rule widget, drag the rule red-blue on G0. A new window will appear in which we set the Maximum
number of instances to find at 1 to only generate one new state:
4.3. Applying a rule
31
Porgy Documentation, Release 2.0
• The application will generate a new graph called G1 in which the rule red-blue has successfully been applied.
Because the initial graph G0 only contains red portnodes, the rules using blue and yellow portnodes cannot successfully
be applied on it. If we tried to drag one of those rules and drop it, we will end up with an invalid state shown as a red
thumbnail.
Applying the rules by hand allows to test if everything is going according to plans however, strategies can be used to
automatized the process and avoid to perform the transformations manually.
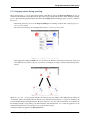
4.4 Strategies
A strategy is a small script language created to improve the rule rewriting possibilities. In this example, we will see
how to write simple strategies and transform the graph by automatically applying the rules previously created.
The strategy allows us to choose how we wish to apply each rule. In our case, no specific behaviour or model is given,
we thus decide to try applying each rule as many time as possible and see the results obtained.
As seen before, only the rule red-blue can be applied in the beginning. Applying it once will allow us to launch the
blue-2yellow rule afterward but we will then be blocked as the last rule, 3yellow-red, requires three yellow portnodes
to be applied. If we apply the first two rules three times each, we can then apply the last rule two times and obtain two
red portnodes.
32
Chapter 4. Rewriting in action - A tutorial
Porgy Documentation, Release 2.0
4.4.1 Repeat a rule application
The first step is to create a new strategy. This can be achieved in the Strategy widget by clicking on the + Add button
and selecting the option Empty strategy:
You can rename a strategy by double-clicking on it. We call our own A for simplicity. This first strategy will apply
each rule as many times as possible in the logical order: red-blue, blue-2yellow and 3yellow-red. To do so, we can
use the repeat command and thus create the strategy as follow:
repeat(red-blue);
repeat(blue-2yellow);
repeat(3yellow-red)
Applying this strategy immediately on G0 will not produce the expected result as only the first repeat will seem to be
executed. Before doing so we need to consider the Position and Ban properties.
4.4.2 The Position set
When creating a rule, you can specify whether you want the newly created right elements to be considered afterwards
as possible match for rule application. More formally, at the beginning of a strategy application, all the elements of the
targeted graph are available for rewriting and thus are in the Position set. With each rule application within the strategy,
the right-hand side elements are by default moved out of the Position set where they become no longer available for
matching as left-hand side elements.
To use the strategy, we must specify for each element in the right-hand side of the rules used whether they are put in
the Position set for further operation or if they are left out. This can can be achieved in the Rule View. We present the
steps to follow using the red-blue rule.
• First select the Get information interactor
• Then click in the middle of the blue portnode and a widget will appear
4.4. Strategies
33
Porgy Documentation, Release 2.0
This tool allows you to customize some of the visual properties of the selected element as well as a few others.
Currently, we are interested in the M property initialized at false by default. M is used to indicate if the element is
transferred into the Position set after the rewriting operation; we thus set the property to true:
Trying to launch the strategy A on G0 now will produce a better but still incomplete result. The step explained above
must be repeated for each portnode located on the right-hand side of each rule.
4.4.3 Strategy application
Once all those changes are completed, we can apply the strategy A to G0. To do so, proceed similarly to a rule
application:
• The Derivation Tree view must be displayed and the graph targeted, G0, have to be visible.
• Drag and drop the name of the strategy upon G0 and wait for the computation to be over
• You will obtain a derivation tree with eight new states:
The graph G8 contains two red portnodes, allowing us to apply the strategy once again. By drag and dropping A on
G8, we obtain five new states:
34
Chapter 4. Rewriting in action - A tutorial
Porgy Documentation, Release 2.0
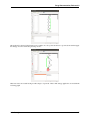
The graph G13 at the end of the derivation tree contains one yellow portnode and one red portnode. We can thus apply
the strategy once more with a drag and drop on G13:
Three new states are created leaving us with a single red portnode. After a final strategy application, we end with the
following graph:
4.4. Strategies
35
Porgy Documentation, Release 2.0
No more rules can be applied from here, leaving us with nineteen states and 2 yellow portnodes.
4.5 Afterword
Congratulations, you have completed this tutorial. You now are familiar with the basic inner mechanics of Porgy,
restart from scratch and create your own rewriting rules and starting graph or open a graph from Tulip and import the
rules and start rewriting!
There is still nonetheless much to see. Consult Porgy in details for more information on the advanced possibilities of
the platform and discover more on the Property Manager, on how to customize the matching and the grammar of the
strategy language...
36
Chapter 4. Rewriting in action - A tutorial
CHAPTER
FIVE
PORGY IN DETAILS
In the following section, you will find information on the advanced functionalities of Porgy. We will consider from
here that you have successfully achieved the tutorial presenting how to create rules and apply them. We will thus base
all the explanations in the direct continuity.
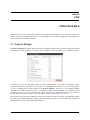
5.1 Property Manager
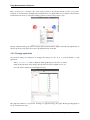
The Property Manager is available in the Edit menu. The widget will display all the properties existing in the current
graph and give you the possibility to select any possible combination of those properties to use as matching criterion.
For instance two portnodes with different names but with a similar number of ports will be considered as similar
elements by default. If you wish those two elements to be distinguish from each other, you can select the property
viewLabel (containing their respective names) in the Property Manager. From now on, the subgraph matching
operation will consider the selected property as an additional condition for the matching to be successful. In the
screenshot above, the state and viewLabel properties have been selected by double-clicking in the second column on
the appropriate lines; doing so makes a combo-box appear, offering to set the value to true or false.
New properties can be created by clicking the + button and outdated ones can be deleted by selecting them and using
the - button. Please remember that the visual properties (whose name begin with view) are crucial for the visualizations
and thus will be restored to their default value if deleted.
37
Porgy Documentation, Release 2.0
5.1.1 Optional matching
Finer control over the selected properties can be achieve when editing each rule, allowing for instance to only check
the value on specific elements. When editing a rule in the Rule View, you can use the Get information interactor to
open a widget listing the value of the properties of an element. For instance, in the case of the rules created in the
previous tutorial, we take a peek at the values for the properties of the middle yellow portnode in rule 3yellow-red:
The selection of the viewColor property in the Property Manager generates a boolean property called viewColor_isused. When set to true, the corresponding property is checked for this element during the matching. When set
to false however, the property is still generally checked for the matching but the current element becomes an exception.
If we set the viewColor_isused property value to false for the middle yellow portnode and its ports, any chain of three
elements with yellow portnodes at its extremities will match. Applying the modified 3yellow-red rule to G11 in the
derivation tree generated during the tutorial illustrates this perfectly:
G19 is generated with the 3yellow-red rule application on G11, a result impossible to obtain for the original rule as G11
only contains 2 yellow portnodes. This advanced checking possibility allows further control on the transformations
and very fine tuning over the operations we are able to perform.
38
Chapter 5. Porgy in details
Porgy Documentation, Release 2.0
5.1.2 Copying values during rewriting
The boolean property (*_isused) created after selecting a matching property in the Property Manager can also be
modified on the elements of the right-hand side. This can be used to specify which value to affect during the rewriting
process. We consider the graph used in the tutorial, the rule red-blue and the matching property viewColor to illustrate
the process.
• After having selected viewColor in the Property Manager as a matching condition, the boolean property viewColor_isused is created.
• We select both of the blue ports and update their value for viewColor_isused to false.
• After applying the changed red-blue rule, we can witness the difference between the normal result (in G1) and
the modified version (in G2) as the ports colours have not changed according to the visual information given by
the rule.
When set to true, the *_isused property indicates the value given by the element in the right-hand side will be the
one rewritten. This is the default behaviour thus the ports rewritten are blue (like G1), as expressed visually by the
corresponding elements in the right-hand side. However, when set to false, the value selected is the one obtained from
the matching elements corresponding to the linked element of the left-hand side. As a result, the application of the
modified rule transform the red portnode in a blue portnode with red ports.
A similar treatment can applied to the blue-2yellow rule:
5.1. Property Manager
39
Porgy Documentation, Release 2.0
• for both of the blue ports in the left-hand side, the viewColor_isused property is set to false (desactivate the
colour matching for those elements)
• for both of the linked ports in the right-hand side, the viewColor_isused property is set to false (keep the original
colour of the ports matching the rule)
• we obtain the following rewriting result where both ports keep the original colour of their matching correspondances.
This kind of transformation makes sense when several matching properties are used at the same time but are not
relevant in every rule. Specifying the local matching properties and whether the value must be passed to the rewritten
element allows to rewrite and transform the graph in different ways. Please note that this behaviour is only available
for ports as they are the sole elements in the right-hand side to be linked to other elements in the left-hand side.
5.2 The Ban property
We have mentioned the Position property in the previous tutorial however a second property, the Ban property, can be
used to limit the elements available for the rule application.
Basically, an element can be in the Position set, in the Ban set or neither of those (neutral). When looking for elements
during the matching of the LHS for each rule, at least one of the elements of the left-hand side has to be within the
Position set for the matching to be valid. The matching will be impossible if all of the elements are neutral.
The Ban set is the exact opposite of the Position set, as such the elements banned will be plainly ignored during the
matching step. The elements in the right-hand side of a rule can be send to the Ban set after the rewriting operation by
setting the N property of each of those elements to true.
Please note that the Ban property takes priority over the Position property.
5.3 Checking a rule application on a graph
The application of a rule is made by a drag and drop of a rule to:
• a graph metanode in the derivation tree view. If the operation is valid a green square will appear.
• a graph view.
40
Chapter 5. Porgy in details
Porgy Documentation, Release 2.0
Once you drop the rule a parameter configuration widget will appear to configure the rule application.
You can customize these parameters:
• Rule Name
• Maximum number of instances to apply: the maximum number of matching to compute..
• Position: the boolean property that defines a subgraph of the graph. This subgraph is used to restrict the search
of the instances of the left-hand side of the rule. When one tries to find the instances I in G, at least one node of
each I must be in the Position set. It is possible to define more than one set Position.
• Ban: similar to Position but with the Ban property.
If the process works, the resulting graph will appear in the derivation tree, else a red state will appear.
5.4 Strategies
A strategy is a small script language created to improve the rule rewriting possibilities.
5.4.1 Syntax of the Strategy Language
Let L, R be port graphs; M, N positions; 𝑛 ∈ N; 𝜋𝑖=1...𝑛 ∈ [0, 1];
𝑛
∑︀
𝜋𝑖 = 1;
𝑖=1
Let attribute be an attribute label in ∇A ; 𝑒 ∈ ℰ∇ a valid expression without variables;
5.4. Strategies
41
Porgy Documentation, Release 2.0
(Strategies)
S
::=
|
|
|
Rewriting
Scope
(Basics)
(Applications)
(Transformations)
B
A
T
::=
::=
::=
Id | Fail
𝐵 | all(𝑇 ) | one(𝑇 )
𝑁
𝐿𝑊 ⇒ 𝑅𝑀
| (𝑇 ||𝑇 )
(Update)
U
::=
(Positions)
(Focusing)
D
F
::=
::=
(Comparison)
C
::=
setPos(𝐷) | setBan(𝐷)
update(function_name {parameters_list})
all(𝐹 ) | one(𝐹 )
CrtGraph | CrtPos | CrtBan | Property(𝐹, 𝜌)
Ngb(𝐹, 𝜌) |𝐹 ∪ 𝐹 |𝐹 ∩ 𝐹 |𝐹 ∖ 𝐹 | (𝐹 ) |∅
𝐹 = 𝐹 |𝐹 ! = 𝐹 |𝐹 ⊂ 𝐹 | isEmpty(𝐹 )
(Properties)
𝜌
Elem
Expr
Relop
::=
::=
::=
::=
Elem, Expr
Node | Edge | Port
attribute Relop e | True
== |! == | > | < | >= | <=
|
|
Properties
42
𝐴|𝑈 |𝐶|𝑆; 𝑆
if(𝑆)then(𝑆)else(𝑆) | (𝑆)orelse(𝑆)
repeat(𝑆) | while(𝑆)do(𝑆)
ppick(𝑆1 , 𝜋1 , . . . , 𝑆𝑛 , 𝜋𝑛 ) | try(𝑆) | not(𝑆)
Chapter 5. Porgy in details