1
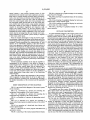
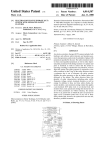
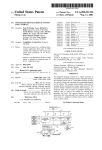
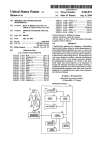
lllllllllllllllllllllllllllllllllllllIlllllllllllllllllllllllll|l|l|||||ll|
US005474082A
United StiltCS Patent [19]
[11] Patent Number:
Junker
[45] Date of Patent:
[54]
5,474,082
Dec. 12, 1995
BRAIN-BODY ACTUATED SYSTEM
OTHER PUBLICATIONS
[76] Inventor: Andrew Junker, 139 E‘ Davis St.’
Johnston, V. S., “Recognition of Stimulus Displays~An
Electrophysiological Analysis”, Proceedings of 11th Annual
Conference on Manual Control, NASA TMX-62, 464, 1975,
Y°11°W Springs’ Obi" 45387
pp. 173-—178.
[21] APPL No; 1,096
[22] Filed:
Jan. 6, 1993
6
[51]
[52]
Int. Cl. ...................................................... .. A61B 5/04
US. Cl. ..................... .. 128/732; 340/825.19; 341/21;
345/157; 273/438; 123/731; 128/733; 128/905
Field Of Search ................................... ..
128/733, 905; 434/236, 323, 336, 350;
273/DIG. 28, 438, 148 B; 340/825.19,
825.24; 345/156, 157; 341/20, 21, 34
[56]
References Cited
U.S. PATENT DOCUMENTS
2,690,178
9/1954 Bickford .
3,032,029
5/1962 Cunningham.
3,490,439
1/1970 Rolston.
3 604 4“
9,1971 Schuler _
3:641:993
3,735,425
3,821,949
2,1972 Gander et aL _
5/1973 Hoshan at at _
7/1974 Hartzell et al. .
3,837,331
3,875,930
9/1974 Ross .
4/1975 Silva et al. .
Junker, A. et al., “Loop Closure of the Visual-Cortical
Response (U)”, Summary Report for Period Dec 1986 to
December 1987, Feb. 1988.
“A Comprehensive Treatise on Research in the Area of:
Brain Actuated Conn-o1”, Sap. 17 1989'
Junker, A_ et a1” “Brain Actuated Control of 3 R011 Axis
Tracking Simulator’, @1989, IEEE, PP. 714-717.
wolpaw, J,
et 31_, “A11 EEG_baSed bfain_computer inter.
face for cursor contro ”, Electroencephalography and Clini
cal Neurophysiology, @1991, 78: 252259.
Primary Examiner—Williarn E. Kamm
Assistant Examiner-Jeifrey R. Jastrzab
Attorney, Agent, or Firm—Wood, Herron & Evans
[57]
ABSTRACT
A method and apparatus for assisting a user to control a
device in response to a combination of electroencephalo
graphic and electromyographic potentials. The user selects a
number of reference frequencies in a range of from 0.5 Hz
to 45 Hz de?ning a like number of control signals. A digital
lock-in ampli?er is used with a moving average time win
dow ?lter to produce control signals which are presented to
3’916’876 11/1975 Freeman _
3,882,850
5/1975 Bailin et al. .
the user. Control system responsiveness is controlled by
adjusting the lengths of the movlng average time wlndows.
3,942,516
3,967,616
3,978,847
3,1976 Glynn et aL _
7/1976 Ross _
9/1976 Fehmi et al. .
A phase-locked loop 1s closed around each control signal
and is used to track the shifting frequencies of the control
signals. The user is able to sense and control changes in the
3,993,213 12/1976 Price -
4’013’068
3/1977 Sam?“ 31' '
4,031,883
6/1977
Fehrm et al. .
magnitude and frequency of the control signals in the control
of the device. By sensing the changes in the magnitude and
-
-
4 031 884
4:072:145
6,1977 Hamel
2,1978 Silva _ '
4,149,716
4/1979 scudder _
changes in the electroencephalographic and electromyo
4,195,626
4/1980 Schweizer .
graphic biopotentials are correlated to control of the device.
4,228,807
10/1980 Yagi et al. .
4,334,545
6/1982
frequency of the control signals, the user is able to learn a
combination of mental and/or physical activities for which
Shiga .
_
4,354,505 10/1982 Shiga.
4,375,177
_
50 Clams, 9 Drawlng Sheets
3/1983 McCoskey .
Micro?che Appendix Included
(2 Micro?che, 190 Pages)
(List continued on next page.)
Basic
Operating
\33 Sym
Proessor
Background
39\ 3_1
Forgmumi
Lon
Processor
Processor
r
Control
I
Signal
Display
Generate
Generate
Phase -
\
Applicati
Locked 34 Programs
Loop
\_ 43
5,474,082
Page 2
US. PATENT DOCUMENTS
4,412,547
11/1983 Callahan ‘it a1~
4,417,592
11/1983
John ...................................... .. 128/731
4,424,816
1/1984 Callahan et a1. .
4,454,886
6/1984 Lee.
4,846,190 7/1989 John .
4,883,067 11/1989 Knispel et a1. .
4,919,143
4,928,696
4/1990 Ayers .................................... .. 128/732
5/1990 Henderson et a1. .
4,928,704
5/1990 Hardt.
‘ 4,949,726
8/1990 Hartzell m1.
$51332; 3113:: 25221‘ et 81
4,967,038 10/1990 Gevins et 51..
41595013
6,1986 Joneseta1_'_'
4,974,602 12/1990 Abraham-FuchsetaL.
4,603,703
8/1986 McGilletaL.
4,984,188
1/1991 Katq
4,610,259
9/1986 Cohen eta1..
5,002,064
3/1991 Allam et a1-
5,038,782
8/1991 Gevins et a1. .
4,776,345 10/1988 Cohen (2131..
4,794,533 12/1988 Cohen.
4,7()9,702
12/1987 gel-win _
5,119,816
5,213,338
6/1992 Gevins.
5/1993 Brotz
4,800,888
5,253,724
1/1989 Itil et a1. .
273/460
10/1993 Prior ........................................ .. 180/65
US. Patent
Dec. 12, 1995
Sheet 1 0f 9
L'I'u. 1
5,474,082
29
11
lOq
20\
User
*
User
Data
Basic
Input
Store
Language 33
Devices
2% Electrodes
3
r11
.5
\ Eater
24
19\
‘Operating
Processor
€
Keyboard
W\13
Am lifier
\
'
I
31
\
_'
Eaclcground lli‘dorground
on?
009
:4) Processc/n;32 Processor
*
.
.
25
System
39
=
Al D
,
15
\ Converter
Control
41K\
Display
Signal
i
Generator
Generator
\
i
’ l’.
htléléices 1
17 1'
1
"
Phase- \
g
37
Application
Locked 34 Programs
,- Processing
Loop
\_
43
arr?!
“19 l l 19 JL
LED
Video
LCD
MIDI
x
£12
L14
j
21
t
16 ‘—|51
DIA
Converter
D
l
\
Contact
58
Interface
,
55\
Music
Analo
Devices
Synthesizer
Control er
52J
\60
..
Digital
Controller
I 563
US. Patent
Dec. 12, 1995
5,474,082
Sheet 2 of 9
FIG. 2
Background Loop
Initiate Every
\
FIG- 3
0.01 Seconds / ‘202
Generate Control
204
Signals
Foreground Loop
‘L
'
300x
Phase-Locked
Initialize Values
Loo
Enter Files
S v
'
'
‘’
'
and Utilities
\206
P
tore
Information
\208
q
302
Enable
Background
Priority
@
Interrupt
Generate
~304
Displays
< Menu Control >‘J 306
l
i
312
314
J
/
Play
Compose
Computer
Cursor
Music
Music
Game
Control
Program
J
308
Program
/
310
Programs
Programs
316
k
320
J—'
1
/
Mouse
Keyboard
Controller
Cursor
and Line
Interface
Program
Editor
‘318
US. Patent
Dec. 12, 1995
5,474,082
Sheet 3 of 9
FIG. 4
Control Signal
Generator
Service Time
Interval n
" 402
1
Read
Brain~Body Signal
v 404
408
All Control
Yes
Signals Serviced?
418
1
Service
N0
Compute Cosine and Sine
From Lookup Tables
Moving Average
Window Counters
\.
410
Calculate X and Y
Quadrature Values
from Current Sample V412
Calculate Average of
8:. Y Quadrature Values"414
Calculate Magnitu de
and Phase of
Control Signals
/
v 416
W
Return
US. Patent
Dec. 12, 1995
Sheet 4 of 9
5,474,082
FIG. 5
( Phase-Locked Loop )
501
All Control
Signals Serviced?
502
H
NO
.
No
\K Magnitude>Minimum’? >_
Yes
Convert Phase
to 0360 Degrees
506
508
504
(\
BasePhase=O
prevphase=o
Lockin FreqShift=O
First Time
Magnitude>Minimum?
N0
*4
Yes
BasePhase: —Phase
_
I
\
510
512V Calculate Direction
of Phase Shift and
Update BasePhase
i
514 \ PhaseChange=Phase+BasePhase
PrevPhase=Phase
PhaseChange
520
&
\
Increment
Lockin Freqshift
l
k.
,
518
522
/
Decrement
Lockin FreqShif t
t
US. Patent
Dec. 12, 1995
Sheet 5 of 9
5,474,082
FIG. 6
602
618\
620\\ 628\
Displey
600
Musie
Games
6303
F612
)
T3
Setup
610
(
K.
T1 T2
(606
Cursiar
Al
A2 A3
B1
‘Frequency
B2
B3 B4
(607
Escape
C608
Help
US. Patent
Dec. 12, 1995
Sheet 6 0f 9
5,474,082
FIG. 7
( Play Music )
i
es
r‘ 7 01
All Control
Signals Serviced?
,
No
702 '\ Control léngn_al\Yes
Disabled?
'
No
First Time On
'
704
status of
Off
Control Signal?
706
*
First Time Off
1 ‘
Yes ,
‘
On
Program
‘
""‘\ Change
710
Pitch Transpose
J
f‘
MIDI Program
Changes On
Other Channels
Notes
Channel.
Volume
*
1
q
Compute Volume
712
l’
6
Disable Other
Control Signals "718
\
j
Tug???zgle
Service
Rhythm
Routine
Service Harmony
Group
"715
L
Turn
-
Rhythm Change
714 \ Not‘e On
_)
Update
Left/Right Pan
70s\ ,,
724
j
722
Off
0
service
AS13511”8
\
728
US. Patent
Dec. 12, 1995
5,474,082
Sheet 7 of 9
FIG. 8
D1splay
Music
Games
Cursor
Setup
Escape
Help
Games
Cursor
Setup
Escape
Help
FIG. 9
Display
Music
FOOD FOR THOUGHT
T1 T2
T3
Al
A2 A3
Bl
Frequency
B2
B3 B4
US. Patent
Dec. 12, 1995
Sheet 8 of 9
Games
Setup
5,474,082
F16. 10
Display
Music
Upmwn
A2 7
Cursor
Escape
Help
Escape
Help
PINBALL
E]
952
956
/
954
[21 _/ \
[I]
E
l
_
K512]
LelétgRlght
I
\ 958
K950
FIG. 11
Display
Music
Games
Cursor
Setup
SINGLE INPUT CONTROLLER
_
J
854
Up
__
856
864
Z“852
’
862
Down
Control
Opportunity
B3
Wmdow
Laso
_.
860 51v grrélde
US. Patent
Dec. 12, 1995
Sheet 9 0f 9
5,474,082
FIG. 12
Display
Music
Games
Cursor
Setup
Escape
Help
TWO INPUT CONTROLLER
,/‘882
876\ 878&
‘
I555
I51
7
I k-tsl
i=3
Left/Ri m
\,
[B38
872
880
%
"'*“886
Up/Down
Override
\870
FIG. 13
Display
Music
Games
Cursor
Setup
Escape
GAME CONTROLLER
Help
'
/
’
r
V
Z
Left/R1311
F B3
892
Select; Start
“
%
“
r
899
UP/Down
894v A1
B Button
A2"\896
A Button
B2\898
5,474,082
1
2 .
It has been suggested that training time can be reduced in
BRAIN-BODY ACTUATED SYSTEM
the alpha band by phase matching the biofeedback signal to
the bandpassed alpha spectrum signal. This is accomplished
by delaying the biofeedback signal by one complete cycle.
This application includes a Micro?che Appendix of
Computer Code comprising two micro?che that include 184
frames of computer code listing.
The delay is set as a function of the predetermined dominant
alpha peak frequency of the subject. This approach requires
that each subject have a predominant alpha peak frequency
that can be measured before training. However, one problem
BACKGROUND OF THE INVENTION
is that not all subjects produce spontaneous alpha. A further
disadvantage is that this form of phase loop closure will only
1. Field of the Invention
The invention relates generally to the area of non-manual
human control of external systems. More speci?cally, the
work for alpha control because theta and beta dominant
peaks are not easily predetermined. It also assumes that the
dominant alpha peak frequency of the subject wants to be
invention provides a control system with which a user may
kept constant over a session.
control an external device by regulating control signals in
The time varying characteristics of a bandpass ?lter
response to a collective manifestation of electroencephalo
output can be used to create an estimate of phase informa
tion. Likewise the FFT can provide phase measures as well
as magnitude measures. Thus phase information can be used
as a feedback signal as well as magnitude. However, other
graphic and electromyographic biopotentials. The invention
further provides the capability for the user to play music and
games and create visual art as training aids for improving
system control and for entertainment and relaxation.
2. Summary of the Related Art
Through the years there has been signi?cant research in
the area of detecting and observing various electric poten
tials generated within the human body for medical diagno
sis, biofeedback control of mental and physical states, and
control of external devices. In that work, it is well-known to
20
than the attempt to create phase matching to an alpha peak
frequency as discussed above, there are no instances in the
prior art in which use of phase information is successfully
incorporated into a biofeedback paradigm.
The contraction of skeletal muscle is preceded by a
25
sequence of rapid changes in the muscle nerve ?ber mem
brane potential. This sequence of potential changes is called
detect on the outer surface of the head electroencephalo
an action potential. Each time an action potential passes
along a muscle ?ber a small portion of the electrical current
spreads away from the muscle as far as the surface of the
intensities of the brain waves or EEG on the surface of the 30 skin. If many muscle ?bers contract simultaneously, the
summated electrical potentials at the skin may be great.
scalp range from zero to 300 microvolts, and their frequen
cies range from once every few seconds to 50 or more per
These summated electrical potentials are referred to as
second. Much of the time, the brain waves are irregular, and
electromyographic biopotentials (EMG).
no general pattern can be discerned in the EEG. However, at
EMG biopotentials have also been detected and used for
other times distinct patterns are present. For classi?cation
various forms of medical diagnosis and biofeedback control.
purposes, the EEG has been divided into a number of
Strong EMG biopotentials are usually considered to occur in
frequency spectrums. These frequency spectrums can be
a range of approximately 100 Hz-3000 Hz; but since the
classi?ed into ‘alpha’ (8 Hz to 13 Hz), ‘beta’ (14 Hz to 50
EMG is the summation of numerous action potentials, EMG
Hz), ‘theta’ (4 Hz to 7 Hz), and ‘delta’ (below 3.5 Hz).
biopotentials will occur below 100 Hz as well. Therefore,
Activities within the various EEG spectrums have been 40 EMG biopotentials contain frequency components between
correlated to states of sleep, relaxation, active thought, etc.
zero and 100 Hz. EMG biopotentials are typically detected
Depending on :he nature of the activity of interest, it is
at the site of muscle activity, for example, at the jaw to
well-known to detect EEG waves at different areas on the
monitor jaw tension or around the eyes to detect ocular
scalp as a function of the part of the brain of interest.
muscle activity. EMG biopotentials may be detected for
By providing a feedback: of EEG biopotentials in a 45 medical diagnostic purposes in which a patient observes
graphic (“EEG”) biopotentials or brainwaves which dem
onstrate continuous electrical activity in the brain. The
particular EEG spectrum, a subject may be trained to empha
their own muscle tension as a biofeedback signal. In addi
size or de-emphasize an activity associated with that EEG
tion, EMG biopotentials may be detected for the purposes of
spectrum thereby reinforcing or diminishing the mental and
physical state associated therewith. Further, work has been
done with a subject to provide a feedback of EEG activity in
a particular spectrum, for example, the alpha spectrum of 8
Hz-l3 Hz. Using that feedback, the subject learns to control
the magnitude of the alpha spectrum to energize a switch or
other external device. In other work, through training, a
subject is able to generate an alpha biopotential in response
activating a switch mechanism to control an external device.
Even though EMG biopotentials are somewhat easier to
50
control because they are produced by a physical activity, any
use in the prior art work of EMG signals is in response to an
averaged magnitude over a spectrum centered at 100 Hz or
more. That averaged magnitude is used to control a single
activity or switch. Therefore, a limitation of traditional EMG
A disadvantage in all of the above work is that one
signal processing is only a single channel of control.
Most of the prior work makes extraordinary e?forts to
work with signals representing either pure EEG biopoten
measurement site produces only one control. Using multiple
tials or pure EMG biopotentials. In the examples of EEG
to an external stimulus.
bandpass ?lters or a Fast Fourier Transform algorithm
(FFI‘), the EEG is divided into a number of frequency
spectrums. By employing these techniques, users have been
able to work with the time varying EEG spectrum magni
tudes. While pure EEG signals may be divided into a number
of frequency spectra correlated to mental states, it is very
di?icult to learn to control those spectra and mental states
and to maintain such control over time without extensive
practice.
55
work, the detection and processing of EEG biopotentials in
the range of approximately 0.5 Hz—35 Hz includes process
ing to reject EEG when it contains artifacts of EMG biopo
tentials. One approach is to inhibit the production of the
feedback signal if an undesirable attribute appears in the
EEG biopotentials. Another approach is to obtain a multi
plicity of EEG and EMG signals and inhibit feedback when
any of the EMG signals exhibit undesirable characteristics.
There is a potential problem in using an inhibit approach to
5,474,082
3
4
deal with an artifact. If a subject simultaneously produces
the correct EEG response while producing an inappropriate
EMG response, inhibition provides an ambiguous feedback
user selects a number of reference frequencies in a range of
cue. In that case, the absence of feedback due to inhibition
control signal is processed by a digital lock-in ampli?er
consisting of two quadrature phase detectors. The digital
selectable frequencies of from 0.5 Hz to 45 Hz which de?ne
a number of control signals in the control system. Each
suggests to the subject that they are not producing the
appropriate EEG response when in fact they are.
Other approaches that attempt to deal with artifacts
lock~in ampli?er samples the ?ltered input signal and peri
odically computes X and Y quadrature values at the lock-in
reference frequencies of the control signals. Time averaged
include: providing subjects with a cross-hair ?xation point to
limit eye movements, making EEG measurements as far
X and Y quadrature values at the lock-in reference frequen
cies are periodically computed by lowpass ?ltering the X
and Y quadrature values through moving average time
away from potential EMG sources as possible, for example,
the occipital and parietal regions of the scalp, and the
sensing of and subtraction of the comeoretinal potential
Windows. The time averaged X and Y quadrature values are
from the EEG. All of these approaches have inherent dis
tude and phase values at the lock-in frequencies. The user
converted to polar form by periodically computing magni
advantages. They either provide ambiguous or false feed
controls the length of the moving average time windows
back cues, require a multiplicity of measurement sites, or
thereby controlling the responsiveness of the control system.
The digital lock-in ampli?er is extremely effective in detect
ing periodic signals of low amplitude with a poor signal to
they reject the potential usefulness that might be gained by
the simultaneous presence of both the EEG and EMG
biopotentials. Therefore, even though there has been sig
ni?cant work with EEG and EMG biopotentials for several
decades, there have been few practical results.
20
SUMMARY OF THE INVENTION
noise ratio.
The control system uses a phase-locked loop around each
lock-in ampli?er to track frequency changes of the reference
frequencies of the control signals. This tracking of frequency
is driven by the changing phase measures obtained by the
with which a user may control a device by regulating a
lock-in ampli?er. An average of the phase of each control
signal is computed and used to indicate when the current
average phase is leading or lagging a base phase established
for each lock-in frequency. A constant phase difference
plurality of control signals in response to a user presentation
of the characteristics of an aggregate of EEG and EMG
frequency. A changing phase difference indicates that the
To overcome the limitations of current systems, a primary
object of the present invention is to provide a control system
biopotentials and feedback of the operation of the device.
According to the principles of the present invention, an
aggregate of the EEG and EMG biopotentials from the user
is processed by a digital lock-in ampli?er in a phaselocked
25
between two signals indicates that they are at the same
30
lock-in frequency increases, indicating that the control sig
loop to produce control signals, the magnitude and phase of
which may be selectively employed by the user to control
devices.
The use of an aggregation of EEG and EMG biopotentials
is an important feature of the invention. For electrodes
placed on the forehead, the invention detects surface bio
potentials resulting from both the EEG and EMG. Investi
gations with the invention have con?rmed the hypothesis
nal is lagging the lock-in frequency, the lock-in frequency is
35
ferent and separately detectable frequency spectral charac~
decreased to match or track the decrease in control signal
frequency. Likewise when the phase difference increases
negatively indicating that the control signal frequency is
speeding up relative to the corresponding lock-in frequency,
the lock-in frequency is increased to track or follow the
increasing frequency of the control signal. In this way, the
invention is able to track and follow the changing frequency
shifts of each control signal.
The magnitude values and shifting frequency values of
that the EMG measured at the forehead is actually a sum
mation of biopotentials from a number of muscle groups
such as the eye, frontalis, neck, jaw, etc. Further, that the
contributions from the different muscle groups exhibit dif
two signals may be at different frequencies, and this property
is used to create the phaselocked loop. When the phase
difference between a control signal and the corresponding
the control signals are presented as feedback to the user. The
45
teristics in the 0.5 Hz to 45 Hz range when using the
user is able to sense the magnitude and frequency changes
in the control signals in response to changes in the EEG and
EMG biopotentials resulting from the user’s activity. In this
invention. Further, that these diiferent spectral characteris
way, the user can produce desired control actions with the
tics can be consciously controlled. This ability to control and
detect separate muscle groups with the invention, allows
invention by guiding the changes in their control signal
magnitudes and frequency shifts.
immediate user access to multiple controls from one mea
surement site.
The control system has an advantage of using a single
measurement site to produce multiple control signals pro
The derivation of multiple controls from the presence of
viding the user with extensive capabilities, such as, multi
channel, or multi-axis control of devices, the ability to play
the EMG as well as the EEG at one measurement site,
distinguishes the invention from past approaches. In contrast
55
to the prior art, therefore, the invention does not attempt to
process either pure EEG related biopotentials or pure EMG
related biopotentials, but instead processes a signal derived
from an integral combination of both biopotentials. To
those capabilities are achieved using a single input channel
and signal with minimal connections and interference with
the user.
distinguish the invention from classic EEG signal processing
and classic EMG signal processing, the aggregate of EEG
biopotentials and EMG biopotentials used by the claimed
Because the invention makes use of both the EEG and
EMG manifestations in the brain-body signal, the user may
control the mix of the two signals; and the control system
has an advantage of responding to users of all levels of
invention will be de?ned for purposes herein as a brain-body
signal.
The control system ?rst processes the brain-body input
signal to produce a ?ltered input signal which changes in
response to changes in the EEG and EMG biopotentials. The
an electronic musical instrument or video game, the ability
to move a cursor about a video display screen, etc. Further,
control ability. The magnitude and frequency feedback of
65
the control signals to the user include audio and video
presentations in user selectable formats. Feedback training
paradigms are available to aid in user training. With the
5,474,082
5
6
control system, a user quickly becomes aware of their
FIG. 9 is a drawing of a graphical display for the training
game Food For Thought.
FIG. 10 is a drawing of a graphical display for the training
game Pinball.
FIG. 11 is a drawing of a graphical display for multi-axis
connection to the control system and experiences an imme
diate sense of control through conscious body movements,
such as eye movement, jaw tension, deep breathing, etc. In
only a few minutes or less, the user is able to consciously
direct the control signals which have been generated from
the brain-body signal and fed back to the user. With time,
users exhibit more subtle control, using smaller amplitude
control using a single control signal.
FIG. 12 is a drawing of a graphical display for multi-axis
control using two control signals.
brain-body signals as they begin to minimize the energy
required to accomplish magnitude and frequency loop
10
closure and system control. As the user becomes more
FIG. 13 is a drawing of a graphical display for a video
game controller.
pro?cient, the control system is able to provide the user with
expanded and more complex capabilities. Thus, the control
DETAILED DESCRIPTION
system has the advantage that the user should never expe
A system schematic diagram of the control system of the
invention is presented in FIG. 1. A user 10, for example, a
rience limitations in the control system’s ability to respond
to their most subtle inputs.
human, interacts with the control system 29 through control
There are several advantages to using the lock-in ampli
?er technique. Magnitude and phase values about each of the
control signal lock-in frequencies of interest may be quickly
computed, thereby permitting the responsiveness of each
of their brain-body signal detected by electrodes 22, through
20
other input devices 20, such as a keyboard 11, mouse 13, or
voice activation 15, and through information fed back to the
user from output mechanisms 21, such as, by audio and
measure to be individually adjusted. If the time between
visual means and the operation of devices. The input signals
when a user generates a signal and when the user receives a
from the input devices 20 are connected to a microprocessor
processing unit 30 by means of input interfaces 17. Once the
system is set up for a user, their brain-body connection may
measure of that signal is too long, the user will not experi
ence a sense of connection with the feedback device. Signals
in the theta band change more slowly than signals in the
alpha band, which change more slowly than signals in the
beta band. The invention accommodates those variations by
permitting different values of responsiveness to be set for
25
brain-body signal is preferably detected at the forehead,
however other locations may be used. Preferably, three
each control signal. Proportionally decreasing responsive
ness in the lower frequency band provides an additional
30
bene?t of increasing the frequency selectivity in those bands
where it is needed.
Another important capability of the lock-in ampli?er as
incorporated in the invention is the ability to change a
control signal lock-in frequency at any time and indepen
dently of the other control signal lock-in frequencies. In
be the sole operative input to the control system. Thus the
invention can be used by diiferently abled people. The
electrodes which include two signal lines and a neutral line
are attached to the forehead of the user. The physical
relationship of the two signal electrodes to the neutral or
ground electrode is a function of the application of the
system. For example, the neutral may be placed at a position
contrast to other signal transform techniques, such as FFT,
between the other two electrodes. This con?guration has
been found to provide the best sense of balance by users for
most loop closure activities.
The preferred electrodes are not standard EEG electrodes
a lock-in frequency can be shifted up or down any amount
at any time. The invention makes use of this capability to
input. But instead, the preferred electrodes have a larger
35
which have a relatively small surface area for more localized
create phase-locked loops about each of the brain-body
surface area, for example, electrocardiographic (“EKG”)
control signals.
electrodes, which will pick up more of the EEG potential.
Therefore, the signal will not be localized but will contain
These and other objects and advantages of the invention
will be apparent to those skilled in the art in light of the
more signal averaging. The three electrodes are mounted at
selectable positions in a head band. When worn by a user the
electrodes are applied to the forehead. The electrodes may
present disclosure including the accompanying drawings,
the detailed description of the invention and the appended
be silver/silver chloride hydrogel disposable electrodes
designed for resting EKG use, commercially available from
NDM. As will be appreciated, a supplemental tube gel may
claims.
BRIEF DESCRIPTION OF THE DRAWINGS
FIG. 1 is an overall block diagram of the control system
of the invention.
50
be used to reduce the electrical resistance of the junction
between the electrode and the user.
The ampli?er and ?lter system 24 ampli?es the brain
body signal output from the electrodes. The ampli?er and
?lter system has a gain of approximately 50,000 and pro
FIG. 2 is a ?owchart of a process for executing the
background loop program of the control system.
FIG. 3 is a ?owchart of a process for executing the 55 vides a bandpass ?lter with a bandwidth of approximately
0.5 Hz to 45 Hz. The ampli?er may be a Grass model P5
foreground loop program of the control system.
series A.C. pre-ampli?er and Grass RPS107 power supply.
FIG. 4 is a ?owchart of a process for generating control
The ?lter may be a KrohnI-lite model 3750 bandpass ?lter.
signals.
FIG. 5 is a ?owchart of a process for executing a
phase~locked loop program to adjust the phase of the control
signals.
The ampli?ed and ?ltered brain-body input signal repre
60
senting an aggregate of EEG and EMG biopotentials is
connected to an analog to digital (“A/D”) converter 26. The
connection to the A/D converter 26 may be solid wires with
electrical isolation means, infra-red transmission, radio
control signal display.
transmission or any commercially available serial bidirec~
FIG. 7 is a ?owchart of a music program and MIDI code 65 tional communication link. An AID converter such as model
FIG. 6 is a recreation of a brain-body time history and
generation routine.
FIG. 8 is a drawing of the musical player/trainer display.
ADA 1100 commercially available from Real Time Devices
may be used. The AID converter 26 contains an internal 100
5,474,082
7
8
H2 clock which is used to sample the analog brain-body
signal at a rate of 100 samples per second. The digital
brain-body signal is stored in data store 19 with each sample.
independent processor, and the foreground simply reads the
computed values as required.
When the control system is turned ON by the user, the
foreground loop of FIG. 3 is entered. The program at step
The brain-body signal processing may be accomplished
within a commercially available personal computer having a
processing unit 30 comprised of a 386 Intel processor and
5
math coprocessor with a 33 MHZ clock. Operating system
300 ?rst initializes values and reads the required ?les and
utilities. The default values for ten reference frequencies are
in a predetermined range of from 0.5 Hz to 45 Hz, and those
31 is comprised of software programs including the standard
DOS based operating programs and BASIC language pro
ten reference frequencies de?ning the control signals are
read from data ?les. At step 302, the foreground loop
processor enables the priority interrupt for the background
cessor 33. Other programs within the operating system 31 10
also include a background loop processor 35 and a fore
loop processor thereby permitting a background loop inter
ground loop processor 39 which are unique to the control
rupt generated every 10 milliseconds at step 202 of FIG. 2
system of the claimed invention. The background loop
processor 35 reads the brain-body signal from the A/D
converter 26 and uses a digital lock-in ampli?er provided by
control signal generator program 32 to produce control
to interrupt the foreground loop. With each interrupt, a
lock-in ampli?er is used to determine the magnitude and
phase values for each control signal at step 204. At step 206,
a phase-locked loop is used to determine changes in the
signals at reference frequencies the user has chosen from a
phase of the control signals, and the phase changes of the
control signals are used to change the reference frequencies.
range of selectable frequencies. Next a phase-locked loop
program 34 [forms a phase-locked loop for each control
The ?nal step 208 of the background loop program is to store
these values for future use by the foreground loop processor.
signal. The phase-locked loop permits the control system 29
to track the predominant frequencies of the brain-body
Upon completion of the background loop processor, the
signal within each selected control signal reference fre
quency band. Generation of the control signals and the
phase-locked loop are controlled by the same 100 Hz clock
that controls the A/D converter 26. Gain and responsiveness
of the control system are selectable by the user via the user
control signals are fed back to the user via audio and/or
video presentations, step 304 of FIG. 3. Via feedback
presentations of control signal magnitudes and reference
25
frequencies, the user is able to sense how changes of EEG
and EMG biopotentials effect the control signals. The
input devices 20. The processing unit 30 transmits data
between it, the operating system programs and the data store
response of the user determines the ?ow through the remain
over an internal data bus 41.
der of the foreground loop. Once entered, the foreground
loop processor 39 continuously loops back to the display
A display generation program 37 within the foreground
loop processor 39 uses the brain-body signal and generated
magnitude and phase signal values computed from the last
step 304 which updates the user presentations based on the
control signals as a basis for the presentation of various
audio and visual feedback to the user. Depending upon the
task being performed by the user, different visual displays
may be incorporated, for example, a video display terminal
14, an LCD display 16, or an LED display 12 may be used.
Further, the foreground loop processor 39 permits the user
interrupt. The user is then able to control functions of a
35
device in response to the control signals. More speci?cally,
using menu displays, the user modi?es the performance of
the control system during each iteration of the foreground
loop processor. The user chooses whether to execute a play
music program 308, a compose music program 310, a
input devices 20, such as a mouse or keyboard, to be used
computer game program 312, or a cursor control program
to select various application programs 43 for execution.
314. Under the cursor control program 314, the user can
User application programs include a play music program, a 40 choose to work with the mouse program 316, a keyboard]
compose music program, computer game programs, cursor
line editor program 318, or the controller interface 320.
control programs and mouse programs. The data store 19
The play music program 308 permits the user to play
stores data associated with the execution of programs within
music on an electronic musical instrument with control
the background loop processor 35 and foreground loop
signals in a manner similar to using ?ngers on a keyboard.
processor 39. External devices 55, such as a wheel chair, 45 As the user plays the music and senses, by sight and hearing,
cursor control, music synthesizer, a sailboat, etc, can be
the control signal presentations and the notes being played,
connected to the control system 29 and operated by the
the user is able to become aware of the relationships between
control system via a contact interface 54 and associated
the sensed characteristics of the control signals and their
switch closures within a digital controller 56 or a digital to
brain-body activity. Additionally, the user is able to learn
analog converter 58 and an analog controller 60. The pro
cessing unit 30 communicates with the devices 55 and
about music from the displays. While playing music, the
user can also choose to display a kaleidoscope which
output devices 21 over an input/output bus 57 which may be
an expansion bus typically found in personal computers.
FIGS. 2 and 3 illustrate the two principal processing loops
executed by the software in processing unit 30. The back
ground loop processor of FIG. 2 is a time dependent priority
interrupt processor and is executed every 10 milliseconds
presents a changing colored pattern. The turning ON and
OFF, screen location and assignment of color attributes to
the display pixels corresponds to the control signal magni
55
tude and phase values. Playing music has the bene?t of
providing the user with a rich and pleasing audio biofeed
back training paradigm. A compose music program 310
The time of execution may be controlled by an external or
internal clock and preferably is driven by the same 100 Hz
clock that controls the sampling of the A/D converter 26.
permits the user to compose new music. Music may be
The foreground loop processor of FIG. 3 is not time depen
dent. The foreground loop can be incorporated into the
of interest. Examples of this include such capabilities as
learning to increase alpha or theta band activity while
lowering beta band activity. Since the user simultaneously
receives biofeedback information about brain and body
activity, the control system permits the user to explore the
composed speci?cally to aid the user in the exploration of
their brain-body connection in designated frequency bands
background loop resulting in both programs being executed
once every 10 milliseconds. In the disclosed embodiment,
the foreground loop continuously executes while the back
ground loop interrupts every l0 milliseconds. In other
embodiments, the background loop may be executed by an
65
relationship between body biopotentials, EMG, and brain
biopotentials, EEG, in these bands.
5,474,082
9
10
Computer game programs 312 may be played with the
embodiment, up to ten control signal frequencies may be
selected and computed. The selected frequencies of the
control signals are speci?ed in terms of harmonics of the
fundamental frequency, as follows
control system of the invention. As well as being entertain
ing and challenging, the games provide opportunities for the
user to learn to work with the control signals derived from
their brain-body signal. The ability to consciously regulate
one control signal coupled with an opportunity window
display, to be subsequently described, or the conscious
Cfi
HF'ZT
regulation of two control signals simultaneously permits the
user to interface with the cursor movement programs 314
where
and mouse cursor programs 316. With the mouse cursor
capability, the user is able to access the control signal
actuated keyboard and line editor routines 318. The same
approach that is used for cursor control in the control system
is used in the controller interface program 320. The ways in
which controls signals are used for multiaxis control and the
implementation of an opportunity window to achieve mul
tiaxis from one control signal are discussed below.
FIG. 4 is a ?owchart of the control signal generator
program executed at step 204 of FIG. 2 of the background
loop and illustrates a process for generating control signals
from sampled brain-body signals. The brain-body signal
Cf,=frequency of the current control signal being pro
cessed,
Af= fundamental frequency, and
i=i,,, control signal.
The speci?c sine and cosine table position p from which
sin and cos values are to be read is determined by
where
2O
sample times, for example, once every 10 milliseconds,
using the 100 Hz clock within the AID converter to produce
sampled input signals. Consistent with frequency sampling
theory, the sample rate of 100 Hz is more than twice 45 Hz,
fsi=frequency shift from Phase-Locked Loop routine
block 520 or block 522, and
Phsi=previous table position, updated each time a new
output from the A/D converter 26 is sampled at successive
frequency shift is requested by the phase-locked loop.
25
if p<N, then operating within ?rst harmonic and may go
directly to table position p; but
if p>N, then must extract the number of harmonics as
follows:
the highest brain-body signal frequency of interest. The
control system generates a time history for each control
signal by averaging the quadrature values of each control
signal over respective moving average time windows.
To calculate the quadrature values of the brain-body
table positiom p = n; H,- — [ integer of ni (
signal required to implement the digital lock-in ampli?er,
sine and cosine values must be determined over a range of
Each time a shift in the lock-in frequency of a control
from zero degrees to 360 degrees. The control system
utilizes a table of sine and cosine values to increase the 35
processing speed. To implement the table, one cycle of a full
signal is requested, the phase shift value is assigned the
previous table position value; and the time based index is
reset to n=l. Resetting the time based index and de?ning a
sine wave has been divided into N increments; and sine and
cosine values for each of the N increments is stored in the
table. The increment size of the table is used to de?ne the
new phase shift value creates a smooth transition from one
lockin frequency to the next.
angular resolution, that is, fundamental frequency, of the
control system. A value of N=l600 increments has been
arbitrarily chosen to reduce memory storage requirements
for the table. Given a sample rate of 100 Hz, or 10 milli
seconds, this results in a fundamental frequency, Af=0.0625
Hz. The sin and cos values for each table position are 45
computed and stored during the initialization phase, step 300
At step 410, using the above, sin and cos values for the
lock-in frequencies of the control signals at the current time
based index are read from the table. Using those sin and cos
values, the X and Y quadrature values at the lock-in fre
quency of the control signal being processed are computed
for the current sample of the brain-body signal at step 412,
as follows:
of FIG. 3 as follows:
Xquad,=(bb,.)(c0s,)
Yquaa?bbnXsinp)
table cos,I = COS 21: (
a)
table sin” = SIN 211: (
lN )
where
bb,,=brain-body signal at the current index, and
sinp, cospqine and cosine table values.
55
N :Maximum table size, and
n =current value of a time based index from 1 to N.
Next, at step 414, the average values of the X and Y
quadrature values are computed. First, the X and Y quadra
The control signal generation program of FIG. 4 begins
ture values are added to respective X and Y moving average
with the servicing of a time index n at step 402. The index
time window ?lters. The user is able to adjust control system
is incremented by one with each iteration up to a cumulative 60 responsiveness for each control signal to match the user’s
value of N, or 1600 iterations. After N iterations, the index
perceptions. That adjustment is made by the user selecting
is set back to one. With each iteration, the sampled digital
the lengths of the moving average time windows in a range
brain-body signal is read at step 404 of FIG. 4 and held in
of from 50 samples to 300 samples. The length of both the
X and Y moving average time windows is the same and is
At decision step 408, an internal counter permits steps 65 adjusted in unison. Given a 100 Hz sample rate, the range of
410-416 to iterate a number of times equal to the number of
adjustment of the moving average time windows represents
control signals selected by the user. With the disclosed
a bandwidth about the center frequency of from 2 HZ to 0.33
a buffer store.
5,474,082
11
12
Hz. Therefore, if the user selects a more responsive system,
previously discussed, the lengths of the time windows may
be adjusted by the user; and the control system monitors the
user settings and adjusts the length of the moving average
time windows at step 418.
the control system reduces the length of the moving average
time windows by reducing the number of samples in the
windows. As the system becomes more responsive, the
lock-in frequency bandwidth increases; and the control
The lock-in ampli?er approach permits different window
system has less resolution about the selected lock-in fre
quency. Alternatively, if the user selects a less responsive
lengths for each control signal. If the user does not choose
to change these values, the invention defaults to values that
system, the control system lengthens the moving average
time windows by increasing the number of samples in the
have been chosen to improve high frequency responsiveness
windows. With a less responsive system, the bandwidth
about the lock-in frequency decreases, and the control
system has greater resolution about the selected lock-in
frequency. At step 414, for each of the X and Y moving
average time window sums, the oldest X and Y quadrature
values are subtracted from their respective sums, and the
new X and Y values are updated and added to their respec
tive sums. The average X and Y quadrature values are then
calculated by dividing each of the X and Y quadrature sums
by the size of the time window, that is, the total number of
samples used for averaging as determined by the respon
siveness selected by the user. Therefore, the X and Y
and low frequency selectivity at the same time. Window
10
widths relative to the center or 5th lock-in frequency are
de?ned at the start of the program as follows:
After the control signal magnitude and phase values have
been determined, the phase-locked loop, step 206 of FIG. 2,
of the background interrupt routine is executed. Referring to
20
quadrature average values are calculated as follows:
25
FIG. 5, the phase-locked loop program must be executed a
number of times equal to the number of control signal
frequencies selected by the user. Therefore, at step 501, the
process checks to determine whether all the control signals
have been serviced. If not, at decision step 502, the process
determines whether the magnitude of the control signal
being considered is greater than a user de?nable minimum
value. If not, the base phase, previous phase, and lock-in
frequency shift values are reset to zero, at step 504, in
preparation for when the magnitude does exceed the mini
mum. A minimum magnitude test is preferred to eliminate
30
those signals which cannot be distinguished from noise, and
the phase-locked loop routine will only process control
signals having a magnitude greater than the minimum.
Typically, an acceptable minimum signal magnitude is at
least 5% of the maximum signal magnitude. In the absence
35
of a user selection, the minimum is defaulted to 5%.
If the control signal is greater than the minimum, the
phase for that control signal is adjusted to a range of between
0 degrees and 360 degrees per step 506. It should be noted
where
W,=size of the in, time averaging window, and
W,~1',,, time average window index from 1 to W,-.
that the calculated X and Y quadrature values are vector
40
be used to identify in which quadrant of a 360 degree unit
circle the vector is located. The :90 degree phase values,
The user also has the ability to set and adjust the value of
a gain to be applied to each of the control signals, and those
control system gain values are stored. At step 416, the stored
control signal gain values and the averaged X and Y quadra
which were determined at step 416 of FIG. 4, may be used
to de?ne the speci?c vector location in the identi?ed quad
45
rant.
50
If this is the ?rst time that a control signal is greater than
the minimum, the lock-in frequency phase is matched to the
control signal phase. At step 510, a base phase, which is a
reference phase, is established by setting its value equal to
the negative of the present phase value of the control signal
for the current sample of the input signal. For the ?rst time
processing of that control signal, the remainder of the
routine of FIG. 5 provides no additional processing. There
fore, with the ?rst iteration, the control signal being pro
ture values are used to compute time averaged magnitude
and phase values of the brain-body signal corresponding to
the control signal lock-in frequencies being generated for the
current sample of the brain-body signal as follows:
Ynvgi
phase,- = aretan X
quantities. Therefore, the signs of the quadrature values may
55
3i
cessed by the phase-locked loop is brought into phase with
detected by decision block 408, the moving average time
the current phase of the brain-body signal at that lock-in
frequency. During a subsequent iteration of FIG. 5 in the
processing of another sample of the input signal, if that
control signal has a magnitude greater than the minimum,
the process moves through step 508 to step 512.
At step 512, the direction of phase change from a previous
phase value to the present phase value is determined. The
control system assumes that the direction of phase change is
de?ned by the minimum path, that is, the shortest distance
around a 360 degree unit circle, in moving from the previous
to the present phase values. If the minimum path is de?ned
window counters are serviced at process step 418. As
by counterclockwise movement around a 360 degree unit
where
G,=user selected gain for i,,, control signal
60
Even though the arctangent function is recited, other iden
tities may be used to de?ne the phase. It is typically de?ned
in a range of i90 degrees.
After the magnitude and phase values for all the control
signals have been evaluated for the current time index, n, as 65
5,474,082
13
14
circle, the current phase value is assumed to be lagging the
control signal, and the length, or height, of the bar represents
the magnitude of the respective control signal. The system
previous phase value. Conversely, the current phase value is
interpreted as leading the previous phase value if a clock
wise movement results from the minimum path. If the
provides the user with up to ten frequency spectra, three in
minimum path results in crossing the 0/360 degree point of
the theta, three in the alpha and four in the beta frequency
range. The theta bands are displayed in blue, the alpha bands
a unit circle, the base phase value is adjusted by adding or
subtracting 360 degrees according to whether the current
in green and the beta bands in red. While the control system
phase is lagging or leading, respectively.
colors of the bands shift in color shades to indicate to the
user the up and down shifting of the lock-in frequencies as
At step 514, a phase change of the current phase value
relative to the base phase value is computed by algebraically
adding the current phase value to the adjusted base phase
value. The phase change represents a difference between the
base phase value and the current phase value. Further, the
previous phase is set equal to the current phase value in
preparation for the next iteration.
At step 518, the phase change value of the current control
signal is tested to determine whether the "current control
signal is lagging or leading the base phase value of the
is running and the phase-locked loop is functioning, the
10
two slide controllers 624 and 626 which allow the user to
15
window 625 and the gain slide controller 624, the user is
signals. Using the control signal selection window 627 and
the response slide controller 626, the user can tune the
20
detected to be greater than a predetermined arbitrary mini
mum amount, for example, i 45 degrees, a frequency
change of the lock-in reference frequency of the control
signal is initiated. This is accomplished by incrementing or
decrementing a frequency shift at steps 520 and 522, respec
tively. If the control signal is leading as indicated by the
adjust gain and responsiveness, respectively, of all or any
selected control signal. Using the control signal selection
' able to change gain values for all or any all of the control
current control signal by a predetermined arbitrary minimum
amount, for example, i45 degrees. If the phase change is
they follow the frequency shifting of the user’s control
signals. The screen 604 also displays the time history 614 of
the user’s brain-body signal. The screen 604 further displays
responsiveness of the system to match the characteristics of
the tasks being performed. For example, the playing of video
games usually requires a high degree of responsiveness and
less selectivity, while the playing of certain musical pieces
wants a higher degree of selectivity and a slower responding
25
system.
Using the mouse or keyboard devices 20 of FIG. 1, the
phase change value being more negative than ~45 degrees,
user can access the various menu selections. The display
the lock-in frequency is incremented at step 520 to cause the
lock-in frequency to be shifted up to catch-up to the control
menu 618 allows the user to select various time history
signal. A positive value of phase change greater than 45
degrees indicates that the control signal is lagging the
displays such as the brain-body signal illustrated, control
30
The music menu 620 allows the user to select the compose
reference value, and the lock-in frequency is decremented at
step 522. Preferably the lock-in frequency is shifted up and
down in multiples of a predetermined frequency increment,
for example, the fundamental frequency, Af. The lock-in
frequency shift is accomplished at step 410 of FIG. 4 by
assigning the phase shift value the immediately prior table
position value, and resetting the time based index to n=1.
Resetting the table position and de?ning a new phase shift
signal magnitudes, control signal phases, etc.
music routine or the play music routine of FIG. 7. The play
music routine presents a ?rst screen having displays similar
to FIG. 6, that is, a time history of the control signal and bar
35
graphs with on-olf musical switches included. The play
music musical routine also provides a training screen 802
illustrated in FIG. 8, and a kaleidoscope display, not shown.
The game menu 628 permits the user to select and play
training games. The cursor menu 630 allows the user to
value creates a smooth transition from one lock-in frequency 40 either work with the mouse cursor, use the cursor controlled
to the next. As will be appreciated, other phase change tests
may be implemented. For example, a test may be made to
determine whether the phase change di?fers from the base
phase value by 90 degrees, 135 degrees, etc., and the lock-in
frequency shifted by appropriate multiples of the fundamen
tal frequency.
keyboard and line editor, or work with the controller inter
face for the control of external devices. The setup menu 606
allows the user to customize the control system to individual
needs. One setup menu selection allows a control mode in
45
signals generated by the brain-body signal. In this way,
A phase-locked loop can also be employed with an FFI‘.
However, with the FFT, the ?mdamental frequency is
inversely related to the responsiveness of the algorithm.
Thus, to obtain responsiveness comparable to what is pos
sible with the lock-in ampli?er, would result in frequency
which the control system may be setup in response to control
differently abled users can be initially setup by an attendant
and then left on their own with the invention. Within the
setup menu, the default values of the control signal reference
50
frequencies may be changed. Since the system is digital, the
selection and modi?cation of control signal frequencies is
steps of no less than 0.78125 Hz (based upon a 128 point
based on discrete increments de?ned by a fundamental
transform and a 100 Hz sample rate). Therefore, the equiva
frequency. Further, as with any frequency responsive or
resonant system, to fully exploit the capabilities of the
control system, the selection of the control signal frequen
cies should consider the in?uence of harmonic relationships
between chosen frequencies of the control signals. The
lent FFI‘ phase-locked loop can not function at as ?ne a level
as is possible with a lock-in ampli?er based phase-locked 55
loop. Usually, no more than four steps up or down are
needed to create an effective phase-locked loop. The shift in
the lock-in phase is fed back to the user through visual and
frequencies should be chosen so that the control system
audible displays as will be hereinafter described.
signal processing minimizes the ?rst order harmonic distor
FIG. 6 illustrates the primary screen of the invention by
which the control signals are presented to the user by being
displayed on video monitor 14 of FIG. 1. User interaction is
provided along the top area 602 of the screen 604 which
tions. Therefore, the above considerations may impose some
constraints on the selection of control signal frequencies and
the separation between selected frequencies. Those con
straints may be implemented as defaults in the control
contains various pull—down menus. Below the menu area
are simutaneously presented as a series of bar graphs on a
system or may be overridden by the user. The escape menu
607 allows a user to retum to a previous display or program
status at any time. The help menu 608 provides access to a
graphic display 600. Each bar 612 represents a selected
user’s manual.
602, the control signals derived from the brain-body signal
65
5,474,082
15
16
Once computed, the magnitudes and frequency shift val
the composing process, as are channel volumes. Rhythm in
the form of note accenting can be speci?ed for selected
ues of the control signals provide feedback links between the
user, the control system program and any associated devices.
By controlling these values, the user controls the system. To
make use of the changing magnitude levels, user selected
predetermined ON and OFF switch levels are de?ned for
control signals as part of the composing process. The
frequency shifting values computed by the phase-locked
loop routine can be used by the composer to control pitch
transposing, rhythm shifting and stereo panning.
each control signal. The ON and OFF switch levels represent
As part of the composing cycle the composer speci?es
which control signals will make use of the frequency shift
information. To bring further direction to a piece, the capa
predetermined control signal magnitudes which are e?fective
to control functions on external devices. When the user
causes the magnitude of a control signal to exceed the
associated ON switch level, the control system responds
bility of commanding program changes when a control
signal switches ON is also included. Such program changes
with an appropriate function. In the music program, for
example, this may result in a note being turned ON; or if the
can be speci?ed with this capability by the composer.
as changing voices on other control signal related channels
note is already ON, the volume tracking the magnitude of
the control signal. Alternatively, the cursor control program
A simple format is followed to write a song and enter it
15
may use the control signal switch to direct cursor movement
in a desired direction or to effect a switch closure associated
with the operation of an external device. When the user
causes the control signal magnitude to be equal to or less
than the OFF switch level, generally the opposite function is
the invention. Once a user selects a song to play, playing the
20
selected song really means playing a synthesizer through
25
control of their brain-body signal. Playing the synthesizer by
changing the individual control signals of their brain-body
signal is analogous to playing the keys on the keyboard of
the synthesizer.
A play music routine is presented in ?ow diagram form in
initiated. For example, a note is turned OFF, a switch is
opened, etc. Although different control signal magnitudes
for the ON and OFF switch functions are preferred, the ON
and OFF switch functions may be achieved by determining
whether the control signal magnitude is greater or less than
a single predetermined switching level.
The shifting of the control signal lock-in frequencies may
FIG. 7. Prior to executing the routine, the user selects a
template for a piece of previously composed music. At step
be used as controllers in much the same way that the
701, the process determines whether all of the control
changing magnitudes are used. The speeding up and slowing
down of the frequencies are natural controllers for providing
direction in the music routine. The frequency shifting is used
30
to actuate transposition, rhythm changes and left/right pan or
stereo balancing. In the case of cursor movement and control
of external devices, the magnitude and corresponding fre
quency shifting allow two axis control. For example, the
magnitude is used for up/down movement and the frequency
shifting is used for left/right movement. The system permits
35
the user to control a function for an external device in
response to one or any predetermined number of incremental
frequency shifts of the lock-in frequency.
into the computer. Simple songs can be easily written by
beginning users. The writing of more musically complex and
sophisticated songs may take more skill. Therefore, precom
posed songs including training songs are provided as part of
40
signals have been processed during this execution of the
play music routine. At process step 702, the routine ?rst
determines whether the control signal is being disabled by
another control signal. This results from another control,
prior to this point, turning on the disable function for this
control signal. If so, the remainder of the routine is skipped
for this iteration. If not, the status of the control signal is
determined at process step 704. The decision step 704
determines whether the signal is above the ON-switch for
the ?rst time, whether it has been ON and is now ON,
whether the signal is OFF for the ?rst time, or whether it has
been OFF and is now OFF. This determination is made in
The music program allows the user to interface with a
terms of the present magnitude and the past magnitude
synthesizer to play music by generating code that uses the
relative to the ON and OFF switch levels for this control
MIDI standard. The music routine makes use of MIDI
functions to create a structure which when ‘played’ by the
signal.
If the control signal is on for the ?rst time since it was last
user with their control signals, produces a musical experi
ence having content, form and direction. Songs are ?rst
composed by the user or the user can request previously
composed songs. The composed songs are structures or
templates through which the user plays or creates music by
45
changing the magnitude and frequency of their control
50
switched oif, at step 706, the routine determines whether the
control signal is to be used to cause program changes of
other control signals. If so, at process step 708, program
change commands such as a change of voice on a speci?ed
MIDI channel are sent to the MIDI interface 51 of FIG. 1.
signals.
If instead, notes are to be played with this control signal,
requested pitch transposition, left/right pan and/or rhythm
Composing a song involves creating a template that can
then be accessed by a user to play music. Within the
change commands are implemented per step 710. Pitch
transposition involves shifting the pitch of the notes to be
template, the composer speci?es ON and OFF switch levels
played on this channel up or down a speci?ed number of half
for each control signal that is to be used for playing the 55 steps times the number of steps the lock-in frequency for this
musical piece. The notes to be played by each control signal
control signal is presently shifted. Rhythm change is also
and what channels to map them to in the synthesizer are
serviced at this time. The rhythm is increased or decreased
speci?ed. Harmony groupings and the notes for melody
strings for the different control signals are also speci?ed. To
allow the presence of opposing harmony groups and melody
by an amount proportional to the frequency shift change
occurring for this control signal. Likewise, a left/right pan
strings in the same piece, a disabling capability is available.
The composer speci?es what other control signals are to be
disabled when a given control signal exceeds it’s ON switch.
The responsiveness of each control signal can be speci?ed
by the composer in terms of the length of the moving
average time window ?lter for that control signal. The
mapping of voices to MIDI channels is speci?ed as part of
proportional to the amount of frequency shift, minus to the
left and plus to the right. At step 712, a volume level is
command is sent to the synthesizer to shift the stereo balance
computed as a function of the current magnitude of the
.control signal. A note ON command is sent to the MIDI
65
interface 51 with the desired pitch and newly computed
volume per step 714. If a harmony group is to be played by
this control signal, pursuant to step 716, the rest of the notes
5,474,082
17
18
of the harmony group are turned ON. Finally, if this control
signal is to disable other control signals while ON, disable
Choosing the cursor menu 630 of FIG. 6 allows the user
to access the controller portion of the control system to
switches for those channels are now set per step 718.
create an interface to either move a mouse cursor through a
maze, use the same mouse cursor to move about a displayed
Returning to step 704, if this control signal is ON and has
been ON prior to this pass through the play music routine,
at process step 720, an updated volume level is computed
keyboard to make use of a line editor, or interact with
external devices. The controllers determine how the control
signals are used to permit cursor movement and multi-axis
control. FIG. 11 illustrates a screen 850 that may be used to
and sent to the MIDI interface. If the notes played with this
control signal are to provide a rhythmical pattern and a beat
such as 4—4 time, a rhythm routine is serviced at step 722.
establish limits on the use of one control signal. In this
Rhythm is accomplished by turning the notes ON and OFF
and accenting the notes at the appropriate time. A back
illustration the control signal B3 has been selected by the
user to be used as the operative control signal. When the
ground loop counter is used to determine when notes are to
be turned ON and OFF and when to be accented. If the
magnitude of B3, as indicated by the center rectangle 852
exceeds the preset ON-switch limit 854, action occurs in the
routine at step 720 determines that the control signal is
below the OFF switch and it has been OFF prior to this
direction indicated by the opportunity window pointer 856,
for example, the up direction as illustrated. As long as the B3
control remains ON, action continues in the same direction.
When B3 has a magnitude such that the center rectangle 852
is below the ON-switch 854, the action ceases. If no action
iteration, the play music routine is discontinued. However, if
the control signal is below the OFF-switch for the ?rst time,
any notes that were turned ON are now turned OFF at step
724. Any disable switches that were set are turned OFF at
step 726. Finally the melody string routine is serviced at step
is commenced by the user, the opportunity window pointer
20
remains in one location for a preselected time interval called
728. This involves selecting the next note to be played when
the control signal goes above the ON-switch as detected at
the dwell time. After the dwell time has elapsed, the pointer
step 714.
Referring to FIG. 8, the musical player training screen
example in FIG. 11, the pointer will step from ‘up’ to the
802 is illustrated and is accessed through the music menu
620. As a control signal goes above a corresponding ON
steps to the next direction in a clockwise direction. For the
25
‘right’. In this way, the pointer automatically steps through
each of the opportunity window directions. By synchroniz
ing their ON-OFF movements with the location of the
opportunity window pointer the user can actuate the desired
switch, a graphical ?nger 804 depresses a keyboard key 806
and an icon 808 appears indicating the note and voice being
two axes. The dwell time of the opportunity window is user
played. In addition, as the notes are played, they are anno
selectable. If the controller is interfaced to the mouse cursor,
tated on a moving musical statf 810. Slide controls 812 are 30 the controller selected action translates into cursor move
included so that gain and response of the control signals can
ment in the selected direction. If the controller is interfaced
be changed at any time during the playing of a musical piece.
to an external device the controller selection causes a switch
Examples of training games selectable through the game
closure or an analog voltage change resulting in a movement
or action of the external device in the appropriate direction.
menu 628 are described with reference to FIGS. 9 and 10.
These games help the user improve their ability to regulate
their brain-body derived control signals. The game “Food
For Thought” has the screen 902 illustrated in FIG. 9. The
35
control signals are represented as rectangles 904 that move
up and down as a function of their magnitude much like the
bar graphs of FIG. 6. A smaller rectangle 906 is preferably
override switch is to limit movement when the user gener
40
driven by a random generator to start at the right side of the
ates a brain-body signal component which indicates inatten
tiveness or distraction. Body movements resulting from
inattentiveness or distraction often cause large control signal
magnitude and phase changes, especially in the low fre
quency range. The override band is useful, for example, in
screen, and the computer thereafter moves it across the
screen from right to left. The rectangle 906 is called the food
beam. The user’s task is to move a selected control signal
rectangle 904 to an appropriate height to intersect the food
A second control signal is used as an override switch 860.
When the override rectangle 862 exceeds the preset ON
switch limit 864, the override is initiated. The purpose of the
the control of a wheelchair was being performed. For
45
beam. Audio feedback is provided to reinforce the occur
wheelchair control, the up/down 856 labels are replaced
rence of an intersection.
with forward and backward labels. The mapping of the
control signals to the control and override bands and values
A second training game “Pinball” has a screen 950
illustrated in FIG. 10. This game trains the user in two axis
for the ON switches are user selectable.
FIG. 12 illustrates a screen 870 which allows the use of
control. One control signal magnitude causes left/right
50
two control signals to achieve two axis control. In this
illustration, the user has selected the B3 control signal for
left/right movement as indicated at 872, and the A2 control
signal for up/down movement as indicated at 874. In the
55
initiated when the control signal magnitude B3 goes low
moving left/right rectangle 876 left of the left switch limit
878. A right direction motion is initiated if an increasing
magnitude of the B3 control signal moves the left/right
rectangle 876 to the right of the right switch limit 880. When
movement of the pinball 952. A second control signal causes
up/down movement of the pinball 952. The user selects
which control signals to map to the two axes of the pinball
952. In the illustrated screen 950, the user has chosen the
second alpha band control A2 for up/down and the third beta
band B3 for left/right control. The magnitude changes of the
selected control signal which results in pinball 952 up/down
movement of rectangle 956 is also displayed in a side bar
956, as is the control signal magnitude that causes left/right
case of left/right movement, a left direction motion is
movement of rectangle 958. In a second variation of this
pinball game, the user selects a control signal magnitude for
the B3 control signal magnitude goes low, the magnitude
pointer, or left/right rectangle 876, moves left; and when the
B3 control signal magnitude goes high, the left/right rect
angle 876 moves right. A similar paradigm is employed for
up/down movement and the frequency shifting of the control
signal for left/right movement. The task of the user is to
cause the pinball 952 to intersect with numbered score boxes
954. Playing this game develops two axis control skills. As
will be appreciated, other games may be generated which
train and develop three axis and other multi-axis skills.
65
the up/down movement. For example, an increase in mag
nitude of the A2 control signal causes the up/down pointer
882 to move up. When the pointer 882 crosses the ON
switch limits 884 or 886, the appropriate action, up or down,