1
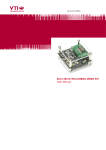
Murata MEMS Demo
User Manual
Murata MEMS Demo
User Manual
Murata Electronics Oy
www.muratamems.fi
Subject to changes
Doc.Nr. 82175700
1/33
Rev.A
Murata MEMS Demo
User Manual
TABLE OF CONTENTS
1 Introduction .........................................................................................................................4
2 Quick start for using the Murata MEMS demo ..................................................................4
3 Hardware overview..............................................................................................................5
4 Installation ...........................................................................................................................6
4.1
Installing Java ......................................................................................................................... 6
4.2
Installing FTDI drivers............................................................................................................. 6
4.3
Installing the Murata MEMS demo GUI .................................................................................. 6
5 Using the Murata MEMS demo ...........................................................................................7
5.1
Starting the GUI ....................................................................................................................... 7
5.2
Views........................................................................................................................................ 8
5.3 Setup view ............................................................................................................................... 9
5.3.1 Operation mode .................................................................................................................. 9
5.3.2 Temperature ..................................................................................................................... 10
5.3.3 Zero offsets....................................................................................................................... 10
5.3.4 Data rate........................................................................................................................... 10
5.3.5 Saving output data to file .................................................................................................. 10
5.3.6 Standard deviation ............................................................................................................ 12
5.3.7 Reset demo system .......................................................................................................... 12
5.3.8 Changing moving average filter sample count .................................................................. 12
5.3.9 Sensor-specific features ................................................................................................... 13
5.4 Accelerometer view .............................................................................................................. 14
5.4.1 Output data values............................................................................................................ 14
5.4.2 Sensor status indicator ..................................................................................................... 15
5.4.3 Changing the chart range ................................................................................................. 15
5.4.4 Chart data points .............................................................................................................. 16
5.4.5 Zooming the chart ............................................................................................................. 16
5.4.6 Taking a snapshot of the chart .......................................................................................... 17
5.4.7 Data rate indicator ............................................................................................................ 17
5.5
Accelerometer and gyroscope view .................................................................................... 17
5.6
Inclinometer view .................................................................................................................. 18
5.7
Sensor status view ................................................................................................................ 19
5.8
Register setup view .............................................................................................................. 20
5.9
Macro commands view ......................................................................................................... 21
5.10 About view ............................................................................................................................. 22
5.11 Application menus ................................................................................................................ 23
5.12 Advanced data logging ......................................................................................................... 24
6 Troubleshooting ................................................................................................................25
6.1
GUI won’t start ...................................................................................................................... 25
6.2
No evaluation boards found ................................................................................................. 25
Murata Electronics Oy
www.muratamems.fi
Subject to changes
Doc.Nr. 82169500
2/33
Rev.A
Murata MEMS Demo
User Manual
6.3
Cannot open connection to evaluation board ..................................................................... 26
6.4
No output data....................................................................................................................... 26
6.5
Power supply voltage error .................................................................................................. 26
6.6
Cannot send macro in Macro Commands view .................................................................. 27
6.7
Cannot check the syntax for macro command ................................................................... 27
7 Uninstalling the GUI and the USB driver .........................................................................28
8 Device connector ..............................................................................................................29
8.1
Chip carrier ............................................................................................................................ 29
8.2
16-pin connector for external board .................................................................................... 30
9 Electrical characteristics ..................................................................................................31
9.1
Power supply......................................................................................................................... 31
9.2
USB ........................................................................................................................................ 32
9.3 IO lines ................................................................................................................................... 32
9.3.1 Analog IO ......................................................................................................................... 32
9.3.2 Digital IO........................................................................................................................... 33
Murata Electronics Oy
www.muratamems.fi
Subject to changes
Doc.Nr. 82169500
3/33
Rev.A
Murata MEMS Demo
User Manual
1
Introduction
The Murata MEMS demo is a tool for evaluating component functionalities and key properties for
several different sensor families. It can be used with both the SCA3000 USB Interface Card and
the MEMS Evaluation Board. The main features of the Murata MEMS demo graphical user
interface (GUI) include:
•
•
•
•
•
•
•
View output data values on charts and on numeric indicators
Change chart ranges, freeze, zoom and take snapshots
Data averaging and standard deviation calculations
Save output data to file
View sensor status registers
Read and write other sensor registers
Send macro commands to the evaluation board
This document covers the actions needed to install the necessary drivers and the Murata MEMS
demo GUI software. The document also shows the different features of the GUI and how to use
them. The GUI supports both Windows and Linux operating systems using 32- or 64-bit processor
architectures. A USB connection is required for data transfer between the evaluation board and the
PC. In addition to the Hardware Overview section, the end of this document covers more detailed
hardware information.
2
Quick start for using the Murata MEMS demo
Please follow the steps below:
1. Insert the accompanied USB memory stick into the PC
2. Set up the hardware
- Turn on the external power supply (if necessary – depends on product to be
evaluated)
- Connect USB cable to USB connector on evaluation board and to PC's USB port
3. After the PC has found the device, wait until device driver installation is complete
4. Install the GUI software
- Copy the Murata MEMS demo folder from the USB memory stick to a folder on
your hard drive (for example C:\Murata MEMS demo)
5. Start the GUI software in Windows OS
- Double-click file start.bat to start the GUI
6. Start the GUI software in Linux OS
- Double-click file install.sh to configure USB device permissions (this step is
required only once after the installation)
- Double-click file start.sh to start the GUI
When using the Murata MEMS demo GUI software:
• The evaluation board should be connected to the PC before the GUI software is started
• Exit the GUI software before unplugging the evaluation board from the PC
• After the GUI software has closed, the evaluation board can be unplugged from the PC
During software start-up, your OS firewall may alert that the demo software wants network access.
The demo software can be operated without network access (but granting network access won't
change the software operation).
Murata Electronics Oy
www.muratamems.fi
Subject to changes
Doc.Nr. 82169500
4/33
Rev.A
Murata MEMS Demo
User Manual
3
Hardware overview
The MEMS Evaluation Board is shown in Figure 1. The sensor is connected to the evaluation
board with a chip carrier or by using an external interface board. If an external board is used (see
Figure 2), it is connected to a 16-pin extension connector. For sensors with a 5V supply voltage,
an additional external power supply is needed and is connected to the screw terminals reserved for
the external supply. The evaluation board also contains jumpers to select the correct operating
voltage for AVDD and DVDD separately. The USB cable is connected to the USB connector. For
more detailed hardware information, refer to the Device connector and Electrical Characteristics
sections.
Screw terminals
for external
power supply
Sensor soldered
to chip carrier
DVDD voltage
selection jumper
16-pin cable
connector for
extension board
Reset button
USB connector
AVDD voltage
selection jumper
Figure 1. MEMS Evaluation Board
Screw
terminals for
external power
16-pin cable
connector
Sensor soldered
on PCB
Temperature
sensor
Figure 2. Extension board (SCA10xT PCB)
Murata Electronics Oy
www.muratamems.fi
Subject to changes
Doc.Nr. 82169500
5/33
Rev.A
Murata MEMS Demo
User Manual
4
4.1
Installation
Installing Java
The demo GUI uses Java programming language, so the Java Runtime Engine (JRE) must be
installed. Usually this is already the case, but if the JRE is not installed, download the installation
package from Java’s website (http://www.java.com/en/download/index.jsp), execute the installer
and follow the instructions. Java installation can be tested by typing the command java -version to
terminal. In the Windows Command Prompt this should give an output similar to Figure 3 if Java is
working correctly (if not, please see the Troubleshooting section).
Figure 3. Output for java.exe using -version parameter
4.2
Installing FTDI drivers
Note: If it is necessary to update the FTDI driver, make sure to uninstall the old driver before
updating to the new one (see Uninstalling the GUI and the USB driver)
The FTDI driver is needed for communication with the evaluation board via the USB. If the driver is
not already installed, install it from the Drivers/FTDI folder or download the latest driver from the
FTDI website (http://www.ftdichip.com/Drivers/D2XX.htm). FTDI drivers can also be found from
Windows Update, so Windows might install the driver automatically when the demo board is
connected to the USB port. If Windows could not find the driver, manually browse to the folder
where the driver is located. See Installation Guides on the FTDI website for more detailed
instructions.
Linux users should read "Installing the D2XX shared library and static library" section from the
Drivers/FTDI/Linux/ReadMe.txt file for instructions on how to install FTDI D2XX drivers to the Linux
operating system.
Note: Always use the latest FTDI driver if the driver version is not specified in this
document.
4.3
Installing the Murata MEMS demo GUI
To install the GUI, just copy the Murata MEMS demo folder from the removable drive to a suitable
directory in your hard drive (for example C:\Murata MEMS demo). If the demo GUI was distributed
as a ZIP package, create a folder and extract all files and folders to this new folder.
To create a shortcut for the GUI on the Windows desktop, right-click the start.bat file and select
Send to -> Desktop (create shortcut). The Murata MEMS demo folder also contains an icon for the
shortcut (AppIcon.ico). This can be set for the shortcut by right-clicking the created shortcut on the
desktop and selecting Properties -> Change Icon and then browsing to the Murata MEMS demo
folder and selecting the AppIcon.ico file.
Note: Linux users must execute install.sh script after installing the FTDI drivers and
connecting the demo board to the PC. This will configure the access permission for the
FTDI USB devices using the UDEV module (this was tested using Ubuntu 12.04 LTS).
Note: If the demo GUI was distributed as a ZIP package, the user must also change file
permissions in Linux to be able to execute .sh script files since the ZIP archive does not
store file permissions. This can be done using the command: chmod +x start.sh.
Murata Electronics Oy
www.muratamems.fi
Subject to changes
Doc.Nr. 82169500
6/33
Rev.A
Murata MEMS Demo
User Manual
5
5.1
Using the Murata MEMS demo
Starting the GUI
To start the GUI, browse to the Murata MEMS demo folder and execute start.bat or start.sh file
depending on your operating system. This will first show the splash screen and then the view
shown in Figure 4.
Figure 4. Initial start view
This view can be used to select the evaluation board and sensor types and open the connection to
the board. To start the demo GUI:
•
•
•
•
•
Murata Electronics Oy
www.muratamems.fi
Select the connection type: USB or Virtual COM port (VCP)
Select the evaluation board hardware and the board ID from the list; if the ID list is empty,
click on Rescan to rescan for evaluation boards
Open the connection to the evaluation board by clicking the Connect button
Select the sensor type by using the controls product family and product type; if the sensor
supports auto detection of the sensor type, the Auto detect sensor type check box will be
enabled
Start the demo by clicking on Start demo
Subject to changes
Doc.Nr. 82169500
7/33
Rev.A
Murata MEMS Demo
User Manual
The connection can be either USB or serial port (VCP). The user must manually connect to the
evaluation board by clicking on Connect before proceeding. Note that the preferred connection type
is USB because this will provide the fastest and most stable communication. The serial port must
be used if the device is used over a Bluetooth connection. Images of the evaluation board and
sensor are shown on the UI after these are selected. Figure 5 shows an example of the UI after
selecting and connecting to an evaluation board and after selecting an SCA31x0 sensor.
Figure 5. Initial setup view after selecting an SCA31X0 sensor
If more than one USB device is connected, all devices will be listed in the Select demo board ID
field. If the user does not know the ID of the board, please disconnect all other USB devices and
click on Rescan to update the list (the list includes all devices using an FTDI chip).
5.2
Views
When the Start demo button is clicked, the application loads a sensor specific user interface. Each
sensor will have a Setup view that contains controls for measurements, for example to change
operating modes or the sample rate and to save output data to a file in the selected format. Each
sensor will also have an About view that shows application- and hardware-specific information.
Other views are sensor specific, for example a view to show output data values in sensor-specific
format. Each of the following subsections explains the features of these views.
Murata Electronics Oy
www.muratamems.fi
Subject to changes
Doc.Nr. 82169500
8/33
Rev.A
Murata MEMS Demo
User Manual
5.3
Setup view
The purpose of the Setup view is to provide controls for setting up the measurements and data
calculations. Controls in this view are specific for the sensor type, i.e. an accelerometer will have
different controls compared to a combination sensor with accelerometer and gyroscope. Also,
some controls might be disabled if the sensor does not support these features. All parameter
values are stored to an initialization file and they are reloaded automatically during the next start up
(except the controls Zero offsets and Save output data to file).
Figure 6. Setup view
5.3.1
Operation mode
The Operation mode control lists all possible operation modes for the selected sensor. Figure 7
shows an example of the SCA31x0 sensor. Additional operation modes typically include power
saving modes or special measurement modes. Changing the mode will first write the sensor’s
"mode" register, then flush the status registers, and finally reload the measurement setup (macro).
Note that this control is not visible if there is only one operation mode for the selected
sensor.
Figure 7. Control to change the operation mode
Murata Electronics Oy
www.muratamems.fi
Subject to changes
Doc.Nr. 82169500
9/33
Rev.A
Murata MEMS Demo
User Manual
5.3.2
Temperature
The Read temperature check box is used to enable or disable reading of the sensor temperature
values. This will modify and reload the measurement macro that reads the sensor output values.
Note that some sensors might read the temperature even if this check box is deselected; in this
case the measurement macro contains the commands to read the temperature but the returned
values are not processed. SCA10x-T sensors that are used with an extension board will
receive temperature from an external temperature sensor soldered to the board.
5.3.3
Zero offsets
The Zero offsets check box can be used to measure offset values and then to decrease those
automatically from the output data. Note that some operations will clear these values and then read
new values for the offset. For example, the offset might change after changing the operation mode,
so it must be updated for the new mode. This parameter value is not stored to the initialization file.
When the zero offsets feature is enabled, the data buffer for the moving average data will be
cleared. The next received output data samples are then used as offset values for any subsequent
data samples.
5.3.4
Data rate
The Data rate control is used to change the rate at which the output data is read. This feature uses
a specific measurement macro to produce a delay between macro execution cycles, and the exact
execution rate might vary. Note that when the SCA3000 USB interface board is used, this
control is changed to Measurement loop delay (us) control because the older interface
board macro language does not support the macro delay command needed to implement
the data rate feature.
Figure 8. Control to change data rate
5.3.5
Saving output data to file
To begin storing measurement data to a file, first select the data format using the Save output data
to file control. The user can choose to store raw output data values in HEX format, i.e. using the
same format in which the values were received from the sensor, or to store averaged data in
decimal format. Note that status information is not stored when the Raw mode is used. The user
can also press CTRL-S in any view to begin saving data in decimal format.
Figure 9. Control to save output data to file
Murata Electronics Oy
www.muratamems.fi
Subject to changes
Doc.Nr. 82169500
10/33
Rev.A
Murata MEMS Demo
User Manual
When one of the data formats is selected, the GUI will then query the path and file name for the
new data file. If the file already exists, a confirmation to overwrite the file is shown.
Figure 10. Confirmation to overwrite existing file
After selecting the file, data streaming to the file begins and an alert dialog view is shown. Other
views, except the output data view, are blocked while streaming data to file. Stopping the data
streaming will enable the other views again. This is done to prevent accidental changing of the
measurement parameters while streaming the data to the file.
Figure 11. Dialog shown while data is saved to file
Clicking on the End data streaming button will end the data streaming. The GUI will then show how
many samples were saved and how long the sampling took.
Figure 12. Information shown after saving data
The format of the output data file depends on the selected sensor and data format (raw vs.
decimal). The data file starts with a file header containing information on the time and date, the GUI
version and various GUI parameter values. Comment lines start with the ‘#’ character. The
statistics shown in the dialog when streaming ended are also appended to the end of the file. Each
data value is separated with whitespace, and each line ends with a system-specific new line
character(s).
Note: Because the amount of output data may be very large, data is split into several files,
each file containing 3 million lines of data. These files will have the original file name
appended with an underscore character (_) and an index number.
Note: This feature works only if the measurement macro used to read output values is
generated by the GUI. Refer to the “Advanced data logging” section for more information on
saving custom data values.
Murata Electronics Oy
www.muratamems.fi
Subject to changes
Doc.Nr. 82169500
11/33
Rev.A
Murata MEMS Demo
User Manual
5.3.6
Standard deviation
Shown below are the controls for standard deviation calculation (STDEV). The user can enable or
disable the STDEV calculation and also define the number of samples used for the STDEV.
STDEV calculation uses a separate data buffer, so changing the Moving average sample count
does not affect the STDEV result.
Figure 13. Control to change STDEV sample count
5.3.7
Reset demo system
The Reset demo system button can be used for restarting the data collection from the sensor. This
might be needed, for example, if something goes wrong after sending measurement macro
commands manually and the sensor does not operate as it was supposed to. After clicking this
button, the sensor configuration registers are reinitialized and the status registers will be flushed,
the operation mode is set, and the measurement macro to read output data is reloaded.
Figure 14. Button to restart data collection
5.3.8
Changing moving average filter sample count
It is possible to use moving average filtering for the sensor output data. The GUI takes a selected
amount of previous samples and calculates their average. The averaged values are then added to
the charts and optionally saved to file when using the decimal data format. Note that using a
moving average has no effect on the output data rate.
The user can change the number of samples for the moving average filter. The valid range is from
1 (no averaging) to 2000. The value is changed either by clicking on the small down arrow and
selecting a new value from the predefined list or by typing the value directly in the combo box. The
GUI checks the validity of the typed value and gives an error message if necessary. Gyroscopes,
inclinometers and combination sensors will have a similar control for the moving average sample
count.
Figure 15. Control to change sample count for the moving average filter
Murata Electronics Oy
www.muratamems.fi
Subject to changes
Doc.Nr. 82169500
12/33
Rev.A
Murata MEMS Demo
User Manual
5.3.9
Sensor-specific features
The Setup view can also show features that are sensor specific i.e. features are shown only when
a specific sensor is selected. For example, Figure 16 shows the Setup view for SCC2XXX
sensors. This view has a control to adjust output filter frequency, an option that is present only for
these sensors. The Setup view for combination sensors also includes an extra option in the
accelerometer panel; the Read accelerometer output check box can be used to enable or disable
the accelerometer reading (i.e. gyroscope only mode).
Figure 16. Sensor-specific features for SCC2XXX sensors
Figure 17 shows the Setup view for SCA3060 sensors. This sensor has controls for selecting
motion detector trigger parameters. These parameters will have an effect when the operation mode
is set to Motion detect (MD) mode.
Figure 17. Sensor-specific features for SCA3060 sensors
Murata Electronics Oy
www.muratamems.fi
Subject to changes
Doc.Nr. 82169500
13/33
Rev.A
Murata MEMS Demo
User Manual
5.4
5.4.1
Accelerometer view
Output data values
Shown below is the output data view for accelerometer sensors. The GUI can show output data
values on charts, as well as on numeric indicators. The output data values (possibly averaged by
the moving average filter; see 5.3.8) are added to chart traces (each trace is a line on the chart).
The numerical values Average, Minimum and Maximum are calculated for the data points currently
shown on the chart. In addition to the output values for each axis, the numeric values include
standard deviation (if enabled in Setup view) and possibly a resultant value. The resultant is
calculated according to the following formula:
Resultant =
x2 + y2 + z2
The output data view also shows indicators for the data rate, sensor temperature and sensor
status. The amount of data points on the chart can be changed using the Data points control and
the range of the chart using the Chart range control. Note that the amount of data points affects
only the number of output data values on the chart and not the averaged output value.
Figure 18. Output data view for accelerometer sensors
Note: The sensor axis count and axis directions are determined by the selected sensor type,
and output data values are shown only for these axes. If the sensor type was auto detected
and the wrong axis information is shown, check the About view to see if the sensor type
was correctly detected.
Murata Electronics Oy
www.muratamems.fi
Subject to changes
Doc.Nr. 82169500
14/33
Rev.A
Murata MEMS Demo
User Manual
5.4.2
Sensor status indicator
The Sensor status indicator shows the current status for the sensor ASIC. If the status color is
green there are no status errors. Red means there are status errors and they should be read by
using the Sensor status view. Typically the status errors are latched until the status registers are
cleared (read). If the status color is black, the sensor status is not read from the sensor. Sensor
status information (ok / fail) is also appended to the decimal data file while saving the data to a file.
5.4.3
Changing the chart range
The Chart range control contains predefined sensor specific ranges, as well as Automatic and
Manual modes. The Automatic mode scales the chart range according to the minimum and
maximum values shown on the chart. Use the Manual mode to set an arbitrary range between
predefined minimum and maximum values.
Figure 19. Chart range control
If the Manual mode is selected, the following dialog is shown (showing previously set values for
manual mode if they exist):
Figure 20. Dialog to set chart range manually
The user can then set the minimum and maximum values for the range. If the values are not valid,
an error message is shown. The Ok button accepts the new values and the Cancel button discards
the changes and restores the previous range. There is also a check box to use the current
minimum and maximum values from the chart (the values are taken from the chart when the dialog
is shown).
Note: Dot (.) character must be used as a decimal separator.
Murata Electronics Oy
www.muratamems.fi
Subject to changes
Doc.Nr. 82169500
15/33
Rev.A
Murata MEMS Demo
User Manual
5.4.4
Chart data points
This control specifies how many samples will be visible on the chart. Note that this control will have
an effect on the performance of the application when a large amount of data is visible on the
charts.
Figure 21. Dialog to set number of data points for the chart
5.4.5
Zooming the chart
The chart cannot be updated while zooming, so the user must first freeze the chart, then the left
mouse button can be used to zoom the chart. After zooming, the GUI shows data markers
according to the mouse position on the chart and their numeric values in a tool tip message. The
figures below show the chart before and after zooming. Use the Reset zoom button to zoom out.
Use the Update chart button to zoom out and start updating data points for the chart.
Note: Do not zoom outside the chart panel or the zoom will be reset automatically!
Figure 22. Chart before zooming
Figure 23. Chart after zooming
Murata Electronics Oy
www.muratamems.fi
Subject to changes
Doc.Nr. 82169500
16/33
Rev.A
Murata MEMS Demo
User Manual
5.4.6
Taking a snapshot of the chart
The user can save the chart view as an image to a file by right clicking the chart and selecting Save
image. You can then select the file name and path for the image.
Figure 24. Menu to take a snapshot
5.4.7
Data rate indicator
The output data view also contains an indicator for the data rate (Samples / second). The Data rate
control in the Setup view can be used to change the rate. If the difference between the Data rate
control value and the resulting data rate value is greater than ± 5%, the color for the data rate
indicator is changed to red.
5.5
Accelerometer and gyroscope view
The Accelerometer and gyroscope view shows the output data values for combination sensors.
The accelerometer and gyroscope will have their own charts and numeric values. Below is an
image for a sensor with a 2-axis accelerometer (XY) and a Z-axis gyroscope. Each sensor axis is
determined according to the selected sensor type.
Figure 25. View for combination sensors
Murata Electronics Oy
www.muratamems.fi
Subject to changes
Doc.Nr. 82169500
17/33
Rev.A
Murata MEMS Demo
User Manual
This view has similar controls for the charts as described in the previous section for the
Accelerometer view. The view can also show the temperature from each ASIC. If the combination
sensor has only one ASIC, then the same temperature is shown in both indicators.
Note: The Freeze / Update chart buttons will have an effect on both charts in this view, so
the charts will freeze simultaneously.
5.6
Inclinometer view
The Inclinometer view shows output data for 1- and 2-axis inclinometers. If the sensor uses the
differential measurement mode, then the numerical indicators Differential output [g] are shown. If
the sensor has separate X and Y axes, then the numerical indicators OUT(x) are shown to indicate
acceleration and the UI will show the calculated inclination angle for each axis separately. Figure
26 shows the UI for the SCA103T inclinometer.
Figure 26. View for differential inclinometer sensors
When the Start demo button is selected in the initial Setup view, the following dialog is shown if the
MEMS evaluation board supports several different extension board versions for the selected
inclinometer sensor. The user must then select the extension board type used for the specific
sensor. The extension board is connected to the 16-pin extension connector on the evaluation
board.
Figure 27. Dialog for selecting the extension board type
Murata Electronics Oy
www.muratamems.fi
Subject to changes
Doc.Nr. 82169500
18/33
Rev.A
Murata MEMS Demo
User Manual
Inclinometers have some additional controls in the Setup view. These controls can be used to
enable or disable power supply voltage measurement or to change the sample count for A/Dconversions.
The A/D-conversion sample count specifies the number of samples averaged before the averaged
value is sent to the GUI software (i.e. this averaging done in the embedded software of the MEMS
evaluation board). Because of this, the selected value has an effect on the data rate (refer to
Moving average sample count in section 5.3.8). If Read power supply voltage is enabled, the GUI
will receive a supply voltage value for every measurement data sample. This value is used to scale
the output values for ratiometric sensors.
Figure 28. Inclinometer controls in Setup view.
5.7
Sensor status view
The Sensor status view can be used to view latched status errors. When the Murata MEMS demo
GUI identifies a status error (either by using SPI-frame bits or by reading a status register) it adds
an event to the status log. The user must then use the Read status registers button to read all
status register values to clear latched status errors. Tooltips can show more detailed information for
the sensor status register bits as shown in Figure 29.
Figure 29. View to check sensor status registers
Murata Electronics Oy
www.muratamems.fi
Subject to changes
Doc.Nr. 82169500
19/33
Rev.A
Murata MEMS Demo
User Manual
If the bit color in the Status registers panel is green, the bit value is 1; if black, the value is 0. If the
bit color is red, it means the bit indicates a status error but the value can be either 0 or 1 depending
on the specific sensor type.
The Clear log button does not read anything from the sensor; it will only clear the Status log
indicator.
5.8
Register setup view
The Register setup view contains controls to read and write sensor-specific registers. There are
separate indicators for data read from the sensor and data to write to the sensor. The user must
select the memory and register from the drop down menus. The view will read the register
automatically when the register is selected from the menu. The Read register and Write register
buttons can also be used to read or write the register.
After writing the register, the Murata MEMS demo GUI will automatically read the register back to
verify that the data was correctly written to the register. If the write was not successful, the Data
from sensor indicator will show a different value compared to the Data to write indicator.
Figure 30. View to read and write sensor registers
The Macro command field will show the last command generated for register operations. The text
can be copied to the Macro Commands view for modification, and later the modified command can
be sent manually.
Murata Electronics Oy
www.muratamems.fi
Subject to changes
Doc.Nr. 82169500
20/33
Rev.A
Murata MEMS Demo
User Manual
5.9
Macro commands view
The Macro commands view can be used to send macro commands to the evaluation board. This
view includes panels to write the commands and to see the response from the evaluation board
(the number of responses is limited). The user can write and send macros written manually or load
the macros from a file. The user can also reload a macro that is created by the application to collect
sensor output data using the Restart collecting data button. The view also contains controls to
enable/disable the macro command parser and the macro command auto completion feature, and
there is a check box to enable saving all responses to a file. The Delete all macros button can be
used to clear all macros from the MEMS evaluation board memory.
Figure 31. View for sending macro commands
The macro command parser will check the syntax for macro commands and removes comments
before sending the command (C-style comments can be used). If the parser is disabled, everything
written to the Macro command field will be sent to the Evaluation Board. If syntax errors were found
during parsing, an error dialog will be shown with a description of the error. For example, command
*80 will generate the error shown in Figure 32.
Figure 32. Macro language compiler error dialog
Auto completion will give options to complete the commands while typing. After a command is sent
successfully, the command is stored to the GUI’s memory. The auto completion feature uses these
previously saved commands when determining the auto completion values suggested for the user.
Murata Electronics Oy
www.muratamems.fi
Subject to changes
Doc.Nr. 82169500
21/33
Rev.A
Murata MEMS Demo
User Manual
To accept the completion, the user can press the Enter key. If auto completion is not active, Enter
will only add a new line.
Figure 33. Auto completion feature for macro commands
Note that the commands are not stored to permanent storage, so they will be cleared after closing
the GUI. To store the macros for later use, write the commands to a file, then later use the Load
macros from file button to reload the macros.
Responses from the evaluation board can be stored to a file by checking the Store responses to file
check box. This shows a dialog to select the file to store the responses. Note that all data
received from the evaluation board is stored to the file UNTIL the Store responses to file
check box is deselected Refer to the “Advanced data logging” section for more information on
how to benefit from this feature.
The Restart collecting data button will send a macro to read output values from the selected
sensor. Use this button after sending commands manually to start updating the output values and
charts again. This button can also be used to display the macro used with the selected sensor, i.e.
the macro will be shown in the Macro command field. This will not do anything else than reload the
macro for sensor output data reading.
5.10 About view
The About view can be used to check the software version number, operating system information
and hardware details. Sensor information shows the selected sensor type, sensor serial number
and revision if possible.
The Uptime indicator calculates the time since the Murata MEMS demo GUI was started. The
Connection errors indicator shows the number of connection errors. If the Murata MEMS demo GUI
Murata Electronics Oy
www.muratamems.fi
Subject to changes
Doc.Nr. 82169500
22/33
Rev.A
Murata MEMS Demo
User Manual
does not receive output data within a specific time, it will try to reconnect and initialize
measurements to receive data again. This operation will increase the connection error counter.
Figure 34. View to show general information
5.11 Application menus
The File menu contains menu items to change the selected sensor type and to close the
application. If the Change sensor type menu item is selected, the view shown in Figure 4 will be
shown for the user.
Figure 35. File menu
The Help menu contains items to show online sensor information, the user manual for the GUI
software and the About view. When the Online sensor information... menu item is selected, it will
open the web browser to show Murata's website information on the selected sensor. Selecting the
Murata MEMS demo manual opens the user manual in PDF format.
Figure 36. Help menu
Murata Electronics Oy
www.muratamems.fi
Subject to changes
Doc.Nr. 82169500
23/33
Rev.A
Murata MEMS Demo
User Manual
5.12 Advanced data logging
The Save output data to file feature will only work if the GUI application has created the specific
macro that is used to read the output values. If the user wants to create custom macros to read
output and store the output values to a file, the Macro commands view can be used.
First send a command to read specific sensor registers and then select the Store responses to filecheck box, which will store everything received from the evaluation board to a file. Figure 37
shows an example for reading the TIMESTAMP and z-axis output of an SCA3100-D04 sensor.
Figure 37. Advanced data logging
Note that the Store responses to file feature does not split the files, i.e. all the data is stored
to the same file until the check box is deselected!
Murata Electronics Oy
www.muratamems.fi
Subject to changes
Doc.Nr. 82169500
24/33
Rev.A
Murata MEMS Demo
User Manual
6
6.1
Troubleshooting
GUI won’t start
If the following error message is shown while starting the GUI, either Java is not installed (refer to
the “Installing Java” section) or Java is not added to the PATH environment variable.
Figure 38. Error message when Java is not installed or not in the PATH environment variable
If Java is not in the PATH, refer to Java’s website (http://www.java.com/en/download/help/path.xml)
for instructions on how to add Java to the PATH. After setting the PATH, try to restart the GUI.
If the USB library was not found, the GUI will show the following error message and exit. Check the
log file under the logs folder and make sure the Java library path does not contain any special
characters; copy the GUI to another folder if it does. If this did not help, please contact technical
support for further instructions.
Figure 39. Error message when USB library is not found
6.2
No evaluation boards found
If the GUI cannot find evaluation boards during start-up, the following error message will be shown.
Make sure the USB cable is properly connected and that the FTDI drivers are correctly installed
(see “Installing FTDI drivers” section).
Figure 40. Error message when no evaluation boards are found
Murata Electronics Oy
www.muratamems.fi
Subject to changes
Doc.Nr. 82169500
25/33
Rev.A
Murata MEMS Demo
User Manual
6.3
Cannot open connection to evaluation board
Make sure you have selected the correct evaluation board. Figure 41 shows an example where the
selected board hardware is MEMS Evaluation board but the board ID indicates SCA3000 USB
Interface Card demo board (USB <-> Serial). If you are sure you have selected the correct
hardware, try to reset the board by pressing the reset button (see Figure 1).
Figure 41. Error message when connecting to a demo board failed
6.4
No output data
If an error message is shown, follow the given instructions. If the output data values are not
updated and an error message is not shown, please check the following:
•
•
•
•
Make sure chart updating is enabled, i.e. check Freeze chart / Update chart button
If chart updating is enabled, use the Reset system button in the Setup view to restart
collecting data
Make sure the sensor operation mode is correctly set, i.e. none of the low power modes is
set
If the connection keeps connecting / disconnecting, decrease the Sample rate value to e.g.
100 samples per second (or increase the Loop delay if the SCA3000 USB Interface Card is
used)
If none of the above helps, try to reset the board by pressing the reset button. If the values are still
not updated within a couple of seconds, restart the GUI.
6.5
Power supply voltage error
When using an extension board, the GUI checks if the power supply voltage is within the correct
range. If the voltage drops below 3.3V, the following error message is shown:
Figure 42. Error message after power supply voltage is below 3.3V
Murata Electronics Oy
www.muratamems.fi
Subject to changes
Doc.Nr. 82169500
26/33
Rev.A
Murata MEMS Demo
User Manual
6.6
Cannot send macro in Macro Commands view
If the Check macro command syntax check box is enabled and there is an error message, check
the message and the macro command to see if there is an error in the macro. If there were no
errors, disable syntax check to force sending of the macro.
6.7
Cannot check the syntax for macro command
When using the SCA3000 USB Interface card demo board, the Check macro command syntax is
always disabled.
Murata Electronics Oy
www.muratamems.fi
Subject to changes
Doc.Nr. 82169500
27/33
Rev.A
Murata MEMS Demo
User Manual
7
Uninstalling the GUI and the USB driver
The GUI can be uninstalled by deleting the Murata MEMS demo folder, i.e. uninstalling the
program is not necessary.
To uninstall the FTDI driver, open the Windows Device Manager and search for the USB Serial
Converter device under the Universal Serial Bus controllers devices list. Then right-click the device
and select Uninstall to uninstall the driver. The figure below shows where the USB device for the
FTDI chip is located in the Device Manager.
Figure 43. Windows device manager showing the USB Serial Converter device
Please note that removing the FTDI Serial Converter Driver (USB driver) may affect the
functionality of other programs (such as other demo kits provided by Murata Electronics Oy).
Murata Electronics Oy
www.muratamems.fi
Subject to changes
Doc.Nr. 82169500
28/33
Rev.A
Murata MEMS Demo
User Manual
8
8.1
Device connector
Chip carrier
Figure 44 and Table 1 below show the chip carrier connector pin order, starting from the upper left
corner when the USB connector is at the bottom. The numbering runs counter clockwise.
18
1
12
8
11
9
Figure 44. Chip carrier pin numbering
Table 1. Chip carrier connector pin descriptions
PIN
1
2
3
4
5
6
7
8
9
10
11
12
13
14
15
16
17
18
Murata Electronics Oy
www.muratamems.fi
Description
AGND
Reset / E4
INT / E5
E6
DVDD
DGND
DGND
DVIO
CBS2 / E1
E2
E3
PD / E7
SCK / SCL
MOSI / SDA
MISO / SDA
CSB
AVDD
AGND
Position
Left 8-pin row, in schematic J1-1 .. J1-8
Center 3-pin row, J3-1 .. J3-3
Right 7-pin row, J2-1 .. J2-7
Subject to changes
Doc.Nr. 82169500
29/33
Rev.A
Murata MEMS Demo
User Manual
8.2
16-pin connector for external board
On the MEMS evaluation board there is also an extra 16-pin connector for external boards. This
connector has the same pins as the chip carrier connector, and additionally it also has the power
supply inputs from the base board. This makes it possible to power the evaluation board through
the external board if necessary.
Table 2. External board connector pin descriptions
PIN
1
2
3
4
5
6
7
8
9
10
11
12
13
14
15
16
Murata Electronics Oy
www.muratamems.fi
Description
V+ external voltage in/out
DVDD, Digital power
GND, Digital GND
E6, Extra 6
INT / E5, Interrupt or extra 5
Reset / E4, reset or extra 4
E3, extra 3
E2, extra 2
CSB2 / E1, extra 1 or CSB2
SCK / SCL
MOSI / SDA
MISO / SDA
CSB
PD / extra 7, Powerdown or extra 7
AVDD, Analog power
GND
Subject to changes
Doc.Nr. 82169500
30/33
Rev.A
Murata MEMS Demo
User Manual
9
9.1
Electrical characteristics
Power supply
The evaluation board uses USB as its principal power supply and does not need any other supplies
when used with 2.5V and 3.3V sensors (chip carriers). For sensors with a 5V supply voltage, an
additional external power supply is needed. There is an External Vcc connector on the evaluation
board, or the external power can be provided through the 16-pin external board connector. The
external power supply voltage range is from 5V to 15V.
Figure 45. Evaluation board with external power cable inserted
The evaluation board’s current consumption is approximately 60 mA in active mode and less than
20 mA in sleep mode.
For use with 3.3V sensors no jumpers are needed on board. For use with 2.5V or 5V sensors it is
necessary to add jumpers to the 3-pin headers on the board; see Table 3 below for options:
Table 3. Power supply jumper options
PIN 1
PIN 2
PIN 3
Murata Electronics Oy
www.muratamems.fi
With no jumpers
Output is 3.3V
Jumper here gives 2.5V
Jumper here gives 5V
Subject to changes
Doc.Nr. 82169500
31/33
Rev.A
Murata MEMS Demo
User Manual
AVDD
jumper
DVDD
jumper
Figure 46. Jumpers set for powering DUT with 3.3V AVDD and DVDD
9.2
USB
Basic operation is enabled within the normal USB supply range. Note that with just the USB supply
the 5V supply voltage option cannot be used; instead, an external 5V power supply is needed. The
reason for this is that the USB voltage level seldom is more than 5V and usually less than 5V, for
example 4.5V.
9.3
IO lines
All IO lines are level shifted. SPI and GPIO are level shifted with an SN74LVC1T45 and the I2C
lines use MOSFET-based level shifters.
9.3.1
Analog IO
The evaluation board does not have analog IO.
Murata Electronics Oy
www.muratamems.fi
Subject to changes
Doc.Nr. 82169500
32/33
Rev.A
Murata MEMS Demo
User Manual
9.3.2
Digital IO
The digital IO uses SN74LVC1T45; Table 4 below shows a short reference of its specification.
For more details please refer to the SN74LVC1T45 product specification. For I2C the pull up
resistor is 3.3 kOhm and level shift is done to support 2.5V and 3.3V supply voltages. The full
range of I2C is from 1.8V to 3.6V.
Table 4. SN74LVC1T45 electrical characteristics
VIH
High-level input
voltage
VIL
Low-level input
voltage
VOH
VOL
Murata Electronics Oy
www.muratamems.fi
High-level output
voltage
Low-level output
voltage
DVIO
1.65 V to 1.95 V
2.3 V to 2.7 V
3 V to 3.6 V
4.5V to 5.5V
1.65 V to 1.95 V
2.3 V to 2.7 V
3 V to 3.6 V
4.5V to 5.5V
1.2 to 4.5V, IOH = -100uA
3V, IOH = -24mA
1.2 to 4.5V, IOH = -100uA
3V, IOH = -24mA
Subject to changes
Doc.Nr. 82169500
MIN
DVIO x 0.65
1.7
2
DVIO x 0.7
MAX
UNIT
V
DVIO x 0.35
0.7
0.8
DVIO x 0.3
DVIO x 0.65
2.4
V
V
0.1
0.55
V
33/33
Rev.A