1
IGHEM-2010, Oct. 21-23, 2010, AHEC, IIT Roorkee, India
4.1
Specification of NI USB 6212 [18]
Analog Input Channels
Sample Rate
Max Voltage Range
Minimum Voltage Rang
Analog Output Channels
Max O/P Voltage
Digital I/O Bidirectional Channels
Counter/Timers
Resolution
Power Requirement
16
400 kS/s
-10V, 10V
-200mV,
200mV
2
10 V
32
2
16bit
4.5-5.25V
(No external Power, in configured state via USB Port)
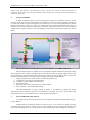
All transducers output connected to the analog input of NI 6212 card between A0-A15 (as shown
in Fig.3(b)).The output of this card transferred to the PC by USB port. This can be read further by
LabVIEW software.
5.
DATA REPRESENTATION
The data-acquisition card is controlled by a properly developed interface, using the LabVIEW
software, running on the PC. It consists of two parts first is a graphical environment with components such
as displays, buttons and charts in order to provide a convenient-to-use environment for the system operator
called front panel, and second is the program code, which is in block-diagram format and consists of builtin virtual instruments (VIs) performing functions such as analog channel sampling, mathematical
operations, file management etc.
The LabVIEW 8.6 software runs under the Windows 95/98/NT/2000 operating system or earlier
than [19, & 20]. It contains Dials, Graphs etc. to display the parameters.
LabVIEW is programmed to sense change in parameters every second and according to that
display on the screen. The screen contains block diagram for each parameter measurement, which can be
seen, after stop the program, it shows the virtual form of cable connection and the values of data at each
stage of transfer. The greater reliability of LabVIEW program is that it can be access through internet using
its web publishing tool in tool menu. This tool allows modifying the look of the document in the web
browser. Title, Header, and Footer text and the previewing the document in web browser, then click save to
disk. This is saved to the .html file to the www directory. Name and save the file then click ok. This will
bring up another window giving the URL name of the document for putting in the web browser. The sample
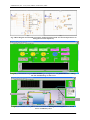
code block diagram and the final user’s monitoring screen developed in LabVIEW program is illustrated in
Fig.5 (a&b), (c) respectively. The front panel in Fig.5(d) also show the real time discharge Vs time and
Efficiency Vs Power output Characteristic.
6.
EXPERIMENTAL RESULTS & DISCUSSION
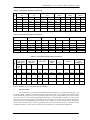
The PAT generator unit set monitored through LabVIEW software and manually. The numerical
values of various parameters are given in the table 6 (a), (b) & (c). Table 6 (a & b) shows the Electrical
parameter reading measured manually and using software on PC/laptop. Similarly, table 6(c & d) represent
the Non-electrical parameters. The front panel also show the real time discharge Vs time and Efficiency Vs
Power output Characteristic , which could easily help to evaluation of performance of PAT generator unit
set.
The results clearly shows that the IDAS are give accurate and correct results. It is also show
deviation in LabVIEW reading (PC Reading) and Meter Readings (M.R).
131