Download User Manual DOSEman
Transcript
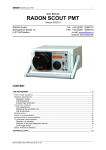
Page 1 User Manual DOSEman Version 03/2007 SARAD GmbH Wiesbadener Straße 10 01159 Dresden GERMANY Tel.: 0351 / 6580712 FAX: 0351 / 6580718 e-mail: [email protected] Internet: www.sarad.de CONTENT GENERAL INFORMATION ..............................................................................................2 IMPORTANT HINT .................................................................................................................2 THEORY OF OPERATION........................................................................................................2 STATISTICAL ERROR (FOR NON MATHEMATICIANS) ...............................................................2 Error Prediction...............................................................................................................3 Is an observed concentration change statistical signifcant or not? ...................................4 Detection Limit ................................................................................................................4 THE INSTRUMENT............................................................................................................6 OPERATION ..........................................................................................................................6 Starting a measurement....................................................................................................6 Stop sample and turn off the device ..................................................................................7 Instrument set-up .............................................................................................................8 Battery and Charger ........................................................................................................8 Communication with the PC.............................................................................................9 TECHNICAL DATA...............................................................................................................10 Manual_DOSEman_EN_05-03-07.doc Page 2 General Information Important Hint The determination of the activity concentration of Radon is always a radiometric measurement, meaning a counting experiment. This causes a number of specific circumstances which have to take in consideration by the one who is carrying out this task. Only the knowledge of those particularities allows the correct set-up of a test and avoids misinterpretations of the achieved results. Please read carefully the next chapters “Theory of Operation” and “Statistical Error” to become familiar with this kind of radiometric measurements. Theory of Operation The Radon gas diffuses through the front-side membrane into a high voltage biased measurement chamber. The Radon (Rn-222) gas concentration will be measured by the short living daughter products, generated by the Radon decay inside this chamber. Directly after the decay, the remaining Po-218 nuclei becomes charged positively for a short period, because some shell electrons are scattered away by the emitted alpha particle. Those ions are collected by the electrical field forces on the surface of a semiconductor detector. The number of collected Po-218 ions is proportional to the Radon gas concentration inside the chamber. Po-218 itself decays with a half life time of only 3.05 Minutes and about 50% (particles emitted towards the detector surface) of all decays will be registered by the detector. The equilibrium between the Radon decay rate and the Po-218 detector activity is given after about 5 half life times, say 15 Minutes. This time span defines the minimum achievable response time to a Radon concentration step. Now, the decay chain is continued by the both beta emitters Pb-214 and Bi-214 followed by another alpha emitter, the Po-214. That means, each Po-218 decay causes one more detectable decay by the Po-214 which is delayed about 3 hours because of the superposed half life times of those nuclides. The emission energies of Po-218 and Po-214 are different and therefore it is possible to separate both nuclides from each other by alpha spectroscopy. In case of the DOSEman we have the particularity that also the Radon gas itself gives an non negligible contribution to the measurement. Because of the small chamber the distance between detector and any position inside the chamber is short and the probability that an alpha particle emitted by the Radon decay will hit the detector is quite high. The Radon decays are immediately present and will not cause any response delay. Therefore it is possible to include this signal additionally for the Radon calculation. The DOSEman offers two calculation modes for the Radon concentration, one (Slow) includes both, Rn-222 and Po-218 as well as the Po-214 decays and the other one includes Rn-222 and Po-218 only (Fast). The advantage of the “Fast” mode is the quick response to concentration changes while the “Slow” mode gives a sensitivity approx. 40% higher than in the fast mode. The higher sensitivity reduces the statistical error of a measurement which depends on the number of counted decay events only. The user should select the calculation mode carefully with respect to the application specific requirements (see next chapter). Statistical Error (for non mathematicians) The radioactive decay is a statistical process. That means, even if the Radon concentration is constant over the time, the number of decays N counted within several intervals of the same period will be different. N will vary around the mean value of all considered intervals. Manual_DOSEman_EN_05-03-07.doc Page 3 Considering an infinite number of intervals would lead to an average which one indicates the “true” result of N. For a single interval, the value of N will be either below or above the “true” value. This observed deviation is covered by the term “Statistical Error”. Therefore, each serious measurement contains beside the calculated Radon value the error band for a stated confidence interval. The commonly used confidence intervals are 1, 2 or 3 Sigma () which refer to a likelihood of 68.3%, 95.45% and 99.73%. For example, the correct interpretation of a measured Radon concentration of 780 Bq/m³ with a statistical 1 error of 15% is: The real “true” Radon concentration lies with a likelihood of 68.3% within the range from 663 Bq/m³ (780 Bq/m³ - 15%) to 897 Bq/m³ (780 Bq/m³ + 15%). Error Prediction The relative statistical error E for a chosen confidence interval of k-Sigma can be predicted from the number of detected counts N by the equation: E[%] = 100% * k * (N) / N The simple consequence is: The higher the number of counts the higher is the accuracy of the measurement. From the opposite point of view one could ask: How many counts I have to detect to achieve a predefined uncertainty? Two items will affect the number of counted decays: The sensitivity of the instrument at the one hand side and the time period used for counting process (integration interval) on the other hand. While the sensitivity is an instrument specific constant, the integration interval may be expanded to the maximum acceptable value for the desired time resolution of a measurement series. The relationship between the measured Radon concentration CRn and the number of counts N within an integration interval T is: CRn = N / (T * S) whereby S represents the Sensitivity of the instrument, given in the unit [cts/(min*kBq/m³)]. The sensitivity using the slow mode is double as high as in the fast mode (see chapter “Theory of Operation”) and whenever the required response time is more than 2 hours the slow mode should be selected. For the following examples a fast mode sensitivity of 0.18 cts/(min*kBq/m³) shall assumed while the slow mode sensitivity shall be 0.32 cts/(min*kBq/m³). The first question could be: What an integration interval T have to set to get a statistical uncertainty less than 20% at a confidence level of 1 if the expected Radon concentration is 1000 Bq/m³? A 1 error of 20% requires 25 counts (100%* 1 * (25) / 25 = 20%). Using the fast mode, the integration interval can calculated by T(fast) = N / (CRn * S) = 25 cts / (1 kBq/m³ * 0.18 cts/(min*kBq/m³) = 139 min. Because the required interval is longer than 2 hours, the slow mode is the better choice, leading to the following result: T(slow) = N / (CRn * S) = 25 cts / (1 kBq/m³ * 0.32 cts/(min*kBq/m³) = 78 min. Manual_DOSEman_EN_05-03-07.doc Page 4 That looks pretty but makes no sense because of the longer response time. So we will set the interval to 120 Minutes and ask for the statistical error in this case: N(slow) = CRn * T * S = 1 kBq/m³ * 120 min * 0.32 cts/(min*Bq/m³) = 38 cts E(1) = 100 % * 1 * (N) / N = 100 % * 1 * (38) / 38 = 16,2 % Now one could say 68.3% is not sure enough, I want to choose 2 confidence interval to get a more trustable result: E(2) = 100 % * 2 * (N) / N = 100 % * 2 * (38) / 38 = 32,4 % For interpretation look at the begin of this chapter. Is an observed concentration change statistical signifcant or not? If you have a look at the acquired time distribution you will see variations of the concentration from point to point. The question is now: Is it a real change in the Radon concentration or only a statistical fluctuation? The test is very simple: Define a confidence level with respect to your needs and look at the statistical error bands of the two points of interest. If the error bands do not overlap each other, the change in the Radon concentration is significant otherwise it “can be or not can be”. Example 1: Reading 1: 1500 Bq/m³ 10% error band [1350 ... 1650 Bq/m³] Reading 2: 1300 Bq/m³ 13% error band [1131 ... 1469 Bq/m³] The upper limit of the error band of the reading 2 is higher than the lower limit of the error band of reading 1. Because the “true” value could be placed within 1350 Bq/m³ and 1469 Bq/m³, the variation of both readings is not statistical significant. Example 2: Reading 1: 1500 Bq/m³ 10% error band [1350 ... 1650 Bq/m³] Reading 2: 1000 Bq/m³ 15% error band [850 ... 1150 Bq/m³] The error bands of the readings do not overlap each other. Therefore, a statistical significant concentration change is given. Two arbitrary points of a measurement series may be considered using this test. It is not necessary that the points are direct neighbours. Detection Limit The term Detection Limit defines the smallest value of the Radon concentration which delivers a non zero reading of the instrument within a given integration interval (at least 1 decay per interval). Because of the statistical behaviour a related confidence interval has to be stated. Why is it necessary to know the Detection Limit? If the set integration interval is short and the Radon concentration low, the expected “true” value of the number of detected decays may be around or less than 1. Because of the statistical variations, intervals without any detected decay will appear frequently. The most extreme situation would be a measurement series with a lot of “zero” intervals and only one interval with one detected decay (because a decay can not be split). Manual_DOSEman_EN_05-03-07.doc Page 5 When calculating the Radon concentration by the given formula, the concentration value for the interval with the one count is much to high while all other values show zero. Then, all intervals have to be averaged to get a usable result. This procedure is nothing else than to create an integration interval long enough to meet the Detection limit for the applied Radon concentration. To avoid zero readings, set the integration interval with respect to the lowest expected concentration level during the measurement. The mean („true“) value of the number of decays during an integration interval in case of a Radon concentration in the surrounding of the detection limit is less than 16 and therefore the statistical fluctuations have to be derived from the Poisson distribution. The stated confidence interval gives the probability that the detected number of decays within the interval is not zero. Confidence Interval 63,2 % 95 % 99,75 % Required Mean Value for N at the Detection Limit 1 3 6 Example: Determination of the detection limit of the DOSEman using the „Slow-Mode“ and an integration interval of 120 Minutes. The confidence interval shall be 95% (that means in about 95 from 100 intervals a no zero reading should appear): Required mean value (number of counts from the table): N = 3. Calculating the detection limit by formula: C = N / (T * S) = 3 cts / (120 min * 0.32 cts/(min*kBq/m³)) = 0.078 kBq/m³ = 78 Bq/m³ The detection limit in this case is 78 Bq/m³. Manual_DOSEman_EN_05-03-07.doc Page 6 The instrument Operation Starting a measurement The instrument is switched on by pressing the front-side push button. On the display appears: WELCOME Please push button! If the button was locked in the set-up before, the display will show WELCOME Please check in! Changing user parameters and access to the device set-up is possible only during this state of operation (stand by). The measurement can be started by pressing the button once again. If the button is locked, the software has to be used to start the sample. The data of the last measurement series will remain in the memory as long as the first integration interval of the new sample is not yet finished. If a measurement was started unintentionally, the instrument can be stopped by the time to read the data. Please note that the sum spectrum is lost from the moment of starting. During a running sample four different display pages can be toggled by the push button. Info page 15:45 T: 60’t: 1’ SAMPLES: 34 In the upper line the actual time and a symbol to indicate the remaining battery capacity are shown. Some other symbols are displayed depending on the actual settings: o Key symbol if the button was locked o Symbolised “S” if the slow mode was chosen for the Radon calculation o Bell symbol if any alert was detected within the running measurement series The second row contains the information about the pre-set integration interval T and the time t elapsed since the begin of the recent interval in Minutes. The lower line shows the number of samples already stored in the memory. Actual Radon concentration RADON 634 Bq/m3 24 % The Radon concentration will be calculated at the end of each integration interval. In addition to the concentration value, the statistical error is given in the lower line. Before finishing the Manual_DOSEman_EN_05-03-07.doc Page 7 first interval, or if no decay was detected within the last integration interval, the values are replaced by bars. Radon average concentration Rn-Avg. 670 Bq/m3 12 % The average concentration is derived from all counts detected from the begin of the actual measurement series. The calculation depends on (like the actual value calculation) the actual setting of the Radon calculation mode (fast or slow, see chapter „Theory of Operation“). Dose DOSE 4.1 µSv 12 % The dose value shown on the display is based on the Radon exposure, meaning the product of Radon average concentration and total sample time. The Equilibrium Factor as well as the Dose Conversion Coefficient adjusted by the user (set-up) are included in the calculation procedure. The determination of average Radon concentration is depending on the chosen calculation mode (fast/slow). Stop sample and turn off the device If the button was locked, the measurement can be cancelled by the PC software only. The software also allows to switch off the instrument after the download of the acquired data. In case of unlocked button the DOSEman can be switched off also by pressing the button for approx. five Seconds. The acquired data remains in the memory and may be loaded again after switching on the unit. Please note that a repeated keystroke starts a new sample (if the button is unlocked) and the sum spectrum of the last measurement series will be lost immediately. The related time distribution will be overwritten if the first integration interval has been completed. If the battery voltage drops below the defined minimum level, the instrument switches off automatically. The data are stored non volatile, so that it is possible to read them after recharging. Alert states Alert states are indicated by a blinking light, an acoustic signal and a display output. Two alert states are implemented: Low Battery Alarm: becomes active if the battery capacity drops below 10% of the nominal value. To prevent an automatic turn off in case of complete discharging, the battery should recharged immediately. Manual_DOSEman_EN_05-03-07.doc Page 8 Low Batt. Dose Alarm: becomes active if the calculated dose value exceeds the pre-set limit. DOSE ALARM After confirming the alert message by pressing the button, the dosimeter turns back to the normal display mode. In the right upper edge of the display appears either a bell or a battery symbol dependent on the kind of alert. Instrument set-up All set-up parameters can be changed by PC software only. Beside the integration interval and the Radon calculation mode also the Equilibrium Factor, the Dose Conversion Factor and the dose limit may be adjusted. To assign the acquired data correctly to a person or location, some codes are programmable which appear later on within any data protocol or export file. Unintended manipulations can be avoided by locking the push button. The activation of the internal buzzer forces the DOSEman to give a short audible signal at each keystroke. Please refer to the software manual for more information. Battery and Charger The internal rechargeable battery allows an autonomous operation of approx. 12 days. To ensure optimal performance two things should be attended: The battery must not be stored over long times in the discharged state. Please recharge the instrument after each measurement. From time to time the battery should be discharged and recharged by the maintenance function of the charger unit (button next to the LED). To charge the battery, the charger has to be plugged to the mains power line firstly. After that the cable can be connected to the charge receptacle of the DOSEman. The red LED lamp will blink for a few Seconds (battery check) and afterwards light permanently. At the end of the recharging process, the LED lamp switches from red to green light. If the maintenance button of the charger was pressed, the battery will be discharged firstly (the LED lamp blinks during this process) and after that the charging process will be started automatically. The charger is not a power supply for permanent operation of the DOSEman. The connection between the battery and charger is released by the charge controller if the full battery capacity is reached. If the DOSEman shall operated permanently, please contact the manufacturer to talk about the modifications required for your application. Manual_DOSEman_EN_05-03-07.doc Page 9 ATTENTION! The poles of the battery are directly connected to the charge receptacle of the instrument. Do not connect any external power supply or shortcut the contacts. This will cause a heavy damage of the instrument and a strong heat emission. Communication with the PC The data communication between PC and DOSEman is realised by a special infrared adapter. The usage of a possibly available IrDA interface integrated in the PC is not possible. The infrared adapter has to be connected to the USB port. The PC software handles the adapter as a serial port (COM). To link the adapter to any COM port a driver is necessary which can be found on the program disc in the subdirectory “DRIVER”. After plugging the connector into the USB port, Windows will automatically start the hardware installation assistant. The port number is commonly assigned by Windows during the installation. The port number has to be between COM1 and COM9, otherwise the software will not be able to access the adapter. In the normal case, the first free number following the last physical available port (for example COM3 or COM5) is chosen. The Windows device manager within the Windows control panel can be used for reassignment if it is necessary. To read the data or to change the set-up, the DOSEman has to be placed on the top of the infrared adapter with the bottom panel down (IR transmitter window). This guarantees a safely connection and no other instrument in the surrounding will be affected. Manual_DOSEman_EN_05-03-07.doc Page 10 Technical data Measurement range 0 ... 4 MBq/m³ Response time 12/120 Minutes to 95% of the final value (fast/slow mode) Sensitivity 0.18/0.32 Counts/Minute @ 1000 Bq/m³ (fast/slow mode) 20% statistical error (1) @ 200 Bq/m³ within 8 hours (slow mode) 10% statistical error (1) @ 200 Bq/m³ within 24 hours (slow mode) 16% statistical error (1) @ 1000 Bq/m³ within 2 hours (slow mode) Sample interval 1 ... 255 Minutes, adjustable by software Memory 720 data records (non volatile) and sum spectrum Power supply Internal rechargeable battery for 12 days permanent operation approx. 2 hours recharge time Instrument control Single push button, Optical and audible alert, LCD, 3 lines x 12 characters Display Info, concentration, exposure and dose, available with SI- or US- units Dimensions/weight 115 x 57 x 32 mm, 250 g Interface Infrared, special IR – USB adapter is required Software Data transfer, set-up and instrument control by Radon Vision software Manual_DOSEman_EN_05-03-07.doc


