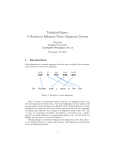
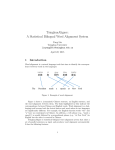
1
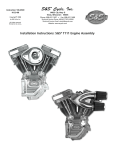
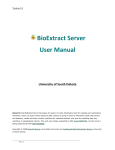
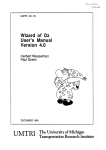
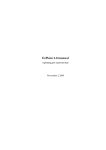
TRANSFAC Plugin
USER MANUAL
User manual for
TRANSFAC TFBS Plugin 1.1
Windows, Mac OS X and Linux
July 8, 2015
This software is for research purposes only.
CLC bio, a QIAGEN Company
Silkeborgvej 2
Prismet
DK-8000 Aarhus C
Denmark
Contents
1 Introduction to the TRANSFAC TFBS Plugin
4
2 Installation of the TRANSFAC TFBS Plugin
5
3 Searching for transcription factor binding sites
6
4 Output of TRANSFAC TFBS Plugin
9
4.1 Output table . . . . . . . . . . . . . . . . . . . . . . . . . . . . . . . . . . . . . .
9
4.2 Matrix Reports . . . . . . . . . . . . . . . . . . . . . . . . . . . . . . . . . . . . .
10
Bibliography
14
3
Chapter 1
Introduction to the TRANSFAC TFBS
Plugin
R plugin.1 The differences
This manual is for the commercial (non-free) version of the TRANSFAC
from the free version of the plugin are that it bundles all data necessary and should work out of
the box without any additional configuration.
The TRANSFAC plugin can be used to search for putative transcription factor binding sites in DNA
sequences. The binding site predictions are done by the MatchTM tool, which uses the positional
weight matrix library from TRANSFAC to analyze your sequences. For each of these matrices,
MatchTM contains optimized parameters, for minimization of error rates (false negative rate and
false positive rate). As a special feature, MatchTM provides the option to use profiles that are
specific subsets of matrices with optimized cut-offs. These profiles allow users to adapt MatchTM
to their specific interests. For example, promoters of a certain tissue can be searched with
tissue-specific profiles.
In order to be able to use this TRANSFAC plugin you need to install the TRANSFAC plugin into
your Workbench.
We cover the above topics first in this manual, and following that, provide information on carrying
out searches of TRANSFAC via the CLC Workbench.
1
R is a registered trademark of BIOBASE
TRANSFAC
4
Chapter 2
Installation of the TRANSFAC TFBS
Plugin
The TRANSFAC TFBS Plugin is installed as a plugin. Plugins are installed using the plugin
manager1 .
Help in the Menu Bar | Plugins and Resources... (
or Plugins (
)
) in the Toolbar
The plugin manager has three tabs at the top:
• Manage Plugins. This is an overview of plugins that are installed.
• Download Plugins. This is an overview of available plugins on CLC bio's server.
• Manage Resources. This is an overview of resources that are installed.
Install the plugin by clicking the Download Plugins button at the top of the dialog. This will open
a dialog where you can browse for the plugin. The plugin is called "TRANSFAC TFBS".
When you close the dialog, you will be asked whether you wish to restart the CLC Workbench.
The plugin will not be ready for use before you have restarted.
Note that you may wish to click on the button labelled "no" and restart the Workbench yourself.
If you choose "yes" at this point, the Workbench restarts using the administrator privileges you
were using so that you could install the plugin.
1
In order to install plugins, the Workbench must be run with administrator privileges.
5
Chapter 3
Searching for transcription factor binding
sites
Once the plugin is installed you can start searching for transcription factor binding sites.
Depending on the workbench product you have installed:
Toolbox | Epigenomics Analyses (
) | Transfac TFBS (
1
)
This opens the wizard, the first step shown in figure 3.1 and explained below.
Figure 3.1: Select type of analysis and input data to search for transcription factor binding sites.
The first wizard step allows you to specify the input data.
Type of analysis First you need to select between the two modes of the analysis, each explained
below.
• Classic This is the legacy mode of analysis where you have raw sequences without
genomic information and wish to search for transcription factor binding sites in these
1
In the CLC Main Workbench, the Transfac TFBS tool is found here:
Toolbox in the Menu Bar | Nucleotide Sequence Analyses ( ) | Transfac TFBS (
6
)
CHAPTER 3. SEARCHING FOR TRANSCRIPTION FACTOR BINDING SITES
7
sequences.
• Genomic Use this mode if genomic information is available in the form of genomic
regions for which you wish to search for transcription factor binding sites2 .
Genomic regions and reference selection: This section will be enabled in the Genomic mode of
analysis. Data is selected by clicking the corresponding folder icon ( ) in the right-hand
side of the wizard.
• regions: The regions of interest as a track of annotations.
• reference: The reference genome as a track of symbols.
Sequence selection: This section will be enabled in the Classic mode of analysis. Data is
selected by clicking the corresponding folder icon ( ) in the right-hand side of the wizard.
• DNA sequences: The raw DNA sequences of interest.
Clicking Next now opens the wizard step shown in figure 3.2.
Figure 3.2: Selecting profiles and settings.
This wizard window allows you to configure the profile matrix parameters
Select profile matrix to use: From the dropdown menu, you specify the profile (set of position
weight matrices) for a taxonomic group, tissue, etc. with which you want to scan your
sequences/regions for putative transcription factor binding sites.
Select cut-off: This menu lets you configure the cut-off to use for the selected set of matrices,
the options are:
• Minimize false positives (minFP). The minFP cut-off can be used to reduce the
number of false positives. The false positive rate is estimated by applying the MatchTM
algorithm to upstream sequences. The minFP cut-off is defined as the score that gives
one percent of hits in the used sequences relative to the number of hits received at
the minFN cut-off.
2
For example, if you have done peak detection from a ChIP-seq analysis, the regions where peaks are found then
are the genomic regions you wish to investigate further.
CHAPTER 3. SEARCHING FOR TRANSCRIPTION FACTOR BINDING SITES
8
• Minimize false negatives (minFN). The minFN cut-off can be used to reduce the
number of false negatives. The false negative rate is measured, as far as available, on
known genomic binding sites for the transcription factors. In case not sufficient (less
than 10) genomic binding sites are available, SELEX sites or sets of oligonucleotides
based on the nucleotide distribution in the weight matrix are used for estimating the
minFN cut-off. The minFN cut-off is defined as that score at which at least 90% of the
positive test set are recognized, i.e. it equals a false negative rate of 10%.
• Minimize the sum of both error rates (minSUM). The minSUM cut-off can be used
to minimize the sum of both error rates. The sum of corresponding percentages for
false positives and false negatives is computed for every cut-off ranging from minFN
to minFP, whereby the false positive rate at minFN (10% false negative rate) is defined
as 100%. The score at which this sum is minimal is used for the minSUM cut-off.
• Set Matrix similarity cut-off. Here it is possible to define similarity score to use in the
search (see [Kel et al., 2003] for details). The range is from 0.0 to 1.0 where a score
of 1.0 is given to the exact match and 0.0 will match anything.
• Use cutoffs from selected profile. The cutoffs that were defined in the profile will be
used.
Use only high quality matrices: When enabled this will exclude highly abundant matrices which
produce at minSUM (see below) more than 10 hits (false positives) per 1000 nucleotides3 .
3
"high quality matrices" are defined as matrices producing less than 10 hits (FP) per 1000 nucleotides (in
sequences, 10.000 to 5.000 nucleotides upstream of the transcription start sites) at minSUM. About 5% of the
current matrices producing higher FP rate, can be excluded as "highly abundant" / "low quality"; these 5% of matrices
produce about 50% of all FP hits.
Chapter 4
Output of TRANSFAC TFBS Plugin
Clicking Next allows you to specify the output options as shown in figure 4.1.
Figure 4.1: Selecting profiles and settings.
Based on the settings in figure 3.2, the Workbench uses the MatchTM program from BIOBASE to
search for transcription factor binding sites. The binding sites can be reported as annotations
that are either added to the input sequences or reported as a track of annotations (depending
on the analysis type, Classic or Genomic, see Chapter 3) and/or as an output table as shown in
figure 4.4.
4.1
Output table
The table includes the following information:
• Matrix ID. Identifier for the matrix with which the putative binding site was found.
• Factor name. Name of the binding factor, represented by the matrix. If a group of factors
is assigned to a matrix, only representative factor(s) are given. For a complete list of linked
binding factors, please see the Matrix Report in TRANSFAC.
9
CHAPTER 4. OUTPUT OF TRANSFAC TFBS PLUGIN
10
Figure 4.2: Result table.
• Region. Position of the matrix match (putative binding site) within the analyzed sequence.
• Strand. Plus/minus. The strand on which the putative site was found depends on the
orientation in which the matrix is given in TRANSFAC.
• Match sequence. Shows the matching sequence. Capital letters indicate the positions in
the sequence that match with the core sequence of the matrix, while the lower case letters
refer to positions that match to the remaining part of the matrix.
• Core similarity. The core similarity score for the matrix match. (The matrix core is defined
as the five consecutive most conserved nucleotides within the matrix.)
• Matrix similarity. The matrix similarity score for the matrix match. The Match score can
vary from 0 to 1, with 0 for the lowest similarity and 1 for the highest similarity of the match
to the matrix. Only those matches are listed in the result, for which the core and matrix
similarity are higher than the chosen cut-offs.
• Matrix Report. Matrix accession with a hyperlink to a detailed build-in matrix report that
will open in a default browser on your system. See Section 4.2 for a detailed description of
what the matrix report contains.
You can Export (
4.2
) the table in csv or Excel format.
Matrix Reports
Matrix reports can be accessed by clicking the link in an entry in the Matrix Report column of the
output table. It will load a html page in the default web browser of your system (see figure 4.3).
In the following we will describe the sections that exists in a Matrix Report.
CHAPTER 4. OUTPUT OF TRANSFAC TFBS PLUGIN
11
Figure 4.3: A Matrix Report in a browser window.
Positional Weight Matrix Describes the characteristics of the matrix.
Matrix overview
• Sequence logo: A matrix logo, which displays the consensus sequence graphically, is
shown. The reverse complement consensus sequence is displayed to the right.
Figure 4.4: Example matrix logo.
• Nucleotide position frequency: Displays the nucleotide frequency matrix. Read down to
identify the binding site and across to identify the nucleotide frequency at that particular
binding site position. The derived IUPAC consensus is provided in the last column. Click
here for more information about the Matrix block. The nucleotide frequency matrix for the
reverse complement is displayed to the right.
• Transcription factors: Lists the transcription factors from which binding sites were used for
matrix construction, hyperlinked to corresponding Locus Reports. The count of binding sites
contributed to the calculation of the positional weight matrix by each factor is displayed in
the bar graph.
• : Aligned Binding Sites: Lists the transcription factor binding sites used to generate the
matrix, with links to the corresponding Site Reports. Includes the part of the sequence
within the matrix window, the start of the matrix window (and the displayed sequence)
relative to the complete sequence as given in the Site Report. The aligned binding sites
are not given for all matrices. (This depends on the availability of the sites, e.g. not for
all SELEX matrices the sites have been published. Also, for ChIP-based matrices no site
alignments are given.).
The following information is provided for each site, when available: the transcription factor
hyperlinked to the corresponding Locus Report, the gene from which the binding site
was derived hyperlinked to the corresponding Locus Report, a graphical summary of the
CHAPTER 4. OUTPUT OF TRANSFAC TFBS PLUGIN
12
experimental evidence supporting the TF-DNA binding interaction hyperlinked to the detailed
Site Report, the experimental source, and the references supporting the TF-DNA binding
interaction.
The experimental evidence categories are organized as:
CI
DM
FA
FO
GS
IP
SE
SS
OT
-
chromatin immunoprecipitation
DNA modification (methylation, etc)
functional analysis
footprinting
simple gel shift/gel retardation
immunoprecipitation
SELEX
supershift/competitive gel shift
other
All experimental methods that do not fall into one of the other categories will be assigned
to the OT (other) category.
• Matrix type: Specifies whether a matrix is specific for a factor, or more generally
representative of a family of related factors.
• Matrix classification: For matrices built from vertebrate transcription factors, specifies
the class that the matrix has been assigned to based on a matrix clustering algorithm
submitted for publication. As of the 2012.3 release there are 44 classes: AP2-EREBP,
ARID, ATHOOK, BHLH, BHSH, BZIP, CHCH, CU-FIST, DM, E2, E2F, ETS, FORKHEAD, GCM,
GENINI, GRAINY, HISTONE, HMG, HOX, HSF, IRF, MADS, MYB, NAM, P53, REL, RFX, RUNT,
SAND, SMAD, STAT, SWI4, TBP, TBX, TCP, TEA, WRKY, ZFC2H2, ZFC4-NR, ZFC6, ZFDOF,
ZFGATA, ZFPHD, ZFRING. Matrices that do not fall into one of these classes are classified
as "unclassified".
• Matrix category: Describes which method was used to create the matrix. Possible
methods include matrix compiled from individual genomic sites, SELEX (CASTing, SAAB,
Target Detection Assay), and more.
• Application details: Provides additional information about the experimental source of the
binding sites used for matrix construction, the experimental approach applied to obtain this
set, etc.
• Number of sequences used:Provides information about the number of binding sites used
for matrix construction.
• Additional transcription factors linked to the matrix: Lists those transcription factors
which did not contribute binding sites to the construction of the matrix but which are linked
to the matrix, usually through homology.
• Profile Membership: Displays information about the profiles that the matrix is a part of
• Profiles which include this matrix: When relevant, lists whether the matrix of the page is
part of the vertebrate non-redundant (VNR) or other profile for use in Match analysis.
• Other vertebrate non-redundant (VNR) matrices that this matrix represents: When
relevant, lists the group of matrices that the matrix of the page represents in the vertebrate
non-redundant profile (VNR) for use in Match analysis.
CHAPTER 4. OUTPUT OF TRANSFAC TFBS PLUGIN
Related matrices
13
Displays related matrices
• This matrix is an older version of: When relevant, lists any newer versions of this matrix,
such as a version that was created after additional binding sites became available.
• This matrix is a newer version of: When relevant, lists any older versions of this matrix,
such as a version that was created before additional binding sites became available.
• Related family matrices: Lists related matrices that are generally applicable to a family
of transcription factors to which the factors used to construct this positional weight matrix
belong.
• Related factor-specific matrices: Lists other matrices that have been constructed using
the factors used to construct this positional weight matrix.
Identifiers Displays the identifiers associated with the matrix.
• BKL Accessions: Lists the identifier for the matrix of the page.
• Similar matrix in: Lists closely related matrices in public databases including JASPAR and
UnIPROBE.
References Lists references from which whole sets of sequences or complete matrix was
derived, including for the individual binding site sequences. Matrices constructed by us, typically
have a link to a "TRANSFAC Report", which describes the way we used for site alignment and
matrix construction.
This block gives the full citations, with titles, that correspond to the PubMed identifiers displayed.
When a PubMed identifier is not available, the Medline identifier is displayed. When neither a
PubMed nor a Medline identifier is available, a BIOBASE-specific number is assigned preceded
by a "P". Nearly all of the reference numbers are hyperlinked to the PubMed database where the
abstracts may be read. All references cited in the annotations and properties section are listed,
and other references known to contain information about the protein may also be listed. The first
five references are shown, click on the button labeled [ more ...] to view all references.
Bibliography
[Kel et al., 2003] Kel, A. E., ling, E. G., Reuter, I., Cheremushkin, E., Kel-Margoulis, O. V., and
Wingender, E. (2003). MATCHTM: a tool for searching transcription factor binding sites in DNA
sequences. Nucleic Acids Research, 31(13):3576--3579.
14