1
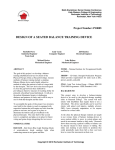
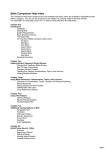
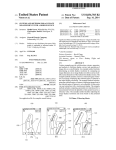
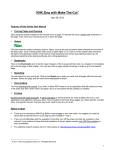
CHAPTER 9 ROCHESTER INSTITUTE OF TECHNOLOGY Kate Gleason College of Engineering 77 Lomb Memorial Drive Rochester, NY 14623 Principal Investigators: Elizabeth A. DeBartolo (Mechanical Engineering) 585-475-2152 [email protected] Daniel Phillips (Electrical Engineering) 585-475-2309 [email protected] Matthew Marshall (Industrial and Systems Engineering) 585-475-7260 [email protected] 97 98 NSF 2010 Engineering Senior Design Projects to Aid Persons with Disabilities BALANCE TRAINING TOWER Computer Engineering Designer: Andrew Caola Electrical Engineering Designer: Jeffrey Hansley Industrial Designer: Rochelle Perry (Project Manager) Mechanical Engineering Designers: Lukas Holsen and Michael Davies Client Coordinator: Dr. J.J. Mowder-Tinney Supervising Professors: Dr. Elizabeth DeBartolo Rochester Institute of Technology 76 Lomb Memorial Drive Rochester, NY 14623 INTRODUCTION The goal of this project is to develop a balancetraining rehabilitation device for clients of the Physical Therapy Clinic at Nazareth College. Current methods of balance training include a standing Balance Master device and a highly subjective method of asking the client to reach to a target held by the therapist. This new device is designed to close the gap between these methods by providing an objective measure of reaching ability for clinic clients who use wheelchairs. It will give the clients illuminated targets at challenging distances and patterns of reach, and it will be easy to use for both the therapist and the client. The form of the device is a tower equipped with seven capacitance buttons. Each button has a bank of multicolor LEDs above and below to indicate to the user which button to try to reach, when a successful hit has been made, and also when the user has either hit the wrong button or has run out of time. The tower is preprogrammed with two games, which prompt the user to respond to different patterns of highlighted buttons. SUMMARY OF IMPACT The final device was used at the clinic for two months before the clinic closed for its summer session. During this time, many clients used the tower and the clinic coordinator reported that users were excited to compete against one another and therapists were continuing to include the use of the balance tower in their patient plans. In addition, the new device only requires one therapist to work with the client, rather than two: one to hold a target and one to support the client. This has improved the morale of some clients who, unbeknownst to the team, had actually felt bad for having to use more of the clinic’s resources. It also increased the Fig. 9.1. Final constructed tower. effectiveness of the staff as the same amount of therapy can be carried out with one less person. TECHNICAL DESCRIPTION In order to assess the need for balance training at the clinic, an assessment was made of the current methods of balance training by the physical therapists (PT) and patients with various disabilities. Chapter 9: Rochester Institute of Technology 99 To fill the gaps at the Physical therapy clinic, there is a need for a device for seated balance training, that is simple to use and visually stimulating to the patient. The unit is designed such that once it is set up the therapist can focus on the patient rather than the object they need to reach. Being able to quantify the patient’s ability to balance will help track the patient’s progress throughout their therapy sessions. The clinic requires a device that supports rehabilitation, is safe, adjustable, easy to use, and can be easily stored and transported. Capacitance buttons are chosen as the patient user interface because they do not require the user to actually 'push' a button with a significant amount of force and instead are activated by proximity. This way, the exercise can focus directly on balance and range of motion rather than ability to generate enough force to activate a button. The buttons are created by using a B6TS-04LT, a 16-bit microcontroller designed to detect patient touch by detecting the change in capacitance. Touching one of the output channels changes the capacitance between the output and ground with the body’s capacitance. The touch sensor detects the change and the output of that channel and changes voltages, which is detected by the microcontroller. Each capacitance touch sensor, Sensing IC, controls four aluminum “buttons” on the tower. The users are provided with both visual and audio feedback. RGB LEDs are used as both target and status/state indicators. A series of RGB LEDs above and below each button denotes the current target, a successful touch of the target, or an incorrect target touch. RGB LED’s are used as opposed to traditional single color LED’s to limit the number of wires in the tower. As displayed in Figure 9.2, blue illuminates indicating the target, green indicates that the correct target has been touched, and red indicates either that the incorrect target has been activated or that time has expired. A PC Beep speaker is included to provide auditory feedback; the tower will beep once each time the target is successfully hit. For easy maintenance for the clinic, the device is designed to run on a pack of four interchangeable lithium strength batteries for power. By utilizing a battery-powered solution rather than AC wall power, the portability of the device is maximized. Four AA batteries are used to provide a 6V rail Blue Green Red Fig. 9.2. LED lighting scheme. Fig. 9.3. Tower base and cart. which is then stepped down to 3.3V using a voltage regulator. The 3.3V powers the LED’s, Capacitance Buttons, and microcontroller. The batteries can be accessed through a removable door located near the base of the tower. An LCD display screen in the main tower displays the current status, control actions, setup communication, and game choices. Additionally, it displays relevant information following the exercise for the PT to record on a standard worksheet. The chosen screen is a Serial Enabled 20x4 LCD with Black on Green display. It is chosen based on the low (5V) power supply it requires and the fact that it can be coded in C. The screen also includes firmware that allows adjustment of the backlight brightness. For the needs of the design, the MSP430-F16(11) microcontroller is used due to the extremely low power design, and the large number of digital inputs and outputs and ~50kB flash memory. This board also offers ZigBee wireless connectivity, for future implementation of communication between multiple towers. Furthermore, the ability to program 100 NSF 2010 Engineering Senior Design Projects to Aid Persons with Disabilities in C, as well as the numerous online examples significantly shortens the learning curve. The MSP430 is mounted on an easily accessible platform in the middle of the tower. It is placed in the middle of the tower to minimize the amount of wire required to connect it to all seven capacitance buttons and all eight LED sets. The maximum length of wire required for any connection is now half the height of the tower. Wiring harnesses are designed and included to organize the inside of the tower, using zip ties and electrical wire. To reduce interference of the wire conducting the capacitance chip to the aluminum plates, the wires were wired in separate harnesses. The two soldering breadboards are arranged on opposite sides to keep wires clean and organized. The MSP430 is designed so that the wires are out of the way of the hinged door, for easy access to the JTAG port and the battery pack. To simplify the wiring within the tower a color coded system is included. Dark red is used for components requiring 3.3V, light red is used for 5V components, and the color of the wires going from the LEDs corresponds with the color the LED emits. Software development is a very important aspect of the project. Programming was initially composed in C, and transferred to the flash of the MSP430 board via serial/JTAG during testing. Utilizing ISR techniques to queue button inputs and target statuses, the board supports an extremely small time delay when sending and receiving signals from the tower. The program development process is broken down into three phases. Phase I includes the development of a “skeleton” class design, port identification, address detection, and Input/Output testing. The use of various portions of code during debugging, development, and testing indicated that it was best to use multiple classes. Because of the freedom within the IAR Embedded Workbench, setting up variables at runtime is straightforward. Port identification for the MSP430F1611 is provided in the datasheet, specific to the DZ1611 model. By identifying the addressing properties of the MSP430, setting up ISR interrupts and accurately locating debug errors is made much easier. Input and Output testing took up the majority of debugging time, mainly due to a non-shielded wire issue. After using technologies provided to us by members of various other MSD teams to verify the issue, wire was rerun using a shielded option and I/O test harness. Upon successful completion, I/O testing is marked as "continued development" in order for us to continually debug at each port or breadboard modification. The next phase consists of the selection of a compiler and in-code documentation. The IAR Embedded Workbench provided by TI proves very useful. The comprehensive documentation provided by TI is used throughout the project; in-code documentation was completed to allow even for a first-time user of the MSP430 to quickly understand port I/O and ISR scheduling. The final phase is game development. For the initial revision, two games are included: Random Touch and Timed Touch. For both games, the physical therapist is prompted to select the target buttons that should be enabled for game use. Random Touch randomly lights one of the enabled targets, lights that target in blue, and gives the patient a preassigned amount of time to reach and press the target. If successful, a chime plays, and the LED rows will illuminate green, otherwise the red LEDs light. The second game, Timed Touch, shows each enabled target, in order, from top to bottom, and records the amount of time taken to reach each target. Safety features are added to the tower, including an impact protective foam halo around the top of the device, removable rubber edges on the corners, and a rubber base, along with a cart to minimize the physical therapist lifting requirements. The tower displays good stability and will not become unstable and tip unless it is pushed past 24.5°, which corresponds to a 2 foot displacement at the top of the tower or a 1 foot displacement at the center. The client has been provided a simple user’s manual that was summarized in two pages so it can be attached to the device. An operator output sheet is also included so that at each physical therapy session that the product is used, the PT can record important information. The sheet will also act as a simple instruction manual as well, since the order of the questions resembles the game design. The total cost of the project is $2006.00. More information is available at http://edge.rit.edu/content/P10005/public/Home Chapter 9: Rochester Institute of Technology 101 Table 9.1. Benchmark training devices. Device PT holds object SMART Balance Master Nintendo Wii Fit Advantages Simple to use No set-up No storage space Objective measure of patient progress Stimulating Game Too much for patients with low cognitive ability Disadvantages No objective measure of patient progress Boring Requires two PTs to be present Standing only Difficult to use Frustrates patient Nintendo does not support “Physical Therapy” Difficult to determine what actual training is happening Table 9.2. Engineering metrics and final results. Engineering Metrics Max tilt angle before falls Height of device Response time (to/from lights) Set up time Button Sensitivity Average # of levels complete Minimize spatial confines Optical visibility (contrast) Volume Time to Sanitize Time to disassemble Parts that can be replaced Fig. 9.4. Balance training tower in use. Marginal Value 10° 40” 3500ms 2 min 0.2 lb 3 3ft3 70 60 dB 2 min 3 min 75% Ideal Value 20° 60” 1000ms 1 min 0.1625 lb 5 2 ft3 90 80 dB 1 min 1 min 100% Achieved 19° 61.5” 425ms 2 min Negligible 8/15 2’x1’ 98% 80 dB 1 min 2 min 0% 102 NSF 2010 Engineering Senior Design Projects to Aid Persons with Disabilities BALANCE TRAINING BICYCLE lectrical Engineering Designer: Daniel Bradshaw Industrial Engineering Designer: Lindsay Power Mechanical Engineering Designers: Christopher Crowley (Lead Engineer), Kristin Gagliardi (Project Manager) and Timothy Williams Client Coordinator: J.J. Mowder-Tinney Supervising Professor: Dr. Elizabeth DeBartolo Rochester Institute of Technology 76 Lomb Memorial Drive Rochester, NY 14623 INTRODUCTION This device is a redesign of a prior senior design project. The Physical Therapy clinic at Nazareth College engages a variety of clients in need of balance training, and looking for a challenge. The balance training bicycle introduces some controlled instability similar to that experienced on a freestanding bicycle without the risks associated with actual bike riding. Clinic clients in need of balance training are those who have had strokes, or those who have other neurological conditions that cause an imbalance in strength between the left and right sides of their bodies. SUMMARY OF IMPACT The redesigned system meets or exceeds the customer’s most critical needs. The primary improvements from the past designs are that the new device has more comfortable handlebars, has a more clearly visible, intuitive display, improves stability in the upright-and-locked position, and provides a simpler, more reliable method of providing support and/or resistance to the users as they tilt. Although the bicycle is delivered after the clinic closed for the summer session, the physical therapists who will be using the system next year have ridden the bicycle and are excited to begin using it with their clients in the fall. TECHNICAL DESCRIPTION The design was broken into three subsystems including the frame, tilt mechanism, and electronics (measurement and display). The frame is designed to incorporate commercial off-the-shelf products where possible. It includes a standard set of bicycle handlebars, a standard bicycle seat and seat post, and a pedal-flywheel-brake system from a spinning bike. The tilt axis is inclined 15° from horizontal to provide a more natural tilt feel to the rider. Stress analysis results showed a minimum factor of safety of 1.11 for a 300lb passenger, with the critical location being at the adjustment holes in the seat post. A solid plug is included to increase the factor of safety. The tilt mechanism is based on a set of removable exercise bands to provide tilt resistance. Tensile testing of the bands (according to ASTM D348-07) and basic statics yielded tilt resistance data. The team tested several attachment methods for the bands, and the one that was most secure and easiest to remove involved tying each band onto a carabiner; this enables the therapist to easily snap extra bands on and off. A hard stop is also incorporated, to provide a limit beyond which the rider cannot tilt. This was done using a length of rope clamped onto a locking carabiner. Three different tilt ranges, and three different accompanying rope lengths are provided to the clinic. The electrical system is designed around an inclinometer that provides information about how far the rider has tilted from an upright position. The clinic clients would like to receive both visual and audio feedback, so the inclinometer data is used to generate an LED indicator of tilt and to create a beeping sound that changes in both pitch and frequency as the rider tilts farther off-balance. The total cost of the project is approximately $1555.70 More information is available at http://edge.rit.edu/content/P10001/public/Home Chapter 9: Rochester Institute of Technology 103 C1 0.22 µ R2 1 U2 1.1k 5 Vdc V2 OS2 5 6 OUT 2 4 V- R1 1.1k R3 V+ 7 2.2k V1 12 Vdc 1 R16 1k OS1 LM741 R4 2.2k R5 10k R17 1k Multimeter V4 4 1 AD8554/AD U11 3 2 1 V+14 2 4 AD8554/AD U5 R14 5k R11 0.17k 2 INV Red Zone R6 1k Speakers 3 1 U10 2 1 INV 2 U16 U16 3 1 2 INV R7 1k Yellow Zone OUT 6 V- 1 1 4 AD8554/AD R18 1k U4 2 OUT 6 V- 1 V+ 14 2 U13 3 U12 XOR 3 GND R9 1k V+ 14 OUT 1 3 GND 2 R15 1k 1 U15 2 XOR U3 6 V3 GND OUT 3 GND 1 R8 0.37k U6 6 V- 2 V+ 14 5 Vdc R13 1k 4 AD8554/AD R12 0.85k 0 Fig. 9.5. (a) Electrical schematic and (b) final display. Fig. 9.6 Balance training bicycle. 104 NSF 2010 Engineering Senior Design Projects to Aid Persons with Disabilities DYNAMIC KEYBOARD Mechanical Engineering Designers: Robert Piccirillo, Joshua Locke, Alex Moulton, Marie Hammer Electrical Engineering Designers: Obadiah Pulscher, Adam Stull (Team Leader), Andrew Robertson, Xingwang Gao Client Coordinator: Prof. Dino Laury, National Technical Institute for the Deaf Supervising Professor: Prof. George Slack Rochester Institute of Technology 76 Lomb Memorial Drive Rochester, NY 14623 INTRODUCTION Text entry applications such as word processing, email notes, and instant messaging all share a common keyboard scheme. For people who are hearing impaired, these application tools have been effective in communicating with others who cannot sign. During the act of speaking and signing, the integration of thought and emotion occurs simultaneously and seamlessly with little overt thought. In contrast, text entry differentiates or separates thought and associated emotion. The keyboard only captures keystrokes and thus loses emotional expression, even though the act of typing may carry some covert emotions. The goal of this project is to take these learned skills of speaking and signing and use them to enable us to enrich the value of text entry. Though this project may help everyone, it may have a greater impact on individuals who are deaf. Two teams worked in series on this project. SUMMARY OF IMPACT The project to date has resulted in the development of a force-sensitive keyboard that has been tested with some users. The original intent of the project was to develop a keyboard that could detect enough differences in the user’s typing patterns to automatically add an emotional indicator to the text, but testing with users showed that this could not be done reliably. The resulting design is a keyboard that can measure different typing forces and that is comfortable for most users (nine out of 10 individuals trying the keyboard liked the way the keyboard felt and the way it responded to their key strikes). The device functions based on learned typing skills, rather than learning how to interpret each user’s intent, but it will still satisfy the original intent of the project. The next step will be to begin software development that will allow users to set defaults such as “hard ‘A’ strike for angry” or “light ‘W’ strike for whisper”. Fig. 9.7. Modified spring configuration for keyboard keys. TECHNICAL DESCRIPTION The team chose to use a standard Sun Microsystems Type 7 keyboard as the platform for the device. Underneath the force-sensitive keys the team opted for a force sensitive resistor (FSR). The FSR is comprised of two plastic ribbons, with a layer of resistive ink in between. As pressure is applied to the sensor, its resistive value changes. It is highly durable when used properly, has a very low profile, and has a 0.2” diameter active region. On top of the FSR, the team removed the standard silicone bubble spring that is common on many keyboards and replaced it with a foam cushion. The silicone bubble spring is non-linear, and requires a fairly significant force to initiate motion; this would eliminate the possibility of using a low-force keystroke to convey some sort of emotion. The foam cushion (Figure 9.7) was rated positively by nine out of 10 users in testing, and could easily be integrated with the keyboard and sensor system. There are over 70 commonly used character and functions keys on the average keyboard. To allow for analysis of force applied to each key individually, a system had to be devised to simplify the number of information paths required to accomplish this. A total of 75 sensors are required to cover all of the associated typing keys, and every key must be monitored by a standard Chapter 9: Rochester Institute of Technology 105 microcontroller. A “sensor matrix” was derived to allow for a minimal number of required inputs and outputs on a microcontroller. 15 input signals and 5 output signals will be utilized to create a “rowcolumn” array containing all applicable keys. An MM74HC4514N 4-16 IC decoder will be used to further minimize the number of inputs required by providing all 15 input signals (one discarded) in cycle from 4 microcontroller outputs. Using this configuration, 4 outputs, and 5 inputs will be required to monitor all 75 sensors. The 5 output signals will be provided by 5 LMC660CN op-amp based amplification circuits, each fed by 15 sensors. frequency of ~100k Hz and USB capability. The team did their own PCB layout for the controller interface board, which houses the amplification circuits, and also created PCBs for the main keyboard sensors (Figure 9.9 and for the number pad sensors. The final assembly is shown in Figure 9.8. The team chose an Arduino MEGA as the controller device. The MEGA contains 18 analog inputs, and 32 digital outputs, with a digital output toggle More information is available at https://edge.rit.edu/content/P10002/public/Home and https://edge.rit.edu/content/P10003/public/Home This project was partly supported by the Ronald D. Dodge Faculty Development Grant. Total cost was approximately $1400, with $500 support from the National Science Foundation through the RAPD program. Fig. 9.8. Keyboard assembly: 1) Key Matrix, 2) foam compressive layer, 3) keyboard contact sheets, 4) force sensitive resistor PCB, and 5) ABS back plate. Fig. 9.9. Force sensitive resistor PCB. 106 NSF 2010 Engineering Senior Design Projects to Aid Persons with Disabilities LEAK TEST STATION PROCESS IMPROVEMENT Industrial Engineering Designer: Andrew Lawlor Mechanical Engineering Designers: Adam Janicki, Christopher Somers, and John Zeffer Client Coordinator: Dennis Hezner Supervising Professor: Dr. Matthew Marshall Rochester Institute of Technology 76 Lomb Memorial Drive Rochester, NY 14623 INTRODUCTION The goal of this project was to design and build a pressure test device for use by employees at ARCWorks, a light manufacturing facility employing individuals with developmental disabilities. The existing test fixture relied on water to pressure-test, so it was messy, subjective, and it slowed down the assembly line. The current process involves an employee taking a cap, screwing it onto a bottle, plunging the bottle under water, and looking for air bubbles that may be escaping, which would indicate a leak. Employees are generally paid on a per-piece basis, so it is important to make the process as clear, safe, and efficient as possible. SUMMARY OF IMPACT The team took a two-pronged approach to the problem. First, they designed a new test fixture for employees on this line to use. The fixture is still under development, and is expected to be completed over the summer. It will allow a worker to run two tests simultaneously, and provides a very simple, objective indication system: A green LED indicates a good part, a red LED indicates a bad part, and a yellow LED indicates that a test is in progress. The second aspect of the project was to improve the manufacturing process. The team implemented a 5S (Sort, Set, Shine, Standardize, and Sustain) system in two phases, which gave the operators a sense of ownership and pride in their accomplishments. TECHNICAL DESCRIPTION The design team chose a vacuum pressure approach, because it would be the simplest for the operators to use. The pressure test fixture the team designed and built is shown in Figure 9.11. The cap sits upon a soft rubber to create a seal. The two red buttons seen at the front left and right of the base plate are for the operator to initiate the test. The use of two buttons ensures that the worker will not run the risk of Fig. 9.10. Pressure test fixture. injuring their hands or interfering with the test. Shown behind the cap, at the top of the back plate, are the red and green light indicators. These indicators show the results of the test: red for a bad part and green for a good part. The yellow light is illuminated when the test is in progress. Below and behind the fixture (not shown) is a differential pressure sensor to measure the speed of pressure drop and a vacuum pump to pressurize the fixture. Operation of the machine is simple and intuitive for the operator to use. The operator will take a cap from their “incoming” lane. The operator will then place the cap onto the test fixture. Next the operator will press the two-hand start button. This will allow the machine to run unassisted by the operator. The vacuum will then run and determine if there is a good seal on the cap. If the seal is bad, a red light will indicate to the operator that the part is bad, and if the part is good a green light will appear. The vacuum will then release its pressure, allowing the operator to remove the cap and place in its respective bin. This process can be run Chapter 9: Rochester Institute of Technology 107 simultaneously on both of the stations on the machine. Examples of good and bad part pressure curves are shown in Fig. 9.12. To allow the system to function autonomously from a PC interface, the team used a Programmable Logic Controller (PLC) to control the system. The PLC will turn on the vacuum pump, read the pressure sensor, and control the indicator lights according to the pressure readings (pass, fail, or in-progress). The PLC also reads in a user-set switch position that indicates the particular configuration of cap being tested. The final system testing indicated that the vacuum test fixture resulted in more rejected parts than the water test system, partly because workers did not formerly hold the caps under water for a specific amount of time, and some leaks only become apparent over time. However, the new system did allow two parts to pass that actually failed the water test. Final work on this device is being done during the Summer of 2010. Fig. 9.11. Actual pressure test system built. The total cost of the project was $2106. More information is available at https://edge.rit.edu/content/P10008/public/Hom Vacuum Decay 3.5 3 Voltage Output (V) 2.5 2 Good Part Bad Part 1.5 1 0.5 0 0 5 10 15 20 25 Time (sec) Fig. 9.12. Examples of good and bad vacuum test data. 30 35 40 45 50 108 NSF 2010 Engineering Senior Design Projects to Aid Persons with Disabilities