1
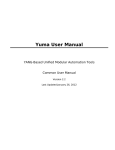
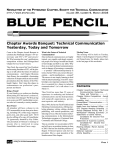
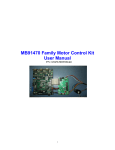
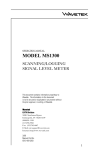
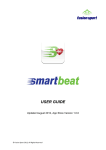
version 2.10, Sept. 2015
Content
Preface
>
1
Introducing the CardioGem 5QS
>
2
Getting started
2.1
Preliminary notes and hardware setup
2.2
CardioGem main screen overview
2.3
Opening and playing sample files
3
Setting up a CardioGem session
3.1
Verifying the hard- and software
3.2
Applying the EEG sensor head set
3.3
Noise issues
3.4
Starting a HRV / ICC session with the CardioGem 5QS
3.5
Replay and store last session
4
Description of the CardioGem software
4.1
General
4.2
Modules and process flow
4.3
Biofeedback
4.4
Autonomic Cycle
4.5
Export Scan
5
Other main menu items
5.1
Settings - General
5.2
The View menu
5.3
The Tools menu
5.4
Help
5.5
About
>
>
>
>
>
Attachments
>
>
>
>
>
>
>
>
>
>
>
>
>
>
Preface
Dear customer
Thank you for choosing the CardioGem 5QS, a valuable tool for state of the art ECG and HRV diagnostics and
training.
We trust this manual will prove useful in becoming acquinted with the technical and practical use of the hard- and
software. It is not meant as a guide for therapeutic or training purposes.
For a quick first impression of the CardioGem 5QS full version or demo, it is sufficient to go through the preliminary
section (2). We advise you to carefully check out the preliminary notes, as it provides useful tips for trouble-free use
of the software, sensors and hardware.
Please feel free to contact us if you have any questions, suggestions or comments regarding this manual.
You may contact us via email: [email protected]
1. Introducing the CardioGem 5QS
The CardioGem 5QS performs a revolutionary form of ECG analysis referred to as Internal Cardiac Coherence
(ICC). It is based on detecting and rewarding the coherent distribution of frequencies in the ECG spectrum up to a
(theoretical) range of 64 Hz in healthy HRV (Heart Rate Variability) subjects. ICC analysis combines in a unique way
the benefits of healthy HRV, indicative of vitality and outward engagement, with those of the regular heart beat seen
during inner concentration and focussed intent. In optimized form this is referred to as harmonic exclusiveness, the
electro-biological formulation of empathy, self-empowerment and flow experience.
The CardioGem 5QS can be used diagnostically as well as for training purposes in various ways and for research.
Characteristics of diagnosis / training with the CardioGem 5 include:
Detection and integral reward of psychologically powerful combination of HRV and ICC
Based on state of the art insights in why biophysics favors certain frequency patterns
Can output a simple "0 - 100%" integral result (Dynamic Index)
Practical benefits are for example:
Integral monitoring of heart spectral patterns associated with engagement, empathy, individual focus and
cognition, flow experience and even extasy
Very easy hook-up and effective (less than 5 minutes) session time
Easy to interpret results, no specialist skills needed for basic operation
The following sections include the introduction and detailed use of the software, some important notes on the
hardware and how to set up an ECG session.
This is a technical guide. For guidelines and backgrounds on using the CardioGem in therapeutic practice, training
or biofeedback please refer to the CardioGem Therapists Guide.
2. Getting started
2.1 Preliminary notes and hardware setup
Before you start using the CardioGem, please read below notes carefully. It may prevent unnecessary
issues during setup, registration or use of the hardware.
Demo Version
If you use this manual with the demo version please check out paragraph 2.3 on playing sample files.
System requirements
The CardioGem is designed for Microsoft Windows Vista, but works as well with Windows XP and Apple. It does
not put an extraordinary demand either on your processor, internal memory, harddisk size or video card and it will
run on virtually all machines of recent years. Processor speed:1.0 GHz is recommended; monitor 1024 x 768 is
recommended, higher speed and resolution are advised however. In case of doubt, try the (free) demo; if your
computer replays sample data properly it will also work with real data. For biofeedback, your computer should have
a standard onboard or dedicated MIDI player. See the section on biofeedback for the proper device settings under
Windows.
Using the CardioGem on your Mac
It is possible to run most Windows applications on Apple, using a Windows emulator (software). The CardioGem
performs well under the “Parallels” or "Fusion" emulator. You will need a modern Mac however. Please inquire with
your Apple dealer, while mentioning the conventional system requirements as above. Also, you can try the free
demo version before deciding to buy the CardioGem for your Mac. If the demo works smoothly, you may assume
that the full version also works.
How to make .pdf files
The CardioGem has various direct printout sources (Quick Scan, Spectrogram) which can either be printed
normally, or can be turned into a .pdf file (Adobe reader document format). The .pdf creator is installed directly under
Windows, in the form of a so-called virtual printer. This means, that you select a "pdf printer" from your printer menu.
A PDF printer may be installed already by your computer manufacturer. In the other case, you could use for example
PDF995 (free). Below example shows a printer menu with normal printer, original Adobe PDF and PDF995.
Setting up and using the ECG / EEG sampling amplifier
The ECG sampling amplifier uses 4 A4 batteries in a bay at the back side. Verify that the batteries are fresh and in
the proper positions, and do not leave batteries inside when unused for a longer period.
The ECG device has a standard USB interface which requires no external drivers. After plugging in first time,
Windows will recognize the new device and automatically installs the proper drivers from its own resource (HID
compliant device + USB-HID). Note that this is different from the software drivers (see next topic). After plugging in
the device, the green LED indicator is NOT supposed to light up. When the CardioGem starts taking data
prompted by the software, the green LED will be activated. After ending sampling or program shutdown, the LED
will flash for a few seconds and then switch off. In case of irregular program- or computer shutdown, the ECG
device will not properly be switched of, and the LED stays on. This indicates that you need to manually reset the
hardware by re-plugging the usb connector..
Registration
The CardioGem Demo version is freely available, however you are required to register in order to acquire a free
demo license. This will help us to keep track of the use of the CardioGem demo, and facilitate easier service. If you
have just installed a demo version, the program will give you a unique serial number attached to your PC. To obtain
your activation key, the only thing you need to do is send your serial number to your vendor or to Heart Coherence
team directly. You can email to [email protected] or call us. The demo version replays life sample files, but
cannot be used with the ECG device.
The CardioGem full version comes with the ECG amplifier, or may have been purchased as software only. The full
version is protected with a “dongle”. A dongle is a memory-stick like device (usb-stick) which contains information
like your user key, encrypted data, encryption keys and proprietary algorithms. The licensed software checks for the
presence of the dongle at program startup, during sampling and at other times. The dongle protection facilitates free
portability of your CardioGem license to any computer you like, however you need to keep the dongle in your
computer while the software is running.
Important note: the dongle is a usb device which should normally not interfere with other usb devices. If nevertheless
the software generates a dongle error, just replugging may be sufficient. If a dongle error keeps recurring, try
another usb port, or try to temporarily unplug other usb devices.
Updates
Please check back on our website for updates at www.trigunamedia.com or at the users download and resource
page.
Help-desk
We are gladly available for phone service for all issues related to the setup and operation of the CardioGem. In
order to help you, we assume that you have basic experience with Microsoft Windows, or have somebody with you
who has. For questions on the setup and use of the hard- and software, call Heart Coherence team (++31-534361096, Netherlands, UTC+1 or send an email to [email protected]) or contact your local dealer.
2.2 CardioGem main screen overview
(scaled sample)
Explanation of the CardioGem modules:
1. Input Module
Shows the raw ECG data coming directly from the amplifyer. Here, a single person session is shown. If two
persons are connected simultaneously, the module is split in two and each channel (one person's ECG data)
is directed to one part. The interval shown is a fixed 4 seconds, running from right to left, with a fixed scale of
plus - minus 500 milli Volts.
2. ECG Spectrum Module
This is the traditional spectrum, in this example and by default shown vertically. The maximum spectrum range
is 64 Hz, but usually a 20 to 25 Hz range adjust is efficient.
3. Internal Cardiac Coherence (ICC) Module
This module shows the Internal Cardiac Coherence (ICC) index and peak value.
4. History Module
History plots of ICC peak value and heart rate in beats per minute (BPM), also referred to as tachogram.
5. Heart Rate Variability (HRV) Module
This is the spectrum of the tachogram, showing the HRV in a standard frequency domain of 0 to 0.5 Hz. The
traditional LF, MF and HF intervals are indicated by their resp. colors.
6. Quick Scan page with printout option
After finishing a session (minimum time apprx. 4.5 min.) a Quick Scan can be made, giving a comprehensive
overview, statistical summary and Dynamic Index (final 0 - 100% score) on a single, directly printable page.
2.3 Opening and playing sample files
The CardioGem software comes with a few pre-recorded ECG sample files. These can be accessed through Main
menu -- File -- Open session and are found in “Sessions” in your application folder. The following sample recordings
are included:
Eugene.hti
HRV_ICC_monotonic.hti
HRV_ICC_normal.hti
Maggie.hti
Martin_1.hti
Martin_2.hti
Suzanna.hti
3. Setting up a CardioGem session
3.1 Verifying the hard- and software
Before applying the sensors, you may prefer to do a hardware check first. As long as the sensors are unattached, it
is better not to have them plugged in either, as the wires may pick up undesirable noise. If the batteries and usb
connection are ok, you can start taking samples by clicking the “play” button at the top left on your screen (not the
one in the input module, which is the replay button). The input module will typically show a slightly noisy data stream,
updated every second. The subsequent modules will of course give no meaningful output, however you could check
for a small 50Hz peak (60Hz in the US) in the spectrum module. If you see any of this this, you can proceed to apply
the wrist sensors and connect the wires to the device.
3.2 Applying the ECG wrist sensors
The CardioGem is easily hooked-up with two wrist sensors only. The sensor heads have two resp. one contacts,
whereas the two contact part is usually put on the left wrist. The sensors are saline (gel-free) types, using natural skin
moist for conductivity. It can sometimes take a few moments until the (dryer type) skin creates sufficient moist so
that the signal can be picked up well.
3.3 Noise issues and muscle artifacts
The sensitive ECG can pick up some noise, despite maximum protective measures. This may not necessarily
disrupt your session but can be annoying. Some patience may be needed to create a comfortable work place. Main
noise sources are of course all electric mains cables in the vicinity, but also transformers (like your laptop adaptor)
and sometimes the computer itself. In many cases, simply re-arranging some cables or appliances helps greatly. It
is always recommended to run the computer on battery and completely disconnect from the wall. In worse cases,
the room is simply too electrically polluted to work well. In rare cases, in order to get successful ECG readings, you
may need to move to another place, which you might anyway for your own health.
The second cause for disturbance of the sampling process is muscle movements. Muscles create electrical signals,
like the heart itself and these can seriously affect your ECG recording to the point of being unusable. Let the subject
relax, best in an comfortable chair with back and preferrably also head support. The neck and shoulders should
remain relaxed, and arm, wrist and hand movements should be avoided. Avoid the hands touching eachother, this
may reduce the signal strength.
3.4 Starting a HRV / ICC session with the CardioGem
If the previous steps were carried out successfully, you may start taking ECG data using the CardioGem software.
On the screen, by default all modules are active and well arranged on the screen, resp.: Input Module, Spectrum
Module, ICC Module, History Module and Quick Scan. If something is missing or the screen looks messed-up, go to
the Settings tab at the top, move to “general settings” and click “default config”. This will re-arrange the screen
configuration for a default 1024 x 768 monitor.
In order to prepare for meaningful data, let your test person relax in a chair, ask him or her to avoid neck, shoulder
and arm tension and movements and try to lightly concentrate for example on a joyful memory. Otherwise no effort is
required.
You can start, pause and stop your session with the recorder buttons at the top left:
In normal cases and with a little relaxation, typically either of the following results may be expected:
CardioGem
Typical subject
High HRV,
low ICC
Young people (adolescents); healthy, emotionally
(Internal
and physically engaged persons, however with less
Cardiac
individual focus and emotional coherence
Coherence)
Dynamic
Index
(final
reward)
Low; ICC
histogram
left from
centre
High HRV,
high ICC
Healthy, emotionally and physically engaged
persons, also with good individual focus and
emotional coherence; likely empathic; good "flow
experience" socially and professionally
Good to
optimal;
histogram
well
centered
Low HRV,
high ICC
Elderly, and / or emotionally less engaged or
blocked, rigid mentality or physically inactive; "false"
ICC more resulting from low HRV than from positive
coherence; but also experienced meditators can
have this profile
Average;
histogram
tends to
right of
centre
Low HRV,
low ICC
Not very likely
Very low;
histogram
undefined
3.5. Replay and store last session
Every CardioGem session is automatically stored in the temporary memory. After ending a session, you can replay
the session from memory using the “multi-media” buttons on top of the Input Module (not to confuse with the sample
buttons!). You can also manually scroll through the recorded session. If you point on (either screen in) the input
module without pressing, the mouse cursor will change into a horizontal pointer. It changes as you move up or down,
which sets the scrolling speed until you press the mouse button. You may permanently store your last session on
hard disk using the “File” menu on the top, and select “store session”. Likewise, you can open a previously stored
session for replay.
4. Description of the CardioGem software
The following sections are arranged on the basis of a functional summary of the CardioGem software. Note: menu
items are always indicated with an underscore, like Menu - - Item.
4.1 General
4.1.1 Arranging your workspace
Grab the top bar to move modules, sides and corner to resize. Use the control buttons at the top right to minimize,
restore or close the module. The same controls apply to the main screen and the user guide. Note: a closed module
will remain active, although not visible.
Other functions available for arranging your workspace can be accessed from the main menu bar at the top, and are
summarized in the table below:
Main menu item:
Function:
File - Save config
Save current screen configuration
File - Open config
Open existing screen configuration
Settings - General - Auto load previous..
Settings - General - Set default config
Automatically load previous
configuration at start
Automatically resize modules while
resizing workspace
Restores default screen configuration
View - List of modules
Show or hide modules
View - Align to grid
Helps to easily line up the modules
View - Lock config
Locks the current screen configuration
Settings - General – Auto scale all
View - Set config
Same as “open config”, but with a nice
thumbnail selection gadget
4.1.2 Adjusting the graphs by means of on-screen scaling options
All graphical modules except the input module can be scaled simply by dragging the mouse cursor over the screen
in the direction of the desired effect:
-
Input module: no scaling options
-
Spectrum module: scaling the gain as well as the frequency range
-
ICC module: scaling the gain
-
History Module: scaling the gain as well as the time base
-
HRV Module: scaling the gain
4.1.3 Adjusting the graphs by means of the settings menu
All graphical modules except the input module can further be controlled from Main menu - Settings - [Module], resp.:
-
Spectrum module: move sliders to adjust waterfall depth and spacing
-
ICC module: move sliders to adjust waterfall depth and spacing
-
History module: drag cursor over styles thumbnail to select different combinations for the ICC history and
tacho graphs
4.2 Modules and process flow
The raw ECG data coming in through the A and optionally B channel is processed step by step to produce the
internal coherence and tachogram, and from there the history graph, as well as the HRV spectrum. A more detailed
technical summary is given in the attachment.
4.2.1 Input module
The channel input data is displayed in a fixed, right to left scrolling 4 second window, updated every second. Also
the gain is fixed, with a rough 500 mV reference. The timer indicates the lapsed time during sampling, resp. replay.
After a life recording session, or after opening a previously recorded session from harddisk, the session can be
replayed using the multimedia buttons or by manual scrolling. The scrolling speed can be adjusted before pressing
by positioning the cursor vertically over either input screen. The scrolling speeds are resp. 1, 5 and 30 seconds per
step. Start scrolling at the selected speed by pressing and and dragging horizontally.
4.2.2 Spectrum module
The channel input data is spectrum analyzed over an 8 sec. window resulting in a 0-64 Hz. magnitude spectrum. The
spectrum can be displayed in waterfall mode, with a fixed one step averaging. This means that every waterfall
series is the averaged result of the corresponding last two magnitude spectra. This creates a slight smoothed effect
without loosing definition. Below example is a typical spectrum of a person with nice coherence, with the range
adjusted to around 20 Hz.
4.2.3 Internal Cardiac Coherence module
This is the final ECG data processing step. The graph usually shows a peak indicating:
A. The amount of internal cardiac coherence. This is the peak heigth, and
B. The heart rate, as derived from the electrical spectrum. This is the horizontal index.
The vertical scale, that is, the peak level is normalised to a 0 to 100% range. This means that the pure internal
coherence level is given, independend from the spectral power. The horizontal scale is in fact a time interval scale
(indexed as 1/Hz), which can be interpreted to generate the BPM (beats per minute) heart rate. This value should
approximately be the same as the actual tacho level.
The peak level lies typically somewhere in the range of 20 and 80%, whereas the peak index for a typical heart rate
in the range of around 40 to 100 BPM is resp. 1.5 to 0.6 per Hz. The second peak at the right is a higher harmonic
of the main peak, and can be visible when the main peak index gets below 0.9 per Hz.
The optional "BPMc" value indictes the approximate heart rate (beats per minute) derived from the coherence peak
index. The BMPc option can be selected under Settings - Geometry.
4.2.4 History module
The History module shows the Internal Cardiac Coherence level trend (blue) as well as the tachogram (heart rate,
red).
4.2.5 Heart Rate Variability spectrum module
This is the power spectrum of the tachogram. The standard LF, MF and HF ranges are indicated by their resp.
colors. The example shows a typical HRV spectrum of a healthy person. HRV analysis (tachogram and spectrum) is
widely known, and various HRV devices are available. In the CardioGem, HRV is added mainly as extra help for
interpreting the proprietary ICC analysis. HRV and ICC are different functions, but they are not unrelated. Generally,
persons with very low HRV will have a constant high ICC level, but this is in this case not necessarily indicative of
emotional coherence. Therefore, ideally a person should have a healthy HRV level, while at the same time good ICC
statistics. More on this topic in the Quick Scan section.
The vertical bar shows the sum total MF and HF power index and is helpful for a basic, intuitional assessment of a
person's total HRV. Technical note: somewhat controversially, the "power index" is not created from the power
spectrum, but from the RMS spectrum - i.e. the sum total area under the curve of the non-squared spectrum. This
produces a better result, in that extremes (high or low) are being moderated, making the vertical index better
adapted for convenient, intuitional comparison. The maxumum score represents an emperical, cross-section
maximum. Representative healthy values are from around half of the scale. Lower than about a quarter of the scale
might for example call for some basic health and / or life style inquiry.
Note: because the HRV spectrum is a "slow wave" analysis, it will only show a graph after getting enough data, after
about 4.5 minutes.
4.3 Biofeedback mode
The CardioGem offers an excellent biofeedback environment with music and unique, world class panoramic flowing
scenery. To optimize the biofeedback experience and interactivity, the biofeedback scenery can either play full
screen or with reduced standard modules and functions. The spectrum and the complete Quick Scan are not directly
available
While in the diagnostic mode, switch to the biofeedback mode by clicking Biofeedback in the View menu.
Set up a biofeedback environment and start a session by the following steps:
Selecting a scenery
Setting various biofeedback preferences and parameters
Arranging a background music playlist and replay options
Selecting a (biofeedback) mode (1 to 4)
Your biofeedback preferences will be stored and reloaded after restarting the program.
The following Cardiogem Training / Biofeedback modes are available:
1.
2.
3.
4.
Simple regular breathing. No diagnostics and scenery roll.
Baroreflex training with heart rate diagnostics and feedback. No scenery roll.
Internal Cardiac Coherence (ICC) biofeedback
Dynamic Index biofeedback, diagnostics and statistics (advanced)
The following biofeedback functions and options are available:
Notes:
To start / end an ECG sampling session, or switch between modes, click one of the buttons 2, 3 or 4.
In mode 1 there is no ECG sampling and hence no biofeedback.
The ICC history is only shown in modes 3 and 4.
The statistics for Dynamic Index (ICC efficiency) biofeedback are only shown in mode 3 and 4.
The first vertical bar (orange) indicates the Dynamic Index (0-100%) of the entire (elapsed) session; the
second bar (blue) indicates the Dynamic Index ONLY of the biofeedback window in mode 4; the
corresponding colors are shown in the bell curve.
Automatic scenery roll and music during session replay is only used for the DEMO mode. However with the
FULL version, for demo purposes the session replay can be started áfter selecting a biofeedback mode.
Music Center:
Notes:
Upon opening the music center, the song list will be populated with .mp3 songs found in the ../music folder.
A few wonderful relaxation tracks come with the installer. You can add your own songs by copying them to the
../music folder.
Select a song in the songlist. Click "add song" to add it to the playlist, or pre-listen by clicking "Play".
Songs in the playlist can be selected for remove.
Set "Auto-start music" to automatically start replay when selecting a biofeedback mode or starting ECG
sampling.
Set "Always start with first song" to reset the playlist each time after the music has paused.
Set "Auto-repeat" to reset the playlist after finishing and continue.
Set "Audio cue" to activate the Midi audio biofeedback cue. Notes: the player and sound settings are taken
from the adio settings under the main settings (open from diagnostics screen), however the audio cue here is
switched on/off independendly. With an active audio cue, the background music should be manually muted or
set to a low volume, or auto-start music can be disabled.
Replay from the playlist can manually be overruled with the mute / unmute button in the Biofeedback Control
Panel. While muted, the music keeps playing.
Use the volume slider to set the sound volume as a % of the system volume (normally in your Windows
system tray, at the right lower corner). To play biofeedback background music, be sure to have your system
volume turned up.
Other biofeedback settings:
Functions and notes:
The breathing pacer including cycles / min.and inhale / exhale balance, applies to biofeedback modes 1 and
2.
The Dynamic Index biofeedback function applies to mode 4. The statistical result of the latest portion (time
window) of the ICC history is used as a biofeedback signal. The window can manually be set from 4 to 59
seconds. The typical meaningful window is around 16 seconds. Longer intervals are for more advanced users.
The Auto-play and volume settings are synchronized with those in the Music Center.
Select a scenery from the ../scenery folder. You may create your own sceneries (use approximately the same
picture size and take care of the seamless cylindrical wrap-around) or download from a growing stock of the
world's greatest sceneries.
Select your favorite biofeedback panel "wallpaper".
Scenery controls:
Manual close scenery is essentialy only used if the main program crashes, which could leave the scenery
open. Either way, the scenery can at any time restored with the central restore button.
Click "Stop" when scenery roll is not wanted.
Click "Sync" to open a window where you can optimize the scenery roll performance. It is especially meant
for somewhat older systems, but is also excellent to fine-tune the preferred scenery speed.
Click "Taskbar" to force your Windows taskbar on top, to access other programs and system functions. Click
anywhere to hide the taskbar.
Synchronization / speed control:
Especially on somewhat older systems, the scenery roll may not allways be maximum smooth. Use the
synchronization module to get the best quality closest matching the preferred speed. Be careful not to require too
much CPU resources due to too high speed and / or too high resolution. It won't crash your program, but stall it for a
while, cause visual artifacs, etc... Adjust the settings while a CardioGem session is replaying with music on. Best
start with lower speed and resolution and slowly gear up. A relatively newer system typically can just about handle
the highest settings, while at the same time performing all the CardioGem background operations. The scenery
speed is a matter of personal preference. Typical, pleasant speeds may lie around 40 to 80 pixels per second. Try
to use the 1 pixel frame interval for the smoothest result. Older systems may perform better at 2 pixel intervals. The
speed can also be adjusted in full screen mode.
Final notes:
While the screen is in biofeedback mode, toggle between the ICC and HRV modules by clicking the ">ICC" or
">HRV" buttons in the resp. windows.
The full screen biofeedback can be cancelled through the "Close Full Screen " button at the top left.
Revert from CardioGem biofeedback mode to the diagnostic mode by clicking Diagnostics.
4.4 Autonomic Cycle
The Autonomic Cycle module is a dynamic visualization of how the HRV and ECG spectra together create Internal
Cardiac Coherence, including the psycho-physiological interactions and psychic (emotional and mental) effects.
The AC module is first of all a teaching tool, but may also used in biofeedback style.
The Autonomic Cycle module, resp. during increasing ICC (visualizing HRV and ECG synthesis)
and during decreasing ICC (visualizing the release of vital energy and k inesiological potential)
Open the Autonomic Cycle module via the View menu. There are two basic modes:
ICC mode, based on a life or replaying ECG session
Demo mode (with various simple options)
You can select different backgrounds, for different teaching purposes. Note that, unlike in the panoramic
biofeedback environment, the diagnostic and replay screens are not visible. Use the local menu to select different
options. Close by clicking "Diagnostics" in the main menu.
4.5 Export Scan
The Export Scan function is accessible under the main File menu, and creates an essentially unformatted text file
with key heart data and statistics. The exported .cgx files, that is one per session, can be used for further user
evaluation in a database or spreadsheet, for example for longitudinal testing. Before exporting data, a quick scan
needs to be performed. The structure of the .cgx file is as follows:
Export Scan (.cgx)
Export Item
Format
Clarification
Example of .cgx file
appTag & " Scan"
endOfRecord
channelMode
Title
String
Integer
Integer
String
Fixed header for complete
(channel A or A+B) recording
incl. record length (seconds),
channel mode (A only or A+B),
Title and date if manually
submitted in session report.
"CardioGem Scan"
326
1
"John - test session"
Channel A Tag
psdLFA
psdHFA
psdRatioA
String
Integer
Integer
Decimal
Channel A data, with resp.:
Fixed channel A tag
HRV spectrum statistics
(histogram) LF and HF total
power and LF / HF ratio
"*** Channel A Scan ***"
6849
2069
3.31
averageBPMA
iccAverageA
Integer
Integer
average beats per minute
average coherence (0 to 100)
66
45
iccHistoA(2)
iccHistoA(3)
..
iccHistoA(10)
Integer
Integer
..
Integer
Histogram values for bins # 2
to 10 (0 to 100)
17
68
..
1
diValueA
Integer
Channel B Tag
psdLFB
psdHFB
psdRatioB
[same]
Dynamic Index (integer 0 to
100)
Channel B data..
note: if there is no channel B
data, zero values will be
exported
61
[similar]
averageBPMB
iccAverageB
iccHistoB(2)
iccHistoB(3)
..
iccHistoB(10)
diValueB
5. Other main menu items
5.1 Settings - General
The about screen can optionally be shown at each startup.
The screen configuration at program shutdown can automatically be reloaded at next startup.
If autoscale is activated, when the CardioGem main screen is resized, all modules will automatically be rescaled
proportionally. At any time, the default or user screen configuration can be reloaded.
The solid graph option toggles between solid (filled) and open grapshs style.
The channel selection sets channel A only, or channel A and B at the same time, or can be set to auto-select. In that
case, if one or two persons are connected, after about ten seconds it will automatically switch to the proper channel
selection.
The language selection immediately applies to all menu- and screen items. For advanced use, a language editor is
optionally available. More languages will become available in due time.
Choose a favorite CardioGem theme using the thumbnail slider (scroll horizontally), with optional background
image. Double click or click proceed arrow to apply.
5.1.1 Settings - Input
Enabling “multi sessions” allows the pausing and resuming of sampling sessions in a row, so that subsequent
sessions can be saved as a whole. The time counter stops at each pause. Optionally, a 5 second pause signal
(stillness) is automatically inserted. If multisession mode is switched on, use the pause button in the recorder bar
(top left) to pause a session.
Locking the screen during sampling prevents disturbance of measurements as a result of process overload. You are
advised to keep this function activated, however in order to optimize your module and graph settings, you can run a
short trial first without screen lock.
The option "auto end session afer 4.5 minutes" lets the sampling process stop automatically after said duration,
which is the minimum required to make a "Quick Scan" statistics summary afterwards. This is particularly helpful for
people who work with the CardioGem on their own, to avoid muscle noise at the end by clicking the stop button. The
end of session is indicated with a pop-up notification
The "disable" function on the notification can be clicked to disable "auto end session" directly without the need to
open the settings menu first.
5.1.2 Settings - Spectrum
Use the slider to adjust spectrum waterfall depth and - spacing. The changes are immediately applied.
5.1.3 Settings - Geometry
Use the slider to adjust Geometric Coherence waterfall depth and - spacing. The changes are immediately applied.
Also the BPMc option in the coherence module can be selected.
5.1.4 Settings - History
Drag your mouse cursor over the History thumbnail to select ICC History and / or tachogram combination and style.
The changes are immediately applied.
Use the slider to adjust the averaging of the ICC and Tacho trends in the History graph. The changes are
immediately applied to the graphs as well as to smoothen the biofeedback sound and game experience. For the
latter preferrably apply an averaging window of no more than 8 seconds.
5.1.5 Settings - HRV
Select various options for the HRV power spectrum in the Quick Scan.
5.1.5 Settings - Modulation
The CardioGem offers a powerful sound biofeedback ("Geometric Modulation") option which at the same time
indicates the ICC peak index (i.e. heart rate) and the coherence level. Through onboard or external speakers, or by
means of a headset, your computer's Midi sounds can be used for biofeedback training:
The left list shows standard and custom MIDI players on your computer. Select a device before proceeding. Scroll
through the right list to select your favourite biofeedback sound. While scrolling, each sound will be played briefly.
The small test window shows a virtual coherence peak. Move and resize the peak to test the sound, and to hear how
it responds to different levels. Use the button with the "note" to switch the biofeedback sound on or off.
5.2 The View menu
Module settings: show or hide, and set horizontal or vertical alignment of the modules (future option) in the
CardioGem main window.
Start the Panoramic Biofeedback and Autonomic Cycle environments.
Align to grid helps to easily setup a straight screen arrangement.
Lock config locks all modules size and position.
Set config is supplementary to the same function under the file menu, however in the form of a thumbnail scroll
selector. Scroll horizontally to select a screen configuration and double click or click the arrow to activate.
5.3 The Tools menu
5.3.1 Edit session report
The Session Report allows you to attach relevant parameters such as subject's details and observations to a
recording. Every recording automatically includes a report which by default is empty. The "copy to clipboard" and
"lock document" functions apply to the whole report.
Session Report
5.3.2 Quick Scan
The Quick Scan provides a one-click printable statistics summary of the entire session. HRV spectrum, ICC time
history and histogram and final Dynamic Index are printed
Quick Scan, scaled
This is an example of the Quick Scan statistic summary of a person with normal, healthy HRV values and at the
same time very good internal coherence.
In the menu above the graphics, Click "Quick Scan" to do the scan of the complete session, and left / right to toggle
between hemispheres. Click "print" to make a printout or PDF document.
The Quick Scan provides the following components:
HRV Power spectrum with HRV statistics
The HRV power spectrum is plotted against a reference norm, to get an impression of the allover HRV level and
balance. The spectrum graph can manually be averaged to obtain a smooth result which can much easier be
interpreted. The averaging slider pops up after clicking anywhere inside the HRV spectrum box. Close the slider by
clicking the "x" button or clicking ourside the HRV box. If the graph is averaged, a thumbnail image of the original
graph appears as reminder and reference. The slider not does not appear in the printout.
The average heart rate of the entire session (BPM, beats per minute) is printed next to the heart logo.
The statistics box shows the sumtotal LF resp. HF power density and the LF / HF ratio as decimal value and
histogram. The LF / HF ratio is commonly associated with the balance between (resp.) sympathetic / parasympathetic activity.
The statistics, heart rate and reference norm are optional and can be selected under Settinngs - HRV.
ICC time history
The ICC time history is plotted on a normalized percentage scale and is essentially identical to the ICC history
graph. The average ICC value is printed in the top right of the ICC history box.
ICC Histogram
The histogram shows the normalized distribution (in 10% bins) plotted against the ideal (natural) Gaussian
distribution with a central value of 50%. In most cases, the histogram roughly follows the Gaussian curve, however is
often shifted left or right (sometimes extremely), indicating less or more internal coherence.
Dynamic Index
The Dynamic Index gives in one value from 0 to 100% a sumtotal evaluation of the entire session.
5.3.3 CardioGem Breathing Trainer
The CG Breathing trainer distinguishes itself from the other modules through its greater number of settings, which
can be accessed through its local Settings menu. In that capactity the Breathing Trainer can be used stand-alone,
but also in combination with an ECG sampling session. In the latter case, the breathing wave by default starts
automatically shortly (around 14 sec.) after the normal sampling was started.
Functions:
Settings menu:
A
B
Breathing volume indicator ("windbag")
Training wave, adjustable through the Settings menu
C
D
Measured tacho (heart rate)
Progress indicator
E
F
Start / Stop button
End of session marker
cpm
t:
Breathing cycles per minute, resp. start and end
Total breathing exersize time
The settings menu contains three sections: wave type selection, wave adjust (sliders) and options. The autoloop
option only applies to the monotonic (fixed rhythm) wave. The UP and DOWN options apply to the time-variable
waves. The session time is not directly adjustable, but is created as a combination of the average- and total cycles
till marker (sliders). The options section applies to the different objects visible in the breathing trainer. By default and
in most cases all are checked.
Starting a CardioGem breathing session:
After selecting (or loading) the settings, a breathing session is started as follows:
A
B
Manually, using the start / stop button.
Automatically, with a short delay after a regular
sampling session was started.
A session ends when the marker is reached, or, in case the periodic wave with autoloop was selected, manually. In
both cases the tacho is automatically copied to the breathing trainer as long as tacho data is generated.
File menu:
Save settings
Opens a breathing session (applies to
breathing trainer only) which includes the
settings and tacho. The breathing module is not
resized.
Saves a breathing session which includes the
settings and tacho.
Loads the complete settings menu. The
breathing module is not resized.
Saves the complete settings menu
Close
Closes the breathing trainer
Open session
Save session
Load settings
Options menu:
Automatically starts the breathing trainer after
Auto start after sampling was started and has become stable.
14. seconds
A countdown to starting the breathing session
is shown at the top right above the volume bar.
5.3.3 Tree of Life
The "Tree of Life" is a small standalone program which comes as a plug-in with the CardioGem. It is a learning- and
teaching tool to proof and visualize how fractality in the human heart beat, optimized by Golden Mean Ratio creates
Heart Coherence. It is not for diagnostic or training purposes. A special user guide is included in the Tree of Life
program itself.
5.4 Help
Opens or closes this user manual.
5.5 About
Shows the introduction screen with logo and version number.
©All rights reserved, TrigunaMedia, 2012