Download USER MANUAL
Transcript
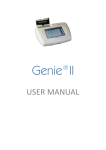
Genie II ® USER MANUAL OptiGene Ltd. Unit 5, Blatchford Road, Horsham, West Sussex, RH13 5QR Tel: +44 (0) 1403-272817 Fax: +44 (0) 1403-271017 www.optigene.co.uk [email protected] Information in this document is subject to change without notice. OptiGene Ltd assumes no responsibility for any errors that may appear in this document. This document is believed to be complete and accurate at the time of publication. In no event shall OptiGene Ltd be liable for incidental, multiple, or consequential damages in connection with or arising from use of this document. ® Genie II and its design is a registered trademark of OptiGene Ltd or its subsidiaries in the UK and other countries. Table of Contents SAFETY NOTICES ............................... 3 Calcein detection .............................16 SUPPORT ........................................... 5 Well names ......................................17 How to obtain support ...................... 5 ACTIVE SCREENS ..............................18 Profile ..........................................18 Temperature ................................18 Extend ..........................................18 Anneal..........................................19 Amplification. ..............................19 Anneal..........................................19 Results. ........................................19 supported consumables.................... 5 BOX CONTENTS ................................. 6 SITE PREPARATION ........................... 7 How to set up the Genie®II ................ 7 A/B ...................................................20 CONNECTIONS .................................. 8 Stopping a run .................................20 OPENING AND CLOSING THE LID ...... 8 NOTES SCREEN .................................20 INSERTING TUBES ............................. 9 Viewing previous runs .....................21 Battery .............................................. 9 Battery monitor .............................. 10 CONNECTING TO A COMPUTER .......23 Genie II firmware updates ...............26 EMBEDDED SOFTWARE .................. 11 GENIE®II Welcome Screen .............. 11 Main Menu ..................................... 12 Initial set up .................................... 12 Utilities............................................ 12 Touchscreen calibration .............. 13 Set Time and Date ....................... 14 Turn off ....................................... 14 RUN................................................. 14 To create a new profile ............... 15 To load a saved profile ................ 16 PC SOFTWARE ..................................30 Welcome Screen ..............................30 Quick start buttons ..........................30 Setting up a run ...............................31 Profile Screen ...............................31 Notes Tab.....................................31 Wells tab ......................................32 Profile Tab....................................32 Block Gradient .............................33 Options Dialogue Box ..................33 Graphs Tab...................................34 Peak Classification Tab .................34 Genotype Tab ............................. 34 Run Dialogue Box ........................ 34 Run Tab ....................................... 35 Observing a run............................... 36 Profile Tab ................................... 36 Isothermal Tab ............................ 36 Isothermal Ratio Tab ................... 36 Anneal Tab .................................. 37 Anneal Derivative Tab ................. 37 Peaks tab..................................... 38 Results tab .................................. 38 Analysis and Graph Options ............ 39 Genie®II Graph Options window . 39 Peak detect options .................... 40 Opening previous run files .............. 41 Additional features ..................... 41 export Function........................... 42 Chapter 1 SAFETY NOTICES Please read the following notices carefully before using the Genie® II system. The equipment supplied has been designed to consider the normal likely operation and features have been designed in to avoid risks associated with this use. However to avoid any risk to the safety of the equipment, operator or those in the same area as the equipment please read this chapter with care before unpacking and using the instrument. If you are in any doubt as to the correct use of the equipment please contact the vendor. Notices Using the instrument in a manner not specified by OptiGene Ltd may result in personal injury or damage to the instrument. Always ensure that the surface on which the instrument is placed is level and stable and will not cause the instrument to topple over. Ensure the surface is suitable for the weight and size of the instrument. If the instrument is dropped it may cause harm. The instrument should never be lifted by its covers. Always ensure that the base or sides are used as the lifting point. The instrument is electrically powered. Please ensure that the correct voltage settings have been applied before applying power to the instrument. If in doubt consult a qualified electrician. The instrument has a rating label affixed to the rear. Please consult this if needed. 3 Version 1.08 Always disconnect the equipment before moving or removing any guards or covers. Switch it off at the mains outlet remove the mains plug from the wall socket and remove the cable from the inlet socket on the rear. While every effort has been made to protect the inside of the instrument against splashes the instrument carries no IP rating. If fluids are spilt over the instrument they may get inside and cause a dangerous situation with respect to the voltage within the enclosure. If a spill occurs that may pose a danger, remove power from the instrument. Do not touch the instrument or any fluid flowing from it while it is connected to the live mains supply. Always follow local health and safety guidelines. Normal safe local operating standards should be applied in general terms. The items above are for guidance and are not a definitive list. Please consult the instrument supplier if you are in any doubt. Disconnection Method The Genie® II is disconnected by removal of incoming mains power source to the unit. Following disconnection the unit should be left for a period of at least 5 minutes before any internal assemblies are removed or examined. When in use the heating blocks and heated lid are hot, please allow to cool before touching the surfaces. Safe removal of fluids from the Genie® II will depend on the chemistry used. This will also require knowledge of the fluids used in the system to adhere with local Health and Safety and COSH regulations. If in doubt consult the person responsible for the equipment in the laboratory. 4 Version 1.08 Chapter 2 SUPPORT HOW TO OBTAIN SUPPORT For the latest services and support information go to www.optigene.co.uk/support.htm IMPORTANT! When directed to do so, contact OptiGene to schedule maintenance or calibration of the Genie® II instrument SUPPORTED CONSUMABLES IMPORTANT! Genie® II ™ uses a proprietary tube strip that maximise optical and thermal efficiencies. Other tubes and strips will not fit. IMPORTANT! Forcing non supported consumables will cause damage to the instrument and invalidate warranty. IMPORTANT! The shape of the tubes is such that they will only fit in one orientation. The locating pins on the block have corresponding holes in the strips. Catalogue number Description ISO-001 Isothermal Master Mix OP-0008-50 Genie® II tubes pack size 50 strips OP-0008-500 Genie® II tubes 500 strips pack size 5 Version 1.08 Chapter Chapter 3 2 BOX CONTENTS Following is a list of contents in the Box for Genie® II Genie® II instrument Power supply Power Lead USB connection Lead Manual PDF version on memory stick USB memory stick 6 Version 1.08 Chapter Chapter 4 1 SITE PREPARATION HOW TO SET UP THE Genie ® II The laboratory bench should be level and stable. The instrument should be placed centrally on the lab bench and the surfaces surrounding the instrument must be clear of obstructions at all times. Care must be taken not to unduly restrict the air inlet at the rear of the instrument and the outlet vent at the front of the instrument must not be covered. Restricting airflow by placing objects in front of these areas will impede operation and significantly affect performance. Electrical points should be close to the instrument to avoid injury from trailing wires. It is recommended that the instrument is kept away from sinks and other wet areas. Genie® II is an electrical instrument and care should be taken not to operate if there is a risk of water damage. 7 Version 1.08 CONNECTIONS Once un-packed, Genie® II is ready for use. Connect the power supply plug into the back of the instrument and then attach the power cable to the supply. Located to the rear of the instrument is an on/off power button, switch to on and Genie® II will power up and progress through its checks. USB POWER IN OPENING AND CLOSING THE LID To open and close the instrument lid to add or remove samples, gently lift the lid and it should open upwards. Close the lid by lowering gently. Care must be taken to ensure that objects are not obstructing the lid when trying to close it and under no circumstances should you force the lids open or closed. 8 Version 1.08 INSERTING TUBES You will notice that each of the heating blocks has locating pins The Genie II strips have holes that locate on these pins, the strips will only fit in one orientation. IMPORTANT! Genie® II uses a proprietary tube strip that maximises optical and thermal efficiencies. Other tubes and strips will not fit. BATTERY The Genie® II has an internal rechargeable battery. The battery is fully charged and ready for use. The battery monitor is on the status bar next to the time and date To activate the battery monitor, press the battery icon and the monitor will appear as a popup. To remove the pop up simply press on the status indicator Battery status pop-up IMPORTANT! The Genie® II internal battery will only charge when the instrument is plugged into mains electricity and the instrument is switched on. Genie® II can then be shut down using the ‘turn off’ command within the utilities menu. The LED will glow brightly until the battery is fully charged. At this point Genie® II can be switched off using the switch on the rear. 9 Version 1.08 BATTERY MONITOR The battery status can be seen but there is no pop-up Here the pop-up shows that the battery is charging 62% Here the pop-up shows that the battery is fully charged The pop-up shows that the instrument is in use and the battery is at 99% 10 Version 1.08 Chapter Chapter 5 1 EMBEDDED SOFTWARE The Genie® II uses a touchscreen for viewing and inputting data. Simply touch the screen gently and press the keys required. IMPORTANT! Do not use a pen or any other implement upon the screen otherwise damage could occur. GENIE®II WELCOME SCREEN When switching on the LED above the screen will be amber in colour, wait for the light to change to green, then simply touch the screen to access the main menu. 11 Version 1.08 MAIN MENU To begin a new run click run To view profiles or previous runs click view To access the utilities click utilities INITIAL SET UP When running for the first time check the time and date on the lower status bar. If either are incorrect then proceed to change the time and date. The time and date settings are in the utilities menu. UTILITIES To access the utilities screen click the utilities tab on the menu bar, you are then given several options. 12 Version 1.08 TOUCHSCREEN CALIBRATION Touching anywhere on the screen with the exception of Test or Skip will invoke the touchscreen calibration Here you are required to touch the target points shown on the screen, this will calibrate the touchscreen To check the sensitivity of the screen press test. Any point now pressed on the screen will be displayed. 13 Version 1.08 SET TIME AND DATE Click in the white box for date and enter the date. The date should be in the format DD/MM/YY. Click in the white box to enter the time. The format should be HH:MM:SS TURN OFF Pressing turn off, will place the Genie® II into ‘standby’. Genie® II can also be placed into standby mode by pressing the symbol. Note if pressing this button during a run Genie® II will not enter standby mode. Normal operation can be resumed by pressing anywhere on the screen. RUN When you choose run you will be taken to the profile window. Here you can choose to create a new profile, load an existing profile or cancel and return to the menu screen. 14 Version 1.08 TO CREATE A NEW PROFILE Press the New button the run screen. Adjust the profile by touching the temperature box or time box that you wish to change. Inputs are made using the onscreen keyboard, which will appear, as in the example below. Once you have made the required changes press Enter and now you can save the profile. Name the profile, click save and it will be saved within the directory allowing you to load it for future runs. Name the profile, press Okay and it will be saved within the directory allowing you to load it for future runs. 15 Version 1.08 TO LOAD A SAVED PROFILE From the menu on the left choose the protocol that you wish to load and press the load key. The profile will be loaded and you will see the profile in the next screen To begin the run alter the profile if required and press start. You will be prompted to choose Block A, Block B or both CALCEIN DETECTION If you are running experiments with Calcein rather than Fluorescein Click on the tick box for Calcein. 16 Version 1.08 WELL NAMES Click on the wells button Wells button will load the wells screens For The first block click the well that you wish to insert a name into and type the name you wish. More switches to the second block Okay continues back to the run screen Cancel returns to the run screen Second block well names If the run is saved at this point the well names and abbreviations will also be saved as part of the profile The wells screen can be accessed at any time the instrument is running by returning to the profile screen and pressing the wells button. 17 Version 1.08 ACTIVE SCREENS Once the run has started you will be able to access the active screens. The software will automatically go to the temperature screen, however you can access other screens using the tabs below active. PROFILE This shows you the profile that is running. TEMPERATURE This shows you the temperature of the block (s) as the experiment is progressing. EXTEND This allows 10 minutes to be added to the Amplification phase by clicking the button 18 Version 1.08 ANNEAL Advances the programme from amplification to the Anneal phase by clicking the button AMPLIFICATION. This shows you the fluorescent data that is being acquired during the amplification phase of the experiment. ANNEAL. This shows you the fluorescent data that is being acquired during the anneal phase of the experiment. RESULTS. This shows you the results of the experiment. You will see the sample name and then its respective amplification time and Anneal temperature. 19 Version 1.08 A/B When Genie II is running you can switch the views for Temperature, Amplification, Anneal and Results between block A and Block B by pressing the A/B button on the top menu bar. STOPPING A RUN If you need to stop a run in progress, return to the Temperature Screen and press the stop button. A confirmation pop up box will prompt yes or no. NOTES SCREEN On the notes screen you can make notes about the experiment that you are performing and they will be stored as part of the log file 20 Version 1.08 VIEWING PREVIOUS RUNS To view previous runs click the view button on the top menu. All Genie runs are saved in the log folder Click on log, then open. Each run is stored in a folder by date order Each run is then stored numerically in sequential order. 21 Version 1.08 Please wait for the file to load and then you will be able to view the data You are now able to view the profile that was run, the temperature log, the amplification, the anneal and the results table. 22 Version 1.08 Chapter Chapter 6 1 CONNECTING TO A COMPUTER Genie® II is a standalone instrument however for software updates and other applications you may wish to connect to a computer. IMPORTANT! Do not plug Genie® II into the computer before installing software. The PC software is preloaded on the USB stick. Insert USB memory stick into computer. Choose ‘Set up installer’ Choose a location for installation to take place. 23 Version 1.08 Accept the License Agreement The software will inform of the processes being performed Overall progress Installation complete, click Finish 24 Version 1.08 System must be restarted Genie II can now be connected to the computer. When connected via USB and switched on, the Genie® II will appear as a USB device. Device driver software will be installed from the Genie® II Device Driver installation Genie® II is now visible as a USB device and the name appears as the instrument’s serial number. Log files and Profile files can be copied from the Genie® II to the computer and vice versa Genie® II is now ready to be used and can be controlled from the computer. 25 Version 1.08 GENIE II FIRMWARE UPDATES First check which versions of Firmware and FPGA are installed on your Genie. They are shown in the bottom left hand corner of the Main Menu screen For Versions 0.99 or earlier please contact OptiGene directly for the correct upgrade files. It is highly recommended to upgrade. For Versions 1.00 and later go to the OptiGene website and check on the Support page if there is a newer version of firmware available. 26 Version 1.08 Click on the link and download and save the zip file. Open the zip file and extract the contents to a new folder. The contents of the new folder will include this guide and the latest firmware and FPGA code. If your Genie already has the latest FPGA code then you only need to upgrade the firmware code. If you need to upgrade both the FPGA code and the firmware code then upgrade the FPGA code first, followed by the firmware code using the Genie® II software on your computer. To install code updates, Connect your Genie® II to your computer, open the Genie® II software on your computer and choose software update from the options menu 27 Version 1.08 Click on software update Genie is detected and you click OK to accept 28 Version 1.08 Navigate to the folder where you have extracted the downloaded zip file and choose the file to upload and click send The file will be uploaded. Genie® II will only restart after installation of a firmware file has completed. It will not restart if an FPGA file has been uploaded. The new FPGA code will show on the Main Menu upon a Genie® II restart. 29 Version 1.08 Chapter 7 PC SOFTWARE WELCOME SCREEN From this screen you are able to choose to start a new experiment or review data saved from previous runs. If you wish to carry out an experiment make sure that Genie® II is connected to the computer and switched on. To start a new isothermal protocol, simply click the Isothermal button. QUICK START BUTTONS The Quick Start Buttons are the buttons on the front welcome screen. Normally they state ‘Preheat’, ‘Isothermal’, ‘Anneal’ and ‘Other…’ These buttons can be modified very easily, so frequently run experiments can be stored as a button and run right from the welcome screen. Simply save your run file as you need it then simply go to Options on the welcome screen and click buttons. Then type in the name you wish to call that run and tell the button where the run file is located. The Welcome screen should then be updated with your new button. 30 Version 1.08 SETTING UP A RUN PROFILE SCREEN In this screen you are able to modify all the experiment parameters Notes Assays Wells Profile Graphs Peaks Classification Genotypes Simply click upon the tab in which you want to add information into. We recommend however that you work through the tabs in order Notes, Assays, Wells and Profile. This will allow you to add all the information necessary before starting the run. NOTES TAB If you click the notes tab, this allows you to make any experimental notes relevant to the assay you are running. 31 Version 1.08 WELLS TAB This tab allows you to input specific sample information. Choose if you are running 8 or 16 wells (default is 8) You have the ability to enter names, change plot colours, line styles and choose to make the sample visible on the display or not. PROFILE TAB The Profile tab allows you to set the thermal profile that you wish to use and gives you an estimated run time for your desired profile. If you require activation for the enzyme then tick the Preheat/Activation checkbox. Now set the required temperature and time for the Preheat/Activation. Make sure the Isothermal checkbox is ticked and then alter the temperature and time to suit your assay conditions. 32 Version 1.08 If you are carrying out an Anneal curve at the end of the reaction, then tick the checkbox for Anneal and alter the start and end temperature. This dialogue box shows how to set an annealing curve from high temperature to low temperature. The melt Tm peak will be a different temperature from an annealing Ta peak. This is normal. BLOCK GRADIENT The Block Gradient facility enables a gradient to be set across the blocks. This is especially useful when setting up assays for optimisation of the correct temperature. To set a gradient. Set centre temperature as 63.5°C with a gradient of 7°C. That will set from 60°C in well 1 to 67°C in well 8. OPTIONS DIALOGUE BOX If you click the options button You will see the following screen, which allows changes to be made to the protocol parameters 33 Version 1.08 GRAPHS TAB The graphs tab allows the criteria for different graphs to be adjusted Simply click on the tabs for each graph and alter settings, as you require. For more information see Analysis and Graph Options Chapter PEAK CLASSIFICATION TAB This tab allows you to identify peaks for genotyping. Define and enter peaks into the table and the software will automatically label matching peaks. GENOTYPE TAB The genotype tab allows the user to define peaks, which can be used for automated genotyping by the software RUN DIALOGUE BOX 34 Version 1.08 When you click Run, you will see the start run dialogue appear. This allows the user to choose which Block you would like to run and also allows you to save the run file under a name of your choice. You can create a new folder or simply navigate to an existing folder. We advise that you only save files in folders/subfolders in the Genie® II folder under My Documents. Check that you are running the assay on Block A or Block B or Both. Symbols in the run name get converted to underscore in the file name If you do not give a file name the File name is created from run name + unique number in the target directory. RUN TAB The run tab is the experiment information screen. It displays the run name, profile running and run date. It allows you to input the operator name, make experimental notes. 35 Version 1.08 OBSERVING A RUN PROFILE TAB When running, the profile screen allows you to observe the temperatures of the blocks and the heated lids plotted against time. It acts as a thermal record of the run. ISOTHERMAL TAB When running, the Isothermal screen allows you to observe the fluorescence of each well plotted against time. ISOTHERMAL RATIO TAB Isothermal Ratio peak time is equivalent to the Ct or Cq in qPCR assays. Our method identifies a consistent point within the exponential region without user intervention. This amplification ratio generates several measurements of amplification including time of crossing and relative measures of amplification efficiency and curve shape. This allows the ratio method to achieve highly reliable determination along with quantitative evaluation. Isothermal Ratio is unaffected by drifting fluorescent baseline, unnormalised baseline and odd jumps in the amplification plot due to bubbles in a tube etc. 36 Version 1.08 Genie®II software can detect the peaks and call them automatically. Select the Peak detect option (None Simple or Full), check the default Peak criteria and click Okay. The peak criteria allows the software to ‘call the peak’ in the results table. ANNEAL TAB The anneal tab plots the fluorescence of each well versus temperature in a annealing curve ANNEAL DERIVATIVE TAB The Anneal Derivative tab shows the derivative fluorescence of each well plotted against temperature, thereby giving the data as a peak. 37 Version 1.08 If the Peak detect box is set on Simple or Full then the peaks will be displayed in the results table. Check that the peak criteria are set. PEAKS TAB This page shows the results in a tabular format and displays the peaks for the different profiles used within the experiment, the position of peaks, the peak width and height. RESULTS TAB This page shows the results in a tabular format and displays the peaks and genotypes 38 Version 1.08 ANALYSIS AND GRAPH OPTIONS GENIE®II GRAPH OPTIONS WINDOW Click the settings button and it displays the Genie® II Graph Options window. From this window several aspects of the graphical information can be modified. There are four tabs on this page and each tab allows the user to check and modify settings appropriate for that tab i.e. Isothermal, Isothermal Ratio, Anneal & Anneal Derivative. Normalisation allows all the fluorescent signals to be normalised/back grounded over a defined period of time. Tick the normalisation checkbox and then set the time for normalisation from say 60 seconds to 240 seconds. Then click Okay. The screenshot below shows data that has not been normalised; the fluorescent signals are different for each well and look untidy. 39 Version 1.08 With Normalisation PEAK DETECT OPTIONS None: no peaks are detected Simple: The software looks at the peak and assigns the peak to the highest plotted point. Multiple peaks can be detected. Full: The software curve fits and assigns the centre of a peak and can report multiple peaks. Also does sub-point interpolation. 40 Version 1.08 OPENING PREVIOUS RUN FILES To view previously run data simply go to File, Log and open the file you require. Files are saved by default in a Genie® folder in My Documents. The run file is encrypted. The requested file will be loaded back into the software and you will be able to analyse the data as required. ADDITIONAL FEATURES Extend: If you are running an isothermal assay and find more time is required press the extend button and the run will extend by 10 minutes. If the button is pressed 3 times it will extend the run by 3 x 10 minutes. A box will pop up every time Extend is pressed and the Run profile will be updated to show the new time. Advance: if you are happy that the amplification has completed and you would like to go to the annealing curve, you can press the advance button and it will stop the isothermal phase and go onto the next stage specified Stop: Stop will stop the run in progress, DO NOT press unless you want the run to stop 41 Version 1.08 Export: when you have finished the analysis, you can export the results into a txt file. Simply name and save the file. This allows you to import the results into Excel or other spread sheet programmes. EXPORT FUNCTION The Export function allows that data from each graph can be individually exported as a tabdelimited .txt file that can be imported into a spreadsheet for additional end-user manipulation. The example below shows that if you export the Isothermal graph it will export time versus fluorescence for each well. Time Fluorescence Time Fluorescence Time Fluorescence Time 80.6 -238.3 80.6 -194.8 80.6 -340.2 80.6 95.6 -213.3 95.6 -148.8 95.6 -275.2 95.6 110.6 -160.3 110.6 -91.83 110.6 -198.2 110.6 125.6 -127.3 125.6 -75.83 125.6 -158.2 125.6 The data exported is the data from that graph; if changes are made to the graph for analysis purposes then the graph will need to be re-exported for the changes to be reported. 42 Version 1.08 FOR EACH GRAPH Profile Graph Export time versus temperature for each well plus heated lid i.e. 10 temperature readings four times every second throughout the run. Isothermal graph Export time versus fluorescence for each well. Isothermal Ratio graph Export time versus fluorescence ratio for each well. Anneal graph Export temperature versus fluorescence for each well. Anneal Derivative graph Export temperature versus fluorescence derivative for each well. Peaks graph Export the Well, Name, Peak Position, Value, Width, Weight, d²Y/dX², Relative and Class for each well. Results graph Export Well, Name, Genotype, Abbreviation, Peaks for each well. 43 Version 1.08 OptiGene Ltd. Unit 5, Blatchford Road, Horsham, West Sussex, RH13 5QR Tel: +44 (0) 1403-272817 Fax: +44 (0) 1403-271017 www.optigene.co.uk [email protected] Information in this document is subject to change without notice. OptiGene Ltd assumes no responsibility for any errors that may appear in this document. This document is believed to be complete and accurate at the time of publication. In no event shall OptiGene Ltd be liable for incidental, multiple, or consequential damages in connection with or arising from use of this document. Genie® II and its design is a registered trademark of OptiGene Ltd or its subsidiaries in the UK and other countries. 44 Version 1.08


