1
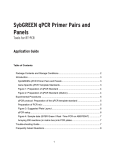
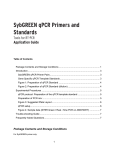
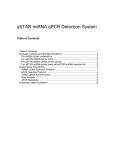
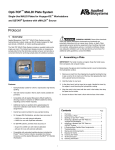
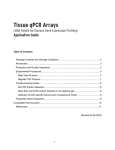
qSTAR Expression Detection System Tools for qPCR Application Guide Table of Contents Package Contents and Storage Conditions ................................................................. 2 Introduction .................................................................................................................. 3 qSTAR qPCR Primer Pairs and Panels ................................................................... 3 Gene Specific qPCR Template Standards ............................................................... 3 Experimental Procedures ............................................................................................ 4 qPCR Individual Primer Protocol .............................................................................. 4 qSTAR qPCR Primer Panel Protocol ....................................................................... 4 Data Analysis ........................................................................................................... 5 qPCR Standards ...................................................................................................... 6 Trouble-shooting Guide ............................................................................................. 10 Frequently Asked Questions...................................................................................... 10 1 Package Contents and Storage Conditions For qSTAR primer pairs: 1 Vial qSTAR qPCR primer mix: 2 nmol lyophilized (sufficient for 200 reactions). Before use, reconstitute the primer mix in 200 µl dH2O to make a final concentration of 10 µM. Application Guide For qSTAR primer pairs and qSTAR standard kit: 1 Vial qSTAR qPCR primer mix: 2 nmol lyophilized (sufficient for 200 reactions) 7 1 Vial Gene Specific qPCR template standard: 50 X 10 Copies** (double-stranded DNA) lyophilized. Add 50 l of d H2O to the tube and vortex briefly. The resuspended template is 10,000,000 copy/l. 1 Vial containing 1 mL 10 x PCR template standard dilution buffer. Application guide For qSTAR primer panels (200 reactions): 1 matrix box containing 96 gene-specific qPCR primer pairs: 2nmol lyophilized (sufficient for 200 reactions) 1 vial of beta-actin primer pair Flash Drive containing plate layout, gene symbol, locus ID, and primer sequences Application Guide For qSTAR primer panels (3 pre-arrayed panels): 3 PCR plates containing 96 pre-arrayed qPCR primer pairs in each plate:10pmol lyophilized 1 vial of beta-actin primer pair Flash Drive containing plate layout, gene symbol, locus ID, and primer sequences Application Guide For qSTAR primer panels (10 pre-arrayed panels): 10 PCR plates containing 96 pre-arrayed qPCR primer pairs in each plate:10pmol lyophilized 1 vial of beta-actin primer pair Flash Drive containing plate layout, gene symbol, locus ID, and primer sequences 1 Application Guide For qSTAR primer panels (20 pre-arrayed panels): 20 PCR plates containing 96 pre-arrayed qPCR primer pairs in each plate: 10pmol lyophilized 1 vial of beta-actin primer pair Flash Drive containing plate layout, gene symbol, locus ID, and primer sequences Application Guide The above components are shipped at room temperature, but should be kept at -20C for long-term storage. If properly stored, they have a 12 month shelf life. * The polymerase chain reaction (PCR) is protected by patents held by Hoffmann-La Roche. Purchase of any of OriGene’s PCR-related products does not convey a license to use the PCR process, covered by these patents. Purchasers of these products must obtain a license before performing PCR. ** see page 8 on how to calculate the copy number of an unknown sample. NOTE: FOR RESEARCH PURPOSES ONLY. NOT FOR DIAGNOSTIC OR THERAPEUTIC USAGE. -2- Introduction Real-time PCR is one of the most important approaches in detecting the transcript level of a gene in a particular cell or tissue sample. Two types of real-time PCR detection methods are currently used. One is probe-based and the other is SYBR Green I based. The two protocols utilize fluorescent probes or dyes that are proportional to the amount of the PCR products generated at the end of each cycle. Differences between the two methods involve the types of fluorescent signals used and the ways in which the signals are generated. In the TaqMan protocol, a pair of gene-specific amplification primers and a sequence-specific, fluorogenic probe is present in the PCR mixture. During amplification, the probes anneal proportionally to the single strand amplicons and are subsequently removed base-by-base by the 5’ exo-nuclease activity of Taq polymerase. Consequently, the released fluorescence moiety generates fluorescent signals that are proportional to the amount of PCR product generated. This method is very sensitive and reliable. The SYBR Green I protocol, on the other hand, does not require a sequence-specific fluorescent probe. SYBR Green I binds to double stranded DNA to generate detectable fluorescence, and the amount of signal is proportional to the amount of double-stranded DNA present. Since SYBR Green I binds indiscriminately to double-stranded DNAs, it will generate false signals if non-specific DNA contamination exists. Nevertheless, it is frequently used in many laboratories due to its simple protocol and low cost. qSTAR qPCR Primer Pairs and Panels The most essential component of a successful qPCR is the primers used to amplify the template. Only well-designed primers can give trustworthy expression data using qPCR. Poor primer design usually results in non-specific PCR products and/or primer dimers. These undesired DNA by-products would interact equally well with SYBR Green reagents, and therefore generate a false positive signal. To design primers with a high specificity and a low incidence of primer dimer formation, OriGene conducted a large scale study of qPCR involving thousands of primers. Based on the vast qPCR data acquired through this study, OriGene scientists were able to develop a superb primer design algorithm. With this algorithm, OriGene is able to provide customers with genome-wide pre-designed, ready-to-use qPCR primers. Besides high specificity and high efficiency, each primer pair is also selected to span exon junctions whenever possible, thus avoiding the amplification of genomic DNA. The same effective primer design algorithm is utilized to design oncology-focused qPCR primer panels covering a variety of pathways for cancer biomarker profiling. Each individual primer pair is supplied as 2 nmol lyophilized powder. Before use, reconstitute the primer mix in 200μl dH2O to make a final concentration of 10 uM. The primer panels are supplied either as 10pmol lyophilized pre-arrayed primer mix in PCR plates or 2nmol lyophilized primer mix as 200 reactions in a matrix box. Gene Specific qPCR Template Standards A known qPCR template standard serves two main purposes. It functions as a positive control and as a reference for measuring the exact copy number of a transcript in an unknown sample. OriGene has a large collection of full-length human and mouse cDNA constructs which are ideal PCR templates. To increase the accuracy of DNA quantification, a full-length cDNA is purified using ion-exchange columns, linearized by a restriction enzyme and quantified by the PicoGreen method. The PicoGreen method relies upon an ultra-sensitive fluorescent nucleic acid stain and has a much higher accuracy than a UV spectrophotometer for determining DNA concentration. The process for the preparation of a qPCR standard is illustrated in Figure 1. -3- Experimental Procedures qPCR Individual Primer Protocol Each individual primer pair is supplied as 2 nmol lyophilized powder. Before use, reconstitute the primer mix in 200 μl dH2O to make a final concentration of 10 uM. 1. Transfer 5 μl of the cDNA sample to a well of the qPCR plate; add 1 μl qPCR primer pair mixture and 6.5 μl H2O. 2. Add 12.5 μl 2X SYBR Green I qSTAR qPCR master mix 3. Set up the PCR run according to the machine’s user manual. Start the PCR reaction. 4. Analyze the data according to the machine’s user manual The following conditions can be used as reference for standard qPCR when using qSTAR primer mix. Stage 1: 50°C 2 min 95°C 10min Stage 2: 95°C 15 sec 60°C 1 min 40 cycles Stage 3: Dissociation curve: 95°C 15 sec 60°C 15 sec 95°C 15 sec *Certain SYBR Green Master mixes require a specific activation step. Refer to the manufacturer’s manual for setting up your PCR program. For faster qPCR machine, you may need a different program. qSTAR qPCR Primer Panel Protocol Synthesis of cDNA as qPCR templates: Before using the panels for profiling multiple RNA samples, one needs to generate enough total cDNA from each RNA sample by utilizing the cDNA synthesis protocol described below. In general, 5 to 10 ug total RNA is required for each 96 well qPCR plate to generate sufficient cDNA for qPCR. To reduce systematic variations when comparing the expression among multiple samples, it is necessary to perform RNA isolation and cDNA synthesis in parallel for all samples. QC of cDNA: We recommend testing the cDNA samples using one house-keeping primer pair of your preference prior to conducting the qPCR reaction on the whole panel. Only use a high quality cDNA for the panel. Procedure: Remove a qPCR plate from -20C and allow it to thaw to room temperature. Prepare a pre-mix in a 5 ml tube according to the following recipe. For SYBR Green Protocols: 96 samples Stock Solution 2X Master mix cDNA template + ddH2O Volume 1250 µL 200 µL* 950 µL Total 2500 µL -4- Final 1X * The amount of cDNA used in the panel has a great effect on the overall detection efficiency. Too little cDNA will fail to detect low abundant genes. A proper amount can be determined by a pilot experiment using the ß-actin control primer mix included in the kit. An ideal amount of cDNA in a well is defined as the amount that will generate a Ct value for ß-actin approximately equal to16. Remove the sealing film from qPCR plate. Aliquot 25 µL of the PCR pre-mix to each well, avoiding crosscontamination due to pipetting. This can best be achieved using a multi-channel pipettor. Cover the top of the plate with a new adhesive cover sheet (provided). Seal each well tightly by pressing the cover around each well. Remove any air bubbles that may have been trapped at the bottom of the tubes by gently tapping the plate. Let the plate sit on ice for 15 min to allow the dried cDNA to dissolve. Gentle vortexing will facilitate the re-suspension of the DNA. Mount the plate snugly into the four rows at the center of the heating unit of a 96-well real-time thermal cycler, so that each well makes tight contact with the heating unit. Tighten the lid to ensure a direct contact between the lid and the top of the 48-well plate to prevent any evaporation from the wells. These steps are very critical for even template amplification. Use a thermal cycling program optimized for your gene-specific primers. The following conditions can be used as reference for standard qPCR when using qSTAR primer mix. Stage 1: 50°C 2 min 95°C 10min Stage 2: 95°C 15 sec 60°C 1 min 40 cycles Stage 3: Dissociation curve: 95°C 15 sec 60°C 15 sec 95°C 15 sec *Certain SYBR Green Master mixes require a specific activation step. Refer to the manufacturer’s manual for setting up the PCR program. Data Analysis Data type and analysis method The qPCR panels are designed to study the expression changes of multiple genes in two different samples, e.g., a normal tissue versus a tumor tissue or a control sample versus an experimental sample. The data obtained from a PCR run are a set of Ct (cycle threshold) values. Each Ct value reflects the abundance of a corresponding PCR template. A commonly used method for comparing the expression differences between two samples is called Delta Delta Ct (∆∆Ct) method. It can generate the fold change of gene expression in one sample versus the other. For a particular target, the Fold change prior to normalization can be calculated using the following formula. Basically, one PCR cycle difference is 2-fold when we assume the PCR efficiency for the target is 100%. Fold change=2 (∆Ct1-∆Ct2) Minimization of variation It is conceivable that the amount of cDNA used in the PCR reaction will affect the Ct values. The more the cDNA added, the lower the Ct value obtained. To minimize the variation, it is recommended to use the same amount of cDNA for each sample determined by the input of RNA used in cDNA synthesis. In addition to the cDNA loading, other factors can also affect the Ct values, such as PCR reagents, pipetting and the PCR machine. Therefore, it is recommended to keep all reagents, reaction volume and operation as consistent as possible. One important note is that during PCR data analysis, one should set the threshold line at a fixed position manually for an experimental group so the Ct values from different runs are comparable. Some researchers prefer to do multiple PCR runs and get an average of Ct values for each target. -5- Normalization Even with all the efforts mentioned above, variations are unavoidable because of the difficulties in measuring the amount of cDNA precisely and pipetting consistently. To compensate for these differences, one common method is to use reference genes that are known to express consistently among different samples in an experimental group. Each primer panel contains three sets of frequently used housekeeping genes—ß-actin, GAPDH and HPRT. One may select any one or an average of any two or three reference genes to adjust the expression differences of other targets in the same panel. An Excel template with the gene symbols, locus id, primer sequences and data analysis formula will be supplied with each kit upon shipment. Validation of Interesting targets Once interesting targets are identified through the above analysis, it is recommended to confirm the finding by single qPCR only for the individual targets selected and reference genes across all samples. By utilizing qPCR standards for the selected targets and employing the standard curve qPCR method, one can calculate the target templates’ expression using accrued PCR efficiency and determine the exact copy number of a target in a sample, a much more precise measurement than with relative qPCR quantitation (see next section). qPCR Standards Figure 1: Preparation of qPCR Standard A B 230000 220000 210000 200000 y = 3511.6x R2 = 0.9926 190000 180000 170000 160000 150000 140000 130000 120000 110000 100000 90000 80000 70000 60000 50000 40000 30000 20000 10000 0 0 5 10 15 20 25 30 35 40 45 50 55 60 65 A. An Eco RI linearized qPCR template standard is run on a 1% agarose gel. B. Plot of a template DNA and PicoGreen standard from a PicoGreen assay. The concentration of the template DNA is converted -9 from ng per l to copy number per l using the following formula: (C * 10 / MW) * NA (C: template 23 concentration ng/l, MW: template molecular weight in Daltons, NA: Avogadro's constant, 6.022 x 10 ) Figure 2: Preparation of qPCR Standard (dilution) 10 μl 10 μl 10 μl Stock tube 90 μl -6- 10 μl 10 μl 10 μl 7 1 x 10 /ul 6 10 5 10 -7- 4 10 3 10 2 10 10 1 copy/ul qPCR protocol for the qPCR template standard 1. The qPCR template standard is provided as a dried pellet. Add 50 l of d H2O to the tube and vortex briefly. The resuspended template is 10,000,000 copy/l. Thaw the 10 x dilution buffer tube from the kit at room temperature. 2. If the SYBR Green I method is used, reconstitute qSTAR primer by adding 200 l d H2O to the primer tube and vortex it briefly. The resuspended primers are 10 pmol/ul each. (Omit this step if Taqman probe method is used) 3. Prepare 1.0 mL of 1 x dilution buffer by adding 100 μl of the 1 X buffer to 900 μl H2O. 4. Label six (6) Eppendorf tubes from 1 to 6. Transfer 90 μl of 1x buffer to each pre-labeled eppendorf tube (1 to 6). 5. Transfer 10 μl of template standard from the stock tube to eppendorf tube #1 (Fig. 2). Mix the solution by briefly vortexing. 6. Transfer 10 μl solution from tube #1 to tube #2, then mix the solution by vortexing.. 7. Perform remaining dilutions by repeating steps 5 and 6. 8. Transfer 5 μl of diluted template solution from each tube to a 96-well PCR plate (use 2 μl when a 384-well plate is used). Preparation of PCR mix: The qPCR template standard can be used with either the Taqman probe based method or the SYBR Green I method. Step one, calculate the total volume of the PCR mixture based on the number of the total samples. The following recipes are for setting up a cocktail for 60 samples (6 template standard dilutions in duplicate and 48 unknown samples). The qPCR reaction volume is 25 μl volume in 96-well format for both the SYBR Green method and the Taqman probe method: When the 384-well format is adopted, reduce all reagents proportionally. The recommended reaction volume for 384 is 10 μl. SYBR Green I method Prepare the cocktail as follows: 2 x Master mix Primer mix H20 64X solution 800 μl 64 μl 416 μl 1,300 μl Taqman probe method Probe method 2 x Master mix 20 x Taqman Probe * with the gene specific primers included 800 μl 80 ul H20 420 μl 1,300 μl -8- Figure 3: Suggested Plate Layout PCR standard Unknown Empty well qPCR set-up 1. Transfer 5 μl of each of the six qPCR Template Standard dilutions to Row A in duplicate 2. Add 5 μl of each unknown sample to row C, D, E and F. The amount of cDNA in each reaction is ideally around 1 to 10 ng, diluted with the dilution buffer included. 3. Add 20 μl of PCR cocktail to each of well of row A, C, D, E and F. 4. Seal the PCR plate with a real time PCR sealer. 5. Mount the plate to a real time PCR machine, such as ABI 7900HT. 6. Set up the PCR run according to the machine’s user manual. Be sure to input the copy number when setting up the PCR standards (using the standard curve method). 7. Start the PCR reaction. 8. Analyze the data according to the machine’s user manual. Calculation of the copy number of your gene of interest 1. If the cDNA templates in your samples are single-stranded such as cDNA from RT reactions, the actual copy number of your gene of interest is two times the number you got by comparing to the qPCR standards. For example, if the copy number of your gene is 5 copy/μl from the standard curve of a qPCR program, the actual number is 10 copy/μl. The reason is that the first cycle for a single-stranded sample is to make the complementary strand; therefore, there is one cycle delay in the PCR reaction compared to the double-stranded cDNA template standard’s reaction. 2. If the templates in your samples are double-stranded, the copy number of your gene of interest is the same as that calculated according to the qPCR standards. -9- Figure 4: Sample data (SYBR Green I Real -Time PCR on ABI9700HT) qPCR Template Standard and primer pair for NM_004808, Human N-myristoyltransferase 2 (NMT2) Real time PCR data were obtained by using serial dilutions of a PCR standard for NM_004808 as the template with specific primers. The PCR was performed on the ABI 7900HT utilizing the SYBR method. The plot of ct vs. cycle number for qPCR Template Standard is shown on the left (with copy numbers from 10,000,000 to 10 per μl) and the concentration dilution plot is shown on the right. An unknown sample (breast cancer tissue cDNA) is detected to contain approximately 37 copies/ μl of NMT2 based on the standard curve results. Trouble-shooting Guide No qPCR product detected 1. A qPCR component may have been omitted in the reaction. Be sure to use a checklist when assembling the reaction mix. 2. Make sure the master mix is working by using a positive template control. 3. The sample used may have very limited qPCR template. Add more sample or prepare efficient templates by using a better reverse transcriptase. The standard curve generated is not linear The dilution of the Template Standard may have been done incorrectly. Use an accurate pipette and mix each dilution sample thoroughly. A Ct value is out of the range of the standard curve If the Ct reading for an unknown sample is too small (high abundance of a template), dilute the sample further. If the Ct is too high (low abundance of a template), then dilute the template standard further or use more unknown sample. Frequently Asked Questions Q: What are qSTAR qPCR Primer Pairs and panels? A: qSTAR qPCR Primer Pairs are pre-designed, qPCR tested and ready-to-use primer sets for SYBR Green based qPCR experiments. The primer pairs are also available in a 96-well panel format covering broad range of pathways for cancer biomarker profiling. - 10 - Q: Can qSTAR qPCR Primer Pairs be used in probe-based qPCR? A: No. This kit has not been designed to accommodate any commercial probe based qPCR. Q: What is the Tm of the primer and what is a typical size of the amplicon? A: The Tm of a qSTAR qPCR Primer is around 60, and the amplicon is around 95 to 140 bp. Q: Does a qSTAR qPCR Primer Pair amplify an exon junction in a cDNA target? A: Whenever possible, an amplicon by a qSTAR qPCR Primer Pair covers exon junction or junctions. Q: My qPCR machine is not on the list of compatible machines on the website. Do you provide qPCR primer panels in plates compatible with other machines? A: Yes, we can provide our primer panels in other plates within approximately one week of receiving the custom order. Please email the catalog numbers of the qPCR primer panels needed plus the catalog number and manufacturer of the plates to [email protected]. Our technical support scientists will prepare a custom quote that can be used to order custom panels. Q: If I provide a list of genes I want to assay, can OriGene prepare a custom qPCR primer panel? A: Yes, OriGene can design a custom qPCR primer panel. Custom panels are offered for human and mouse genes in the 200 reaction-format for purchase, delivered in 2-D bar code matrix tubes. Q: Where can I find the sequence of the primers in each panel? A: Each panel is delivered with a USB drive that contains a spreadsheet of primer sequences and locations. Q: How much primer pair is in each well? A: Each well in 200 reactions format contains 2 nmol of lyophilized primer pair. Please re-dissolve in 200ul of water so the final concentration is 10uM. Each well in the PCR plate contains 10pmol of primer pairs. The primers will be re-suspended once the PCR reagents are added to the plate. Q: What is a qPCR template standard? A: A gene specific qPCR template standard is a tube of linear DNA made from a full-length cDNA plasmid. The copy number of a template standard solution is determined by the PicoGreen method and calculation based on MW. Q: Can a template standard be used in a probe-based qPCR? A: Yes, as long as a corresponding probe is used. Q: In your protocol, it is recommended to make six serial dilutions with one log of difference, can I make more dilutions and with different dilution scheme? A: Yes, as long as it is diluted in the qPCR detection range and each dilution is mixed thoroughly. Q: Can I use my own buffer to dilute the template standard instead of the buffer in the kit? A: Yes, as long as the buffer has no negative effects on qPCR. Q: Does OriGene offer custom-made template standards? A: Yes. Please contact our Tech Support at [email protected] Q: What is the OriGene guarantee on qPCR primers and template standards? A: OriGene qPCR primers and templates are warranted for SYBR Green qPCR experiments. If your experimental results are not satisfactory, our scientists will work with you to pinpoint the problem and, if it is determined that our products are at fault, OriGene will refund your money in the form of a credit. Q: How should I calculate the copy number of my gene of interest? A: If the cDNA templates in your samples are single-stranded such as cDNA from RT reactions, the actual copy number of your gene of interest is two times the number you got by comparing to the qPCR standards. For example, if the copy number of your gene is 5 copy/µl from the standard curve of a qPCR program, the actual number is 10 copy/µl. The reason is that the first cycle for a single-stranded sample is - 11 - to make the complementary strand; therefore, there is one cycle delay in the PCR reaction compared to the double-stranded cDNA template standard’s reaction. If the templates in your samples are double-stranded, the copy number of your gene of interest is the same as that calculated according to the qPCR standards. Q: I am writing a paper for publication and need to describe this product. How should I cite? A: We recommend that you refer to the product by its specific catalog number and refer to us as OriGene Technologies (Rockville, MD). Furthermore, we'd love to hear from you when your paper is published. Inform us and we will send a gift. - 12 -