1
Aalborg University Copenhagen
Semester: MED 10
Title: Breath Pacing by Auditory and Visual Cues
Project Period: Spring 2014
Aalborg University Copenhagen
Frederikskaj 12,
DK-2450 Copenhagen SV,
Denmark
Semester Coordinator:
Secretary:
Semester Theme:
Master thesis
Abstract:
Supervisor(s):
Stefania Serafin
Project group no.:
Members:
Christian Toft
____________________________
This study investigates different modalities for
breath pacing (guided breathing) and their effect on
heart rate variability (HRV).
Two tests have been performed. In test 1, the breath
pacers were auditory, audio-visual, and visual. In
test 2, the breath pacers were all auditory and
consisted of a continuous accordion-like sound, a
continuous sound of ocean waves, and a discrete
ping-pong type of sound.
A significant result was found in test 1, for the effect
of breath pacer type on mean heart rate, where the
audio-visual pacer resulted in a higher mean heart
rate than the visual pacer. The result should be
approached with caution, as the cause is unclear and
should be investigated further.
In test 2, a significant result was found for the effect
of breath pacer type on peak heart rate, where the
ping-pong sound resulted in a lower peak heart rate
than the waves and accordion. Again, the cause for
the result is unclear, and should be investigated
further.
Copies: 3
Pages: 60
Finished: August 7th, 2014
The waves sound was found to be significantly more
pleasant to listen to than the other two sounds, and
the waves sound was found to be significantly easier
to follow than the ping-pong sound.
Copyright © This report and/or appended material may not be partly or completely published or copied without prior
written approval from the authors. Neither may the contents be used for commercial purposes without this written
approval.
Breath Pacing
by Auditory and Visual Cues
Christian Toft
August 7, 2014
Contents
1 Introduction
2
2 Pre-analysis
2.1 State of the Art . . . . . . . . . . . .
2.1.1 Inner Balance by HeartMath
2.1.2 MyCalmBeat . . . . . . . . .
2.1.3 CardioSense Trainer . . . . .
2.1.4 The Dash . . . . . . . . . . .
2.2 Discussion . . . . . . . . . . . . . . .
2.2.1 Problem statement . . . . . .
.
.
.
.
.
.
.
3
3
4
4
5
6
6
7
.
.
.
.
.
.
.
8
8
8
9
10
10
10
11
.
.
.
.
.
.
.
.
.
.
.
.
.
13
13
14
14
15
16
17
17
17
18
18
19
20
21
5 Testing – Test 1
5.1 Questionnaire . . . . . . . . . . . . . . . . . . . . . . . . . . . . . . . . . . . . . .
5.2 Test setup . . . . . . . . . . . . . . . . . . . . . . . . . . . . . . . . . . . . . . . .
23
23
23
.
.
.
.
.
.
.
.
.
.
.
.
.
.
.
.
.
.
.
.
.
3 Analysis
3.1 Measuring Heart Rate . . . . . . . . . . .
3.1.1 Artefacts in ECG and PPG signals
3.2 Heart Rate Variability . . . . . . . . . . .
3.2.1 Analysis of HRV . . . . . . . . . .
3.2.2 Respiratory Sinus Arrhythmia . .
3.2.3 Resonant Breathing Frequency . .
3.3 Breath Pacing . . . . . . . . . . . . . . . .
4 Design and Implementation – Test 1
4.1 Breath pacing cycle . . . . . . . . . .
4.1.1 Visual breath pacing . . . . .
4.1.2 Auditory breath pacing . . .
4.1.3 Audio-visual breath pacing .
4.2 Gapless audio playback . . . . . . .
4.3 Pauses between breath pacing . . . .
4.4 Demo mode and Test mode . . . . .
4.5 Randomization of test sequence . . .
4.6 Sensors . . . . . . . . . . . . . . . .
4.6.1 Pulse sensor . . . . . . . . . .
4.6.2 Respiration sensor . . . . . .
4.7 Data acquisition . . . . . . . . . . .
4.8 Monitoring of sensor signals . . . . .
.
.
.
.
.
.
.
.
.
.
.
.
.
.
.
.
.
.
.
.
.
.
.
.
.
.
.
.
.
.
.
.
.
.
.
.
.
.
.
.
.
.
.
.
.
.
.
.
.
.
.
.
.
.
.
.
.
.
.
.
.
.
.
.
.
.
.
.
.
.
.
.
.
.
.
.
.
.
.
.
.
.
.
.
.
.
.
.
.
.
.
.
.
.
.
.
.
.
.
.
.
.
.
.
.
.
.
.
.
.
.
.
.
.
.
.
.
.
.
.
.
.
.
.
.
.
.
.
.
.
.
.
.
.
.
.
.
.
.
.
.
.
.
.
.
.
.
.
.
.
.
.
.
.
.
.
.
.
.
.
.
.
.
.
.
.
.
.
.
.
.
.
.
.
.
.
.
.
.
.
.
.
.
.
.
.
.
.
.
.
.
.
.
.
.
.
.
.
.
.
.
.
.
.
.
.
.
.
.
.
.
.
.
.
.
.
.
.
.
.
.
.
.
.
.
.
.
.
.
.
.
.
.
.
.
.
.
.
.
.
.
.
.
.
.
.
.
.
.
.
.
.
.
.
.
.
.
.
.
.
.
.
.
.
.
.
.
.
.
.
.
.
.
.
.
.
.
.
.
.
.
.
.
.
.
.
.
.
.
.
.
.
.
.
.
.
.
.
.
.
.
.
.
.
.
.
.
.
.
.
.
.
.
.
.
.
.
.
.
.
.
.
.
.
.
.
.
.
.
.
.
.
.
.
.
.
.
.
.
.
.
.
.
.
.
.
.
.
.
.
.
.
.
.
.
.
.
.
.
.
.
.
.
.
.
.
.
.
.
.
.
.
.
.
.
.
.
.
.
.
.
.
.
.
.
.
.
.
.
.
.
.
.
.
.
.
.
.
.
.
.
.
.
.
.
.
.
.
.
.
.
.
.
.
.
.
.
.
.
.
.
.
.
.
.
.
.
.
.
.
.
.
.
.
.
.
.
.
.
.
.
.
.
.
.
.
.
.
.
.
.
.
.
.
.
.
.
.
.
.
.
.
.
.
.
.
.
.
.
.
.
.
.
.
.
.
.
.
.
.
.
.
.
.
.
.
.
.
.
.
.
.
.
.
.
.
.
.
.
.
.
.
.
.
.
.
.
.
.
.
.
.
.
.
.
.
.
.
.
.
.
.
.
.
.
.
.
.
.
.
.
.
.
.
.
.
.
.
.
.
.
.
.
.
.
.
.
.
.
.
.
.
.
.
.
.
.
.
.
.
.
.
.
.
.
.
.
.
.
.
.
.
.
.
.
.
.
.
.
.
.
.
.
.
.
.
.
.
.
.
.
.
.
.
.
.
.
.
.
.
.
.
.
.
.
.
5.3
Test procedure . . . . . . . . . . . . . . . . . . . . . . . . . . . . . . . . . . . . .
24
6 Processing of Sensor Data
26
7 Results – Test 1
7.0.1 Questionnaire responses . . . . . . . . . . . . . . . . . . . . . . . . . . . .
7.0.2 Remarks . . . . . . . . . . . . . . . . . . . . . . . . . . . . . . . . . . . . .
28
30
31
8 Design and Implementation – Test 2
8.1 Continuous audio: Waves . . . . . . . . . . . . . . . . . . . . . . . . . . . . . . .
8.2 Discrete audio: PingPong . . . . . . . . . . . . . . . . . . . . . . . . . . . . . . .
8.3 Demo mode and Test mode . . . . . . . . . . . . . . . . . . . . . . . . . . . . . .
33
33
35
36
9 Testing – Test 2
9.1 Questionnaire . . . . . . . . . . . . . . . . . . . . . . . . . . . . . . . . . . . . . .
9.2 Test procedure . . . . . . . . . . . . . . . . . . . . . . . . . . . . . . . . . . . . .
37
37
38
10 Results – Test 2
10.0.1 Questionnaire responses . . . . . . . . . . . . . . . . . . . . . . . . . . . .
40
42
11 Discussion
11.1 Discussion of test 1 . . . . . . . . . . . . . . . . . . . . . . . . . . . . . . . . . . .
11.2 Discussion of test 2 . . . . . . . . . . . . . . . . . . . . . . . . . . . . . . . . . . .
11.3 General discussion . . . . . . . . . . . . . . . . . . . . . . . . . . . . . . . . . . .
46
46
46
47
12 Conclusion
48
13 Bibliography
49
14 Appendices
14.1 Appendix
14.2 Appendix
14.3 Appendix
14.4 Appendix
51
51
52
53
57
A
B
C
D
.
.
.
.
.
.
.
.
.
.
.
.
.
.
.
.
.
.
.
.
.
.
.
.
.
.
.
.
.
.
.
.
.
.
.
.
.
.
.
.
.
.
.
.
.
.
.
.
.
.
.
.
.
.
.
.
.
.
.
.
.
.
.
.
iii
.
.
.
.
.
.
.
.
.
.
.
.
.
.
.
.
.
.
.
.
.
.
.
.
.
.
.
.
.
.
.
.
.
.
.
.
.
.
.
.
.
.
.
.
.
.
.
.
.
.
.
.
.
.
.
.
.
.
.
.
.
.
.
.
.
.
.
.
.
.
.
.
.
.
.
.
.
.
.
.
.
.
.
.
.
.
.
.
.
.
.
.
Preface
A CD is included with this report. It contains a copy of the software that has been
constructed as part of the project. A digital version of this report and the raw test data
from each test conducted throughout the project is also included on the CD.
I would like to thank Stefania Serafin for supervision. Thanks also goes to Niels Christian
Nilsson and Thomas Saaby Noer for inspiration and conversation on the subject matter.
1 Introduction
The human heart beats approximately 100,000 times each day [1]. When looking closer
at the heart’s activity, it is noticed that the time between beats vary, from one beat
to the next. This variability is influenced by many factors. One of them being our
breathing, which, especially at slow rates, can contribute to a significant amount of heart
rate variability, occuring at the same frequency as our breathing [2].
The study at hand, will center around what is called "breath pacing"—a way of guiding a
person’s breathing to maintain a certain breathing frequency, and obtain a high amplitude
of heart rate variability while following the breath pacing.
2 Pre-analysis
When consulting a physician and having ones pulse checked, it is common to be informed
about ones heart rate by a single number. This is an average, often found by feeling the
pulse beats from an artery near the skin and counting beats within e.g. 15 seconds,
and then multiplying that count to arrive at a number of beats per minute (bpm) [1].
However, the time interval between beats varies from beat to beat, and these consecutive
variations are termed heart rate variability (HRV).
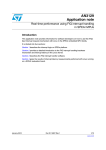
Figure 2.1 – Illustration of an electrocardiogram, displaying the electrical heart signal. Signal peaks
indicate heart beats. The time interval between heart beats vary from beat to beat. Image from [1]
In recent years there has been a great deal of interest in HRV biofeedback, which involves
guiding the user to breathe at slower than normal rates, in order to maximize the amplitude of HRV. Clinical research in HRV biofeedback has shown to ameliorate a number
of disorders such as anxiety, depression, asthma, and more, although further research
is called for [3, 4]. The existing research seems to have also led to a number of HRV
biofeedback products being made for the consumer market, as will be discussed next.
2.1 State of the Art
This section will take a look at some of the HRV biofeedback products commercially
available today. At the end of this section a product will be presented, that is not
currently available as a HRV biofeedback device but has potential for such an application.
2. Pre-analysis
2.1. State of the Art
2.1.1 Inner Balance by HeartMath
HeartMath1 offers a number of products based on breath pacing and heart rate variability,
and markets them as improving wellness and reducing stress. One such product, the Inner
Balance for iOS, consists of a photoplethysmographic pulse sensor that can be clipped
onto an earlobe, and software for iOS devices (Apple iPhone, iPad, iPod).
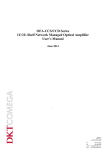
(a) Inner Balance app and
pulse sensor for iPhone. Image
from http://succeeder.se
(b) Screen image from the app.
The centre figure contracts and
expands to guide breathing. Image from [5]
(c) Screen image, showing frequency analysis of heart rate variability (bar chart), and pulse signal. Image from [5]
Figure 2.2 – Inner Balance for iOS, from HeartMath.
The application offers 3 different visual breath pacers, but the manual (available online)
does not mention breath pacing based on audio [5]. The user can keep logs of training
sessions and receive a so-called coherence score, based on frequency analysis of his/her
HRV.
2.1.2 MyCalmBeat
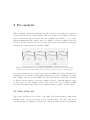
Similar to the HeartMath product, MyCalmBeat from MyBrainSolutions2 is also marketed as a stress reduction tool. It is based on an ear clip sensor to track the user’s pulse,
and breath pacing to maximize HRV. It appears to differ somewhat from the HeartMath product by first guiding the user through an optimization process, where the user’s
"[...]personal best breathing rate" [6] is found. The application offers a visual breathing
guide, shown as an illustration of lungs being filled or emptied, but the product webpage
does not make it clear whether a form of auditory breathing guide is also included.
1
2
http://www.heartmath.com/
https://www.mybrainsolutions.com/mycalmbeat
4
2. Pre-analysis
2.1. State of the Art
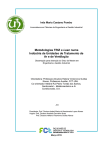
Figure 2.3 – MyCalmBeat product suite. Image from https://www.mybrainsolutions.com
2.1.3 CardioSense Trainer
The CardioSense Trainer from Complete Coherence3 is yet another example of a commercial product based on breath pacing and HRV, again with an ear clip pulse sensor.
The application has options for both visual and/or auditory breath pacing.
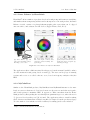
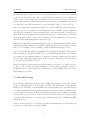
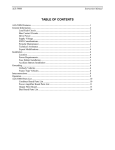
Figure 2.4 – A screen capture from the CardioSense Trainer software. The breath pacer is the
vertical column on the left side. The upper horizontal graph window displays heart rate over
time. The lower horizontal window displays a so-called coherence score. Image from video at
http://www.youtube.com/watch?v=orKZ_nJZTfs
The visual breath pacer is a vertical column, resembling bellows or a progress bar. The
auditory pacer is based on MIDI (Musical Instrument Digital Interface) instruments
already installed with the PC’s operating system. The default sound is a mix of accordion
and organ sounds, that rise in pitch to indicate inhalation, hold pitch to indicate breath
3
http://www.complete-coherence.com/technology/
5
2. Pre-analysis
2.2. Discussion
hold, and fall in pitch to indicate exhalation. It is possible to select other MIDI based
instruments to be used for breath pacing.
2.1.4 The Dash
Although not currently a product marketed along the lines of those mentioned above, the
Dash is of interest because of its potential for a breath pacing and heart rate variability
related application.
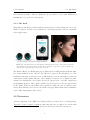
(a) The Dash in-ear headphones next to an iPhone.
(b) The Dash in use.
Figure 2.5 – The Dash wireless in-ear headphones with built-in pulse sensor. The product was funded
via a Kickstarter campaign by Bragi. At the time of writing, it is expected to go into production by
January 2015. Images from http://www.bragi.com/press
The Dash by Bragi, is a Kickstarter project that was successfully funded in March 2014.
It is being marketed as the "World’s First Wireless Smart In Ear Headphones".4 The
headphones integrate a microprocessor, 4 GB memory, ear bone microphone, bluetooth
connectivity, touch sensitive interface, and a number of sensors, one of which is a pulse
oximeter for tracking the user’s pulse and blood oxygen levels. An API (application
programming interface) will be made available for developers to create new applications
for the Dash. Whereas other HRV related products require the user to attach a pulse
sensor, that otherwise serves no use, the Dash seems appealing in that it has a multitude
of uses while integrating a pulse sensor.
2.2 Discussion
A main component of the HRV biofeedback products reviewed above is breath pacing.
Typically a form of visual or auditory guide that the user is supposed to follow with
4
https://www.kickstarter.com/projects/hellobragi/the-dash-wireless-smart-in-ear-headphones
6
2. Pre-analysis
2.2. Discussion
his/her respiratory cycle.
An interesting aspect about the Dash in-ear headphones, is that they can function in
combination with a smartphone’s visual display, and potentially as stand-alone and audioonly devices for breath pacing (and HRV biofeedback, if desired).
Some questions that arise here is, does visual and auditory breath pacing yield the same
results in HRV? What kind of audio would users prefer for breath pacing, and will
different kinds of auditory breath pacing result in differences in HRV? For example, the
accordion-like sound used in the CardioSense Trainer (subsection 2.1.3 on page 5) is a
continuous type of audio—there are no silent gaps. But would a discrete type of audio,
e.g. a short "ping" to indicate beginning inhalation and exhalation, and no sound in
between to indicate the level of progression, yield the same results in terms of HRV and
user preference? Preliminary review on the subject of breath pacing in HRV biofeedback
scenarios, has indicated that the suggested respiratory cycle is far slower than what is
common for healthy adult humans. Thus, continuous audio designed to indicate the level
of progression may yield different results than discrete sounds, indicating only beginning
and end of respiratory stages.
2.2.1 Problem statement
In regards to the questions in the discussion above, the following problem statements are
formed:
• Is there a difference in HRV, between using auditory, audio-visual, and visual breath
pacing?
• Is there a difference in HRV, between using continuous and discrete audio for breath
pacing?
7
3 Analysis
3.1 Measuring Heart Rate
Accurate detection of heart beats can be done with electrocardiography (ECG), which
measures the electrical signal that occurs from contraction of the heart muscles at every
heart beat. This can be measured by placing electrodes on the skin near the heart, for
the most accurate reading [7, 8]. ECG is considered the gold standard for measuring
heart rate in clinical research, but another method, photoplethysmography (PPG), is
also widely used today [7, 9]. PPG involves using a light emitting diode to shine infrared
light into the skin, and a photodetector to sense the variations in how much of the light is
reflected or transmitted. These variations are caused by the volume of blood circulating
through the blood vessels. Typical placement of a PPG sensor is at a fingertip or an
earlobe.
Studies have been made in regards to whether HRV analysis from PPG signals is comparable with that from ECG signals. It has been found that PPG can be considered "[...]
sufficiently accurate only for healthy (and mostly younger) subjects at rest" [9]. One of
the sources for discrepancies between results obtained by PPG and ECG could be pulse
transit time—the time it takes from the actual heart beat until the blood pressure wave
is seen in the blood vessels. Pulse transit time depends on age, blood pressure, stiffness
of the arteries, and is also affected by respiratory activity [9].
In terms of sampling frequency it is recommended to work with 250–500 Hz for accurate
peak detection in an ECG signal, although a sampling rate as low as 100 Hz may be
satisfactory if parabolic interpolation is used to refine signal peaks [10].
3.1.1 Artefacts in ECG and PPG signals
ECG electrodes are typically placed on the chest, but a less intrusive option is on the arms
or wrists [7]. These more peripheral placements however, increases interference with the
ECG signal caused by electrical activity from muscle tissue other than the heart. Such
interference can also occur when electrodes are placed on the chest or lower rib area, but
is minimized by placement closer to the heart.
3. Analysis
3.2. Heart Rate Variability
ECG and PPG signals can exhibit interference from the 50 Hz AC power that supplies
computers, monitors, and other equipment in the room. This interference may affect PPG
signals less, since the sensor signal is based on light, although potentially the connected
sensor circuitry could be affected. Filtering the signal with a 50 Hz notch filter can reduce
this artefact.
Movement artefacts is also a concern, for both ECG and PPG. If the wires attached
to the ECG electrodes are being pulled at, contact between skin and electrode may be
momentarily disrupted and cause distortions in the signal, which then may be processed
as an extra beat, or the lack of one. For PPG, movement of the sensor is the main cause
for distortion of the signal [7].
3.2 Heart Rate Variability
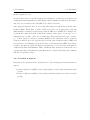
In the heart there is a group of cells called the sinoatrial node (see figure 3.1), that generates electrical signals, causing the contractions of heart tissue known as heart beats. The
frequency which these signals are generated by, is regulated via the autonomic nervous
system (ANS), where the sympathetic branch of the ANS is responsible for increasing
heart rate and the parasympathetic branch (via the vagus nerve) is responsible for decreasing heart rate [11–13].
The mechanisms by which the sympathetic and parasympathetic nervous systems influence heart rate differ, both chemically and in terms of the time it takes for their effect
to peak. The effect coming from a regulation by the sympathetic branch peaks after
approximately 4 seconds and returns to baseline level after approx. 20 seconds. From
the parasympathetic branch, the effect peaks after about half a second and goes back to
baseline after approximately 1 second [12].
Figure 3.1 – Illustration of the heart, showing the location of the sinoatrial node. Image from [7].
9
3. Analysis
3.2. Heart Rate Variability
3.2.1 Analysis of HRV
The aforementioned difference in modulation speed, is the basis for applying one of the
common methods for statistical analysis of HRV—power spectral density (PSD), which
quantifies the amount of variance within a range of frequencies. By convention, the HRV
power spectrum is divided into four frequency bands: ultra low frequency (ULF, ≤0.003
Hz), very low frequency (VLF, 0.003–0.04 Hz), low frequency (LF, 0.04–0.15 Hz), and
high frequency (HF, 0.15–0.4 Hz). For short-term recordings (less than 5 minutes) the
ULF band is not considered and VLF is defined as ≤0.04 Hz. It is recommended that
recordings have a duration of at least 10 times the period of the lowest frequency in the
range being investigated [10].
When performing spectral analysis of HRV, it must be considered that although the initial
ECG or PPG signal may have been sampled with a fixed sampling rate, e.g. 100 Hz, the
time series of interbeat intervals (IBI’s), extracted from the ECG or PPG samples, will
not be fixed-interval data. Spectral analysis via a fast Fourier transform (FFT) assumes
evenly spaced samples, and so applying FFT directly on the IBI time series will lead to
incorrect estimations. A resampling of the times series to obtain a new, evenly spaced
dataset, can also lead to an incorrect estimation of the actual frequency spectrum. For
a more accurate spectral estimation of HRV the Lomb-Scargle periodogram method is
recommended, as it does not assume evenly spaced samples and allows analysis directly
on the IBI timeseries [14, 15].
3.2.2 Respiratory Sinus Arrhythmia
Respiratory sinus arrhythmia (RSA) is a component of HRV, seen as a variation in heart
rate that coincides with a person’s frequency of respiration. When breathing air into the
lungs, the parasympathetic nervous system’s influence on heart rate is reduced, resulting
in an increase of heart rate. When breathing air out of the lungs, the parasympathetic
influence is reinstated and heart rate decreases [12].
For adults, normal respiratory rates are in the range of 12–20 breaths per minute. This
translates to 0.2–0.333 Hz in the HRV frequency spectrum, thus normally placing RSA
in the HF band [2, 16].
3.2.3 Resonant Breathing Frequency
At respiratory frequencies that are slower than the normal adult rate, other mechanisms
add to the effect seen in HRV. In the low frequency (LF) range, the relatively slow
influence on heart rate coming from the sympathetic nervous system, plays a role. Also,
10
3. Analysis
3.3. Breath Pacing
the baroreflex system, which is part of a system that regulates blood pressure, is thought
to play a role in the LF range. The response from the baroreflex system originates in
baroreceptors—sensors that react to stretching of blood vessels caused by increased blood
pressure, which in turn resulted from an increase in heart rate. In summary, an increased
blood pressure causes the baroreflex to decrease heart rate, and vice versa. [16, 17].
It has been found that at respiratory frequencies around 0.1 Hz (6 breaths per minute),
there appears to be a resonance between different sources of HRV, and the amplitude
of heart rate oscillations become particularly high. It is theorized that a beneficial side
effect of the increased amplitude of oscillations in heart rate—causing greater oscillations
in blood pressure as well—exercises the baroreflexes more and ultimately leads to greater
efficiency in modulating autonomic activity [17, 18].
Studies have found that each individual has a specific resonant breathing frequency, which
maximizes the HRV amplitude. Resonant breathing frequencies were found to be in the
range of 4–7 breathing cycles per minute, among healthy individuals [2, 17, 18].
Some researchers mention that for optimum effect, breathing out should be slightly slower
than breathing in. Breathing should also be abdominal rather than thoracic, meaning
one should use the diaphragm muscles so that the abdomen expands and air is pulled
into the lungs, rather than using muscles in the chest area. It should be a relaxed effort,
to not cause hyperventilation [4, 17].
In the CardioSense Trainer application from Complete Coherence (see subsection 2.1.3
on page 5), the default 10-second breathing cycle (6 breaths per minute) consists of
breathing in for 3 seconds, holding ones breath for 1 second, breathing out for 4 seconds,
and holding for 2 seconds.
3.3 Breath Pacing
In research and commercial products related to HRV and respiration, some form of breath
pacing (breathing guidance) is used in order to achieve and maintain the desired rhythm.
In the reviewed literature concerning HRV biofeedback training, there is briefly mention
of a rising and falling bar on a computer monitor, as a visual example of breath pacing,
or a tone that rises and falls in pitch, as an auditory example. After a number of training
sessions using a pacer bar, the client is at some point encouraged to use the display
of his/her own heart rate as a pacing guide, again with the aim of maximizing HRV
amplitude [4, 17].
However, there appears to be very little research investigating any use of different types
of auditory breath pacing, in relation to HRV.
11
3. Analysis
3.3. Breath Pacing
A paper from Philips Research explores a system concept for a multimodal breathing
guidance system, intended to help a user relax [19]. The breathing guidance consists
of a vibrotactile blanket, modulated room lighting, and the sound of ocean waves on
a shore. These three guidance modalities acted in unison, either reflecting the user’s
own breathing or controlled to guide the user to a certain breathing rate. The audio is
rendered in software by mixing sound recordings of approaching and retreating waves,
in order to adjust to the user’s breathing or create the desired cycle length. (Personal
correspondence from one of the authors is included in Appendix D on page 57.) The
authors do set out to track HRV, but do not report the results, due to discovering
inaccuracies in their real-time detection of HRV amplitude.
12
4 Design and Implementation – Test 1
The first test was designed to investigate whether a difference in HRV exists, between
three modalities of breath pacing: audio, audio-visual, and visual.
This chapter will describe the design and implementation of the software application
that was created to perform the test. The test application was programmed using Matlab R2014a1 . The complete code listing is approximately 1000 lines and only snippets
will be shown in the following sections. For the complete code, please refer to the file
BreathPacerTest_1.m on the CD included with this report.
4.1 Breath pacing cycle
For this test, it was decided to not include a precursory test to find each participant’s
resonant breathing frequency. A fixed pacing cycle of 6 breaths per minute (bpm) was
implemented for all modalities in the test.
As mentioned in the Analysis, there seems to be slightly differing approaches to the breath
pacing applied by various commercial products; mainly whether the user is instructed to
briefly hold his/her breath between inhalation and exhalation. For this test, the choice
was made to adopt the default cycle found in the CardioSense Trainer application by
Complete Coherence. A 10 second breathing cycle, equalling 6 bpm, has the following
structure:
• 3 seconds inhalation
• 1 second hold
• 4 seconds exhalation
• 2 seconds hold
1
http://www.mathworks.se/products/matlab/
4. Design and Implementation – Test 1
4.1. Breath pacing cycle
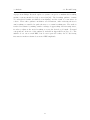
4.1.1 Visual breath pacing
The visual breath pacer was made as a vertical progress bar, centered on the screen (see
figure 4.1). The test participant would be instructed to inhale as the progress bar fills
up, exhale as the progress bar goes down, and holding his breath while the bar holds at
the top or bottom.
Figure 4.1 – The visual pacer as implemented in the BreathPacer test application.
4.1.2 Auditory breath pacing
There would be virtually countless options for designing auditory stimulus for breath
pacing, as long as the stimulus provides the user with an indication of the intended timing
in the respiratory cycle. For this test, the choice was made to use the same audio that
occurs as the default option in the CardioSense Trainer application (see CardioSense
Trainer on page 5). The audio in the CardioSense Trainer application is created by
using standard Windows MIDI sounds, and it is possible, to some degree, to select your
own pacer audio by choosing from a list of MIDI sounds. The default pacer audio is
composed of four MIDI instruments named TangoAccordian, Accordian, Harmonica, and
Reed Organ. For the purpose of this test, the CardioSense Trainer pacer audio was
captured by using Camtasia2 and exporting the audio as a WAV file. The audio was
then cropped, using Audacity3 , to represent the complete 10 second breath pacing cycle.
Furthermore, the audio was converted to mono, since no stereo effects appeared in the
original audio. Henceforth, this audio clip will simply be referred to as the Accordion
sound. See figure 4.2 for an image of the 10 second waveform. The sound file is available
on the CD included with this report.
2
3
Camtasia is a screen recording software by TechSmith. See http://www.techsmith.com/camtasia.html
Audacity is open source audio editing software. See: http://audacity.sourceforge.net/
14
4. Design and Implementation – Test 1
4.1. Breath pacing cycle
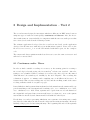
Figure 4.2 – Waveform of the Accordion sound file, with a length of 10 seconds. From left to right,
the red arrows mark positions of 3 seconds, 4 seconds, and 8 seconds respectively.
For the phase of the test that applied the auditory breath pacing, a speaker icon was
displayed on screen, as an indication of this being an audio-only mode (figure 4.3).
Figure 4.3 – Only a speaker icon was displayed on screen, while the audio-only breath pacer was
active.
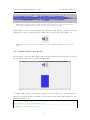
4.1.3 Audio-visual breath pacing
For the phase of the test that applied audio-visual breath pacing, the progress bar and
the Accordion sound was presented simultaneously.
Figure 4.4 – The screen of the test application, while audio-visual breath pacing was active.
To ensure that pacing cues from the progress bar and audio were synchronised, the
progress bar would update according to the progress of the audio, implemented by the
following Matlab code:
% currently played sample, time in seconds
avPacerTime = player.CurrentSample / Fs;
% modulus 10, gets our current location within the 10 sec pacer cycle
modAvPacer = mod(avPacerTime,10);
15
4. Design and Implementation – Test 1
4.3. Gapless audio playback
% if within first 3 sec
if modAvPacer < 3
% set bar height, units are relative within the bar frame
barHeight = modAvPacer / 3.0;
set(hPanelBPbarAV,’Position’,[0 0 1 (barHeight+0.001)]);
% if within 3 to 4 sec
elseif modAvPacer >= 3 && modAvPacer <= 4
% set bar at max height ( = 1 )
set(hPanelBPbarAV,’Position’,[0 0 1 1]);
% if within 4 to 8 sec
elseif modAvPacer > 4 && modAvPacer < 8
% set bar height
barHeight = 1 - ((modAvPacer - 4) / 4.0);
set(hPanelBPbarAV,’Position’,[0 0 1 (barHeight+0.001)]);
% if greater than 8 sec
elseif modAvPacer >= 8
% set bar at min height ( = 0.001 since 0 is not allowed )
set(hPanelBPbarAV,’Position’,[0 0 1 0.001]);
end
4.2 Gapless audio playback
It was found that in order to achieve looped playback of the 10 second audio file, without
any gaps between repeats, it was necessary to preload the audio and build an array containing the required duration of looped audio. This was implemented with the following
Matlab code.
info = audioinfo(’audio/Accordion.wav’);
% loading audio. Fs is sample rate.
[a,Fs] = audioread(’audio/Accordion.wav’);
% preallocate array for repeating the audio
audioLoopedLength = Fs * max(pacerDurationDemo,pacerDurationTest);
audioLooped(audioLoopedLength,1) = 0;
integerRepeats = floor(audioLoopedLength/info.TotalSamples);
remainderSamples = mod(audioLoopedLength,info.TotalSamples);
% fill the array with repetitions of the audiosample
for ia=1:integerRepeats
arrayIdx = ((ia-1)*info.TotalSamples)+1;
audioLooped(arrayIdx:(info.TotalSamples*ia),1) = a;
end
if remainderSamples
audioLooped((integerRepeats*info.TotalSamples+1):(size(audioLooped,1)),1)
= a(1:remainderSamples,1);
end
player = audioplayer(audioLooped, Fs);
16
4. Design and Implementation – Test 1
4.5. Pauses between breath pacing
4.3 Pauses between breath pacing
To give participants a pause from breath pacing and return to a baseline HRV, a oneminute pause was given before starting each mode of breath pacing. The screen image
would display the text: "Relax and breathe normally. Breath pacing will begin in: a
little while...". However, five seconds before breath pacing would begin, the text "a little
while..." would be replaced by a countdown showing the number of seconds before pacing
began, so the participant could prepare to focus on the upcoming stimulus.
Figure 4.5 – The screen of the test application, while in the pause state. The last 5 seconds before
the pause would end, the text "a little while..." would be replaced by a countdown.
4.4 Demo mode and Test mode
The test application was programmed so that it could also run a demonstration of the
test cycle, helping to inform participants of the procedure. In the demo mode, pauses
were shortened to just a few seconds and each breath pacing mode was demonstrated
for 20 seconds (equalling 2 respiration cycles). In demo mode the sequence was fixed, so
the visual breath pacer would be presented first, then the audio-visual pacer, and finally
the audio pacer. This sequence allowed the experimenter to explain how the intended
inhale–hold–exhale–hold breathing cycle corresponded with the progress bar and the
audio.
4.5 Randomization of test sequence
The actual test sequence experienced by the participant, was randomized at the start of
the test. The Matlab code below shows the implementation (see figure 4.6 and 4.7).
17
4. Design and Implementation – Test 1
4.6. Sensors
% seed random number generator based on current time when application starts
rng(’shuffle’);
% matrix of all possible sequences, 1 = Audio, 2 = AudioVisual, 3 = Visual
sequences
= [1,2,3;
1,3,2;
2,3,1;
2,1,3;
3,2,1;
3,1,2];
% the default demo sequence. Actual test sequence is randomized
testSequence = sequences(5,:);
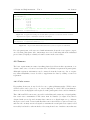
Figure 4.6 – At application startup, the random number generator is seeded based on date and time.
All possible test sequence combinations is held in a 6x3 matrix.
% For test mode, the sequence is randomly selected
testSequence = sequences(randi(6),:);
Figure 4.7 – As part of the function that starts the test, the test sequence is randomized.
For each participant, a file was saved with information about the test sequence experienced by that participant. Also, timestamps were saved, indicating when the individual
pacers started, helping to identify relevant sections in the sensor data.
4.6 Sensors
The basic requirements in terms of tracking physiological data in this experiment, is to
obtain a time series of beat-to-beat heart rates and monitor respiration in participants.
Although respiratory information can be extracted from the heart rate, due to respiratory sinus arrhythmia, it was decided to supplement the data by adding a sensor for
respiration.
4.6.1 Pulse sensor
For tracking heart rate it was decided to use a photoplethysmography (PPG) sensor.
A PPG sensor can be placed e.g. on a user’s fingertip or earlobe and is non-intrusive,
whereas electrocardiographic sensors placed on the participant’s chest could feel intrusive.
Three different PPG sensors were assessed for reliability and consistency of signal quality.
One sensor was a transmissive PPG sensor from Seeedstudio (see figure 4.8a) that is
designed with an ear clip and circuitry that connects to a digital input on e.g. Arduino
microprocessor boards. It was found that this sensor often failed to register a heart beat,
and since the circuitry was not designed to transmit the actual pulse wave signal, it did
not readily lend itself to other methods of detecting heart beats. Another sensor that was
18
4. Design and Implementation – Test 1
4.6. Sensors
considered, was the reflective PPG sensor (see figure 4.8b) designed by Joel Murphy and
Yury Gitman and originally brought to market via a Kickstarter4 campaign. It includes
options for placement on a finger or earlobe, but it was found that it required some effort
in order to achieve good signal strength, and it was prone to movement artefacts.
(a) Heart rate sensor from Seeedstudio.
(b) Pulse sensor by Joel Murphy
and Yury Gitman.
Figure 4.8 – Two pulse sensors that were assessed for use in the test, but discarded. Images from (a)
http://www.seeedstudio.com and (b) http://pulsesensor.myshopify.com.
The PPG sensor chosen for the test setup, was the EasyPulse v1.1 from Embedded
Lab5 . This transmissive PPG sensor comes with a flexible rubber sleeve that fits onto a
user’s fingertip. This device appeared slightly more tolerant to movement before showing
artefacts in the pulse wave signal, and overall signal strength was good. Furthermore,
the included circuitry was designed to allow adjustment of signal gain.
Figure 4.9 – The EasyPulse v1.1 sensor from Embedded Lab was chosen as the pulse sensor for the
test setup. Image from http://embedded-lab.com
4.6.2 Respiration sensor
It was considered to build a respiration sensor by using a stretch sensor; an elastic
material that changes resistivity according to the amount of stretching, which could be
4
5
https://www.kickstarter.com
http://embedded-lab.com
19
4. Design and Implementation – Test 1
4.7. Data acquisition
implemented in a belt around the chest or abdomen. However, due to time restrictions,
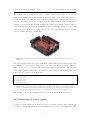
it was decided to use the e-Health Sensor Platform6 airflow sensor (see figure 4.10) to
detect breathing. The e-Health Sensor Platform is designed to be used in tandem with
e.g. an Arduino Uno microprocessor (see Data acquisition on page 20). The airflow
sensor is based on thermistors, which change resistivity when temperature changes, and
is designed to be placed under the user’s nose, where it reacts to the cooling airflow during
inhalation and warming during exhalation. A limitation in the way this particular sensor
is implemented however, is that only exhalation is indicated in the signal output by the
eHealth sensor circuitry—inhalation and holding one’s breath, are both returned as the
value zero, whereas exhalation results in positive values.
Figure 4.10 – eHealth airflow sensor connected to eHealth shield. Image from http://www.cookinghacks.com
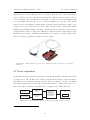
4.7 Data acquisition
An Arduino Uno microcontroller was used in combination with the e-Health sensor shield
(see figure 4.12). The Arduino Uno features both digital and analog connection inputs,
and functions as an analog-to-digital converter with a resolution of 10 bits. It samples
the voltage output from a sensor and converts that signal to a value in the range of 0 1023. The values can then be transmitted to a computer via a USB connection.
Airflow sensor
e-Health
sensor shield
circuitry
Pulse sensor
Pulse sensor
circuitry
(thermistors)
(IR LED + photodetector)
Arduino Uno
Data Acquisition
Hardware
(Analog to Digital
conversion)
PC
Matlab
Figure 4.11 – A functional block diagram of the pathways from the sensors to the PC.
6
http://www.cooking-hacks.com
20
4. Design and Implementation – Test 1
4.8. Monitoring of sensor signals
The Arduino was programmed to send a certain character (the letter ’a’) to the PC
when serial communication was initialized, and then wait for the same character to be
returned from the PC. This was done to make sure that serial communication had been
properly established, before proceeding to run the main function. The main function
consists of a loop where the Arduino samples the sensors and send the values to the PC
every 10 milliseconds, resulting in a sampling frequency of 100 Hz. In this loop, the serial
connection is also checked to see if the character ’b’ has been sent from the PC, in which
case the Arduino will stop sending data.
Figure 4.12 – The eHealth shield stacked on top of an Arduino Uno. Image from http://www.cookinghacks.com
The sensor sample values were sent, along with a timestamp given in milliseconds, from
the Arduino as a concatenated string where each value is prefixed by a single character,
either ’A’, ’B’, or ’C’, to easily identify and extract values on the PC side. The data was
saved to the computer’s hard drive in text files for later analysis. An example of the data
sent to the PC, can be seen in figure 4.13.
A1035319B797C330
A1035329B789C333
A1035340B779C329
A1035349B767C331
A1035359B752C328
Figure 4.13 – An example of the data sent from the Arduino to the PC. The timestamp is prefixed
by an ’A’ and indicates the number of milliseconds passed since the Arduino started sending sensor
data. The pulse wave signal is prefixed by a ’B’, and finally the respiration signal prefixed by a ’C’.
The complete code for the Arduino Uno can be seen in Appendix B on page 52.
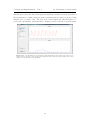
4.8 Monitoring of sensor signals
In order to ensure that sensors had been placed properly and the signal output was
acceptable, a monitoring function was programmed as part of the test application. This
21
4. Design and Implementation – Test 1
4.8. Monitoring of sensor signals
function plotted the pulse wave and respiration signals in real-time on screen, and allowed
the experimenter to adjust sensor placement or signal gain if necessary, before proceeding
with the test (see figure 4.14). The plot of the sensor signals was only intended to be
seen by the experimenter, and would not be displayed on-screen for the test participants.
Figure 4.14 – The BreathPacer test application while monitoring sensor signals. The pulse wave is
plotted in red in the upper plot window, and respiration in blue in the lower plot window. The sensor
signals were not shown to test participants.
22
5 Testing – Test 1
The purpose of test 1 was to investigate whether a difference in HRV exists between three
modalities of breath pacing: audio, audio-visual, and visual.
5.1 Questionnaire
As a supplement to the main data, the pulse wave signal, test participants would be
asked to fill out a short questionnaire (see Appendix B on page 52).
The first questions were in regards to which, if any, of the three pacing modes was
found to be the easiest or most difficult to follow, and why. Next, participants were
asked if they had any previous practice in paced breathing, and if so, elaborate on that.
The intention behind these questions were to highlight a possible cause, in case some
participants performed markedly more consistent across all pacing modes and others did
not.
A question that was not included in the on-screen questionnaire, but asked orally, was if
participants had any experience with meditation. In meditation it is not uncommon to
focus on ones breathing, and so this may possibly influence results.
5.2 Test setup
Visual and auditory breath pacing was delivered via a Philips 244E computer monitor
(24 inches, 1920x1080 pixels) and Sennheiser HD202 headphones. Wireless keyboard and
mouse was used by participants when answering a questionnaire. A laptop computer with
an Intel Core i7 2.4 GHz processor was used to run Matlab and the test application. The
laptop display was facing away from the participant. An Arduino Uno with an eHealth
shield (see Design and Implementation – Test 1 on page 13) was connected to the laptop
for data acquisition. The respiration sensor was placed under the participant’s nose, held
in place by a rubber band around the head. The pulse sensor was typically placed on the
participant’s left or right index finger tip. Both sensors were connected via the eHealth
5. Testing – Test 1
5.3. Test procedure
shield. The pulse sensor’s circuit board was hidden, so LED blinks from heart beats
would not be seen by the participant.
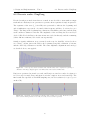
Figure 5.1 – A test participant wearing the headphones and sensors. The test application was run on
the laptop and the screen was mirrored on a monitor facing the test participant. Checking of sensor
signals was done with the monitor turned off, so only the experimenter would see the pulse wave and
respiratory signals on the laptop display.
5.3 Test procedure
When a test participant arrived, he/she would be asked to set his/her mobile phone to a
silent and no-vibration mode, and also not have the mobile screen visible during the test.
This was to prevent any incoming calls or messages to affect the participant, possibly
raising his/her pulse or drawing attention away from the task of paced breathing.
The experimenter would then proceed along the following points:
• Explain that the test was about breath pacing, and what was meant by that.
• Explain that there would be a visual, audio-visual, and an audio pacer.
• That each pacer would last for 5 minutes, preceded by a pause of 1 minute.
• Assist the participant in placing sensors, and finding a comfortable position to rest
the hand with the pulse sensor, requesting that it be held still during the test.
• Turn off the monitor facing the participant, and check sensor signals via the laptop,
adjusting sensor placement or gain if necessary.
• Clear the sensor signal plots from the screen, and turn the monitor back on.
• Enter information about the participant number, gender, and age.
24
5. Testing – Test 1
5.3. Test procedure
• Place headphones on the participant.
• Start the demo mode of the test application.
• Explain that the experimenter would leave the room at the start of the test and
come back in after 18 minutes (the duration of the test).
• Make sure that the participant was ready to begin the test.
• Start the test mode of the test application and leave the room.
• Come back to the test participant after 18 minutes and help remove sensors.
An A4 sheet of paper with screen images of the three breath pacing modes was used, when
first explaining how the cycle of inhalation, hold, exhalation, hold, would correspond
to the progress bar. It was explained that the order in which the pacing modes would
appear during the actual test may differ from the order of the demo mode, and that it was
therefore important that the participant payed attention to how the audio corresponded
with this cycle. Furthermore it was explained that each pacing mode would always begin
with inhalation, and that the speed of pacing was identical across pacers.
The sequence presented in the demo mode was as follows:
1. Pause (7 sec)
2. Visual breath pacing (20 sec)
3. Pause (7 sec)
4. Audio-visual breath pacing, Accordion sound (20 sec)
5. Pause (7 sec)
6. Audio breath pacing, Accordion sound (20 sec)
In test mode the structure was the same, except the order of breath pacing modes was
randomized. The duration of each pause was 1 minute, and the duration of each pacing
mode was 5 minutes, giving the following structure:
1. Pause (1 min)
2. Breath pacing (5 min)
3. Pause (1 min)
4. Breath pacing (5 min)
5. Pause (1 min)
6. Breath pacing (5 min)
In total, from the participant arrived until the participant had finished testing and responded to the questionnaire, the duration was approximately 30 minutes.
25
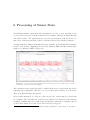
6 Processing of Sensor Data
An additional Matlab application was programmed, in order to plot and inspect the
recorded sensor data, in a manner that was more intuitive than by browsing through
very long text files. The application also served to perform pulse peak detection, so a
time series of interbeat intervals could be calculated and used for statistical analysis.
A script written by Dmitry Savransky and made available on the Matlab File Exchange
website1 , was used for computing power spectral density of HRV, with the Lomb-Scargle
method (see Analysis of HRV on page 10).
Figure 6.1 – Screen capture of the application that was developed in order to inspect the recorded
sensor data, and extract features for analysis.
The respiration sensor signal appeared to exhibit 50 Hz noise, possibly from line power
supplying other equipment connected to or close by the sensor circuitry. To remedy the
effect, a 50 Hz notch filter was applied.
As previously mentioned (see Test procedure on page 24), each breath pacer would run
for 5 minutes. The data that was considered for analysis, was extracted from a window
beginning 1 minute into the breath pacing and having a duration of 3 minutes and 50
seconds (thus ending 10 seconds before the breath pacer stopped).
1
http://www.mathworks.com/matlabcentral/fileexchange/20004-lomb--lomb-scargle--periodogram
6. Processing of Sensor Data
6.0.
The features that were extracted from the sensor data, were as follows:
• HRV peak frequency
• HRV peak power
• Mean heart rate
• Peak heart rate
• Trough heart rate
• Amplitude of HRV
• Respiration rate
HRV peak frequency and power, and mean heart rate, were calculated from the total 3
minute 50 second window. Peak and trough heart rate was calculated for consecutive
10 second windows and then finally calculating the mean of those consecutive peaks and
troughs. Amplitude of HRV was calculated as the difference between peak and trough.
Respiration rate was calculated as a mean rate of the exhalation cycles during the total
3 minute 50 second window.
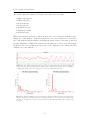
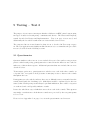
Figure 6.2 – An example of heart rate from one of the test participants. The plot shows 2 minutes of
beat-to-beat heart rate. The first minute is during a pause, with no breath pacing. The second minute
is with breath pacing, with a cycle length of 10 seconds for a full respiration cycle.
Figure 6.3 – Example of HRV power spectral density, each from one minute of a time series of interbeat
intervals. The plot on the left side, is from a participant while there was a pause before breath pacing.
The plot on the right side, is from the same participant in the following minute, where breath pacing
took place.
27
7 Results – Test 1
Originally 20 people participated in the test. Some test data was rejected. In one case
because the test participant was coughing during breath pacing, severely affecting the
pulse wave signal. In some cases because of inaccurate pulse peak detection, e.g. in
two cases the pulse signal was clipped due to the sensor voltage exceeding the Arduino’s
maximum input range.
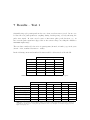
The test data considered below is for 15 participants (11 male, 4 female), age 23-41 years
(mean = 28.4, standard deviation = 4.896).
In the following, mean and standard deviation will be abbreviated as M and SD.
Breath pacer sequence
participants
1st
2nd
3rd
5
Audio
AudioVisual
Visual
3
Audio
Visual
AudioVisual
1
AudioVisual
Audio
Visual
1
AudioVisual
Visual
Audio
2
Visual
Audio
AudioVisual
3
Visual
AudioVisual
Audio
Table 7.1 – The distribution of breath pacer sequences among the 15 participants.
Audio
AudioVisual
Visual
M
SD
M
SD
M
SD
HRV peak frequency [Hz]
0.100474
0.037245
0.100354
0.000296
0.106923
0.025879
HRV peak power [s2 /Hz]
79.992791
26.875805
72.043928
28.057212
80.303084
25.119667
Mean heart rate [bpm]
75.246157
8.091928
77.014328
7.163005
75.406837
7.536848
Peak heart rate [bpm]
85.764879
7.619335
86.805080
6.559240
86.217926
7.075486
Trough heart rate [bpm]
65.339128
8.664732
67.179210
8.452573
65.720184
8.799919
Amplitude of HRV [bpm]
20.425751
5.672465
19.625871
5.854586
20.497741
6.016019
Respiration rate [br./min]
5.530435
1.251863
5.634783
1.414481
5.617391
1.344235
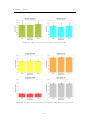
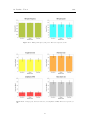
Table 7.2 – Mean values and standard deviation, for features extracted from the sensor data, arranged
according to breath pacer. A bar plot representation can be seen in figure 7.1 and 7.2 on page 29, and
figure 7.3 on page 30.
7. Results – Test 1
7.0.
Figure 7.1 – HRV peak frequency and power. Error bars represent ±1 SD.
Figure 7.2 – Trough, peak, and mean heart rate, and amplitude of HRV. Error bars represent ±1 SD.
29
7. Results – Test 1
7.0.
Figure 7.3 – Respiration rate. Error bars represent ±1 SD.
A repeated measures analysis of variance (ANOVA) was performed for each feature, and
the results can be seen in table 7.3.
F(2,28)
p-value
HRV peak frequency
0.473
0.628
HRV peak power
1.184
0.321
Mean heart rate
4.105
0.027
Peak heart rate
1.131
0.337
Trough heart rate
2.540
0.097
Amplitude of HRV
0.639
0.535
Respiration rate
0.074
0.929
Table 7.3 – Repeated measures ANOVA, F and p values, rounded to 3 decimal places.
The repeated measures ANOVA reported a significant effect of breath pacer type on
mean heart rate, F(2,28) = 4.105, p = 0.027.
A post-hoc pairwise comparison using Tukey’s HSD test, showed that the mean for the
AudioVisual breath pacer (M = 77.014, SD = 7.163) was significantly greater than for
the Visual breath pacer (M = 75.407, SD = 7.537), in respect to mean heart rate.
7.0.1 Questionnaire responses
In response to which breath pacer was found to be the easiest to follow, the number of
responses were: 3 for Audio, 7 for Audio-Visual, 3 for Visual, and 2 for Neither.
In response to which breath pacer was found to be the the most difficult to follow, the
number of responses were: 3 for Audio, 3 for Audio-Visual, 5 for Visual, 4 for Neither.
In response to the question about having previous practice with breath pacing, the responses were: 3 Yes, 12 No. In response to the question about experience with medita-
30
7. Results – Test 1
7.0.
tion, 6 participants had a "little" to "some" experience, and the time of the most recent
experience was half a year ago and up to 6 years ago.
Among the comments, there was a slight tendency to prefer the Audio or AudioVisual
pacers, with the argument that they allowed the participant to close his/her eyes, or
simply not have to look at the screen. However, among those who preferred the Audio
pacer, as well as those who did not, there was mention of the pacer sounding annoying.
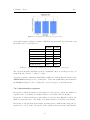
7.0.2 Remarks
It should be noted that for the 15 participants included for statistical analysis, the
respiration sensor signal was not always strong enough to clearly indicate breathing
cycles, and in other cases it is debatable whether a signal should have been counted
as one exhalation or two. Therefore, the statistics regarding respiration can not be
considered valid.
It should also be noted that the large standard deviation seen in HRV peak frequency
for the Audio and Visual breath pacers (see figure 7.1 left), comes exclusively from two
of the fifteen participants. One of these participants showed a HRV peak frequency for
the Audio pacer at 0.003 Hz, while showing the expected peak frequency of 0.1 Hz for
the other pacers. The other participant showed a HRV peak frequency of 0.2 Hz for the
Audio and Visual pacer, but 0.1 Hz for the AudioVisual pacer. For both participants, in
the above mentioned cases of outlying HRV peak frequencies, a second but smaller peak
was found at 0.1 Hz, where the main peak would have been expected.
Figure 7.4 – Two of the 15 participants were the source for almost all of the variance seen in HRV peak
frequency. If those two participants are excluded from the data, then the mean HRV peak frequency
for each pacer mode is located very closely to 0.1 Hz and standard deviation diminishes drastically.
Error bars represent ±1 SD. See figure 7.1 left, for comparison.
If the two participants mentioned above are excluded from the dataset, the mean HRV
peak frequency still lies around 0.1 Hz, but standard deviation is reduced greatly:
31
7. Results – Test 1
7.0.
Audio (M = 0.100270, SD = 0.000410), AudioVisual (M = 0.100356, SD = 0.000314),
Visual (M = 0.100245, SD = 0.000324). See figure 7.4.
32
8 Design and Implementation – Test 2
The second test was designed to investigate whether a difference in HRV exists, between
using two types of audio for breath pacing: continuous and discrete. Also, the Accordion sound from test 1 was included for comparison with the two new audio pacers that
were created, as described in the following sections.
The software application developed for the second test was based on the application
developed for the first test, with only a few modifications required. Please refer to the
file BreathPacerTest_2.m on the CD included with this report, for the complete
code.
The sensors and data acquisition method used in test 2, were the same as in test 1 and
will not be reiterated here.
8.1 Continuous audio: Waves
In order to find a suitable recording of sea waves, as the starting point for creating a
10 second clip for breath pacing, the freesound.org1 website was searched. After listening to over a hundred audio recordings of sea waves, the choice fell on a file named
"MareMio.wav" (freesound.org id: 219120) by the user "Kigofix". The recording has
a duration of approx. 3.5 minutes and a sampling rate of 48 kHz in 24 bit stereo. It
features fairly calm sea waves rolling onto a beach, and the trickling sound of the water
receding, without sounds of sea gulls or people.
It was difficult to find segments that in themselves had natural attack, sustain and decay
periods matching to the aforementioned breathing cycle: 3 sec. inhalation, 1 sec. hold,
4 sec. exhalation, 2 sec. hold. Thus, segments were copied from one or both channels of
the original file and pasted into six new track layers (see figure 8.1), were each segment
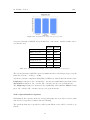
was modified to fit the desired duration and blend with the other layers.
For the first 3 seconds, representing inhalation, two segments of incoming wave sounds
were layered so that when one faded out, the other was increasing its intensity, effectively
building a longer period of increasing intensity. The beginning and end of both segments
1
https://www.freesound.org
8. Design and Implementation – Test 2
8.2. Continuous audio: Waves
Figure 8.1 – Screen capture from Audacity while editing the Waves sound.
were faded in and out, respectively, to transition into an underlying sound of gently
trickling water, representing the 1 second hold. Next, a less intense segment of waves
rolling in was reversed, effectively sounding like waves receding, while distinguishing itself
from other sound segments – this part was used for the 4 seconds exhalation period.
Again, the beginning of the segment was faded in and the end was faded out, to blend
with other layers. For the 2 seconds hold, another clip of gently trickling water was
used. In order to make the final sound clip loop seamlessly, a segment of the trickling
water extending beyond the 10 second mark, was cut and moved to the beginning of a
layer, where it would blend and fade into the inhale wave. The audio layers were finally
combined to form a 10 second mono sound clip and resampled to 44.1 kHz at 16 bit
resolution.
For the final result refer to figure 8.2 below, and the file Waves.wav on the included
CD.
Figure 8.2 – Waveform of the Waves sound file, with a length of 10 seconds. From left to right, the
red arrows mark positions of 3 seconds, 4 seconds, and 8 seconds respectively.
34
8. Design and Implementation – Test 2
8.3. Discrete audio: PingPong
8.2 Discrete audio: PingPong
For the breath pacer made from discrete sounds, it was decided to start with an empty
track and use Audacity’s tone generator to generate short segments of single frequencies.
Two segments of the tone C5 (523.2 Hz) were generated to indicate the beginning and
end of inhalation, respectively. A sound of this frequency will here be referred to as a
"Ping". The Ping at the beginning has a duration of 500 milliseconds (ms), and the Ping
at the end has a duration of 250 ms. The amplitude of the end Ping was decreased by 6
decibel (dB). For both Ping’s, the first 10 ms were faded in linearly, and the remaining
(either 240 ms or 490 ms) were faded out exponetially.
Sounds to signify exhalation, were generated as the tone A3 (220 Hz), referred to here
as a "Pong". Again, just as the Ping’s, the beginning Pong had a duration of 500 ms,
and the end Pong a duration of 250 ms. The same amplitude adjustment and envelope
as described above, was applied.
Figure 8.3 – A close-up view of the waveform of the 220 Hz sound, used to signify the beginning of
exhalation. The image displays approx. 300 milliseconds of the total 500 milliseconds.
Ping’s were positioned at 0 and 3 seconds, and Pong’s at 4 and 8 seconds. See figure 8.3
for a close-up of a single Pong, and figure 8.4 for the complete 10 second sound clip. The
final sound was exported at 44.1 kHz sampling rate, 16 bit resolution (PingPong.wav
on the CD).
Figure 8.4 – Waveform of the PingPong sound file, with a length of 10 seconds. From left to right,
the red arrows mark positions of 3 seconds, 4 seconds, and 8 seconds respectively.
35
8. Design and Implementation – Test 2
8.3. Demo mode and Test mode
8.3 Demo mode and Test mode
In this test the participants would only be performing breath pacing by listening to audio
cues. However, it was decided that the demonstration given before the actual test, would
introduce the three different pieces of audio, first with an audio-visual pacer (reusing the
progress bar from test 1), and then through audio only. This was done both to make
instructions more similar between the two tests, and because it was found to be a useful
method for instructing participants.
36
9 Testing – Test 2
The purpose of test 2 was to investigate whether a difference in HRV exists between using
two types of audio for breath pacing: continuous and discrete. The Waves and PingPong
sounds described in Design and Implementation – Test 2 on page 33 were used, and
additionally the Accordion sound from test 1 was included for reference.
The setup used in test 2 was identical to that of test 1, described in Test setup on page
23. The test application was slightly modified from test 1, to accommodate the procedure
in test 2, described in the following sections.
9.1 Questionnaire
Questions similar to those in test 1, were included for test 2. In regards to any previous
practice with breath pacing, participants who recurred from the first test were asked to
make note of this in their response. Additional questions that were included in test 2 are
described below:
To investigate preferences, participants were asked to rate each of the three sounds, on
a 7-point scale, in regards to how pleasant or annoying it was to listen to the sounds
throughout the test.
Participants were also asked to indicate how easy or difficult it was to remember how the
sounds should guide the breathing cycle. Although it would be explained before the test
started, that breath pacing would always begin with inhalation, this could be forgotten
or overheard, and could possibly influence results.
It was also asked how easy or difficult it was to hear each of the sounds. This question
was simply a verification to check that no sounds were perceived by the test participants
to be too low.
Please refer to Appendix C on page 53 to view the questionnaire used in test 2.
9. Testing – Test 2
9.2. Test procedure
9.2 Test procedure
As in test 1, the experimenter would make sure that the participant’s mobile phone would
not disturb the test, and the experimenter would then proceed along the following points
(similar to test 1):
• Explain that the test was about breath pacing, and what was meant by that.
• Explain that there would be 3 different audio pacers.
• That each pacer would last for 5 minutes, preceded by a pause of 1 minute.
• Assist the participant in placing sensors, and finding a comfortable position to rest
the hand with the pulse sensor, requesting that it be held still during the test.
• Turn off the monitor facing the participant, and check sensor signals via the laptop,
adjusting sensor placement or gain if necessary.
• Clear the sensor signal plots from the screen, and turn the monitor back on.
• Enter information about the participant number, gender, and age.
• Place headphones on the participant.
• Start the demo mode of the test application.
• Explain that the experimenter would leave the room at the start of the test and
come back in after 18 minutes (the duration of the test).
• Make sure that the participant was ready to begin the test.
• Start the test mode of the test application and leave the room.
• Come back to the test participant after 18 minutes and help remove sensors.
It was explained that the order in which the pacing sounds would appear during the
actual test may differ from the order of the demo mode, and that there would be no
visual pacer in the actual test. Also, it was explained that each pacer audio would
always begin with inhalation, and that the speed of pacing was identical across pacers.
Although this test would focus solely on auditory cues for breath pacing, it was found
useful to include the visual progress bar when demonstrating to participants how the
breathing cycle corresponded with the audio. Thus, the sequence presented in the demo
mode was as follows:
1. Pause (7 sec)
2. Audio-visual breath pacing, Accordion (20 sec)
3. Pause (7 sec)
4. Audio breath pacing, Accordion (20 sec)
5. Pause (7 sec)
6. Audio-visual breath pacing, Waves (20 sec)
7. Pause (7 sec)
8. Audio breath pacing, Waves (20 sec)
38
9. Testing – Test 2
9.2. Test procedure
9. Pause (7 sec)
10. Audio-visual breath pacing, PingPong (20 sec)
11. Pause (7 sec)
12. Audio breath pacing, PingPong (20 sec)
In test mode no audio-visual pacing was presented, and the order of breath pacing
audio was randomized. The duration of each pause was 1 minute, and the duration of
each pacing mode was 5 minutes, resulting in the following structure:
1. Pause (1 min)
2. Audio breath pacing (5 min)
3. Pause (1 min)
4. Audio breath pacing (5 min)
5. Pause (1 min)
6. Audio breath pacing (5 min)
From the participant arrived until she/he had finished testing and responded to the
questionnaire, the duration was approximately 35 minutes.
39
10 Results – Test 2
Originally 14 people participated in the test. The test data from one participant was
rejected, due to what appeared to be motion artefacts in the pulse wave signal. Feature
extraction was done with the same method as for test 1, described in Processing of Sensor
Data on page 26.
The test data considered below is for 13 participants (8 male, 5 female), age 21-55
years (mean 33.077, std 9.106). Five of these participants also appeared in test 1, with
approximately three weeks time between participating in the two tests.
In the following, mean and standard deviation will be abbreviated as M and SD.
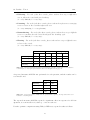
Breath pacer sequence
participants
1st
2nd
3rd
2
Accordion
Waves
PingPong
1
Accordion
PingPong
Waves
1
Waves
Accordion
PingPong
3
Waves
PingPong
Accordion
5
PingPong
Accordion
Waves
1
Visual
Waves
Accordion
Table 10.1 – The distribution of breath pacer sequences among the 13 participants.
Accordion
M
SD
Waves
M
PingPong
SD
M
SD
HRV peak frequency [Hz]
0.100307
0.000256
0.100211
0.000397
0.100088
0.000473
HRV peak power [s2 /Hz]
104.728094
18.990621
104.253327
18.141188
102.625702
16.844486
Mean heart rate [bpm]
78.179672
10.853227
77.942248
9.578062
77.051404
10.581616
Peak heart rate [bpm]
88.878352
10.729586
89.394995
10.027823
87.690187
10.511956
Trough heart rate [bpm]
68.191840
11.052239
67.510991
9.571247
67.164279
10.417123
Amplitude of HRV [bpm]
20.686512
7.021152
21.884004
7.150380
20.525908
6.644200
Respiration rate [br./min]
6.020067
0.072352
6.020067
0.072352
6.000000
0.000000
Table 10.2 – Mean values and standard deviation for features extracted from the sensor data, arranged
according to breath pacer. A bar plot representation can be seen in figure 10.1 and 10.2 on page 41,
and figure 10.3 on page 42.
10. Results – Test 2
10.0.
Figure 10.1 – HRV peak frequency and power. Error bars represent ±1 SD.
Figure 10.2 – Trough, peak, and mean heart rate, and amplitude of HRV. Error bars represent ±1
SD.
41
10. Results – Test 2
10.0.
Figure 10.3 – Respiration rate. Error bars represent ±1 SD.
A repeated measures ANOVA was performed for each feature, and the results can be
seen in table 10.3.
F(2,24)
p-value
HRV peak frequency
0.993
0.385
HRV peak power
0.104
0.902
Mean heart rate
1.704
0.203
Peak heart rate
6.977
0.004
Trough heart rate
0.842
0.443
Amplitude of heart rate
2.303
0.122
Respiration rate
0.480
0.929
Table 10.3 – Repeated measures ANOVA, F and p values, rounded to 3 decimal places.
The repeated measures ANOVA reported a significant effect of breath pacer type on peak
heart rate, F(2,24) = 6.977, p = 0.004.
A post-hoc pairwise comparison using Tukey’s HSD test, showed that the mean for the
PingPong breath pacer (M = 87.690, SD = 10.512) was significantly lower than for the
Accordion breath pacer (M = 88.878, SD = 10.730), in respect to peak heart rate.
The PingPong breath pacer mean was also significantly lower than the Waves breath
pacer (M = 89.395, SD = 10.028), in respect to peak heart rate.
10.0.1 Questionnaire responses
Unfortunately the responses from one of the participants were lost due to an error, thus
only 12 sets of responses is analysed in the following.
The questions that were responded to with 7-point Likert scales, will be referred to as
follows:
42
10. Results – Test 2
10.0.
• Following—For each of the three sounds, please indicate how easy or difficult it
was to follow the sound with your breathing.
(1 = very difficult, 7 = very easy).
• Listening—For each of the three sounds, please indicate how pleasant or annoying
it was to listen to the sound throughout the test.
(1 = very annoying, 7 = very pleasant).
• Remembering—For each of the three sounds, please indicate how easy or difficult
it was to remember how the sound should guide the breathing cycle.
(1 = very difficult, 7 = very easy).
• Hearing—For each of the three sounds, please indicate how easy or difficult it was
to hear to the sound.
(1 = very difficult, 7 = very easy).
Accordion
Waves
PingPong
M
SD
M
SD
M
SD
Following
6.000
0.953
6.417
0.669
4.750
1.815
Listening
3.083
1.379
6.500
0.674
4.667
1.435
Remembering
6.417
0.996
6.333
0.888
5.083
1.832
Hearing
6.917
0.289
6.833
0.389
6.083
1.084
Table 10.4 – Mean and standard deviation of questionnaire responses. Values have been rounded to
3 decimal places. A bar plot representation can be seen in figure 10.4 on page 44.
A repeated measures ANOVA was performed for each question, and the results can be
seen in table 10.5.
F(2,22)
p-value
Following
6.941
0.005
Listening
20.767
0.000
Remembering
7.384
0.004
Hearing
6.217
0.007
Table 10.5 – Repeated measures ANOVA for the questionnaire responses. F and p values have been
rounded to 3 decimal places.
The repeated measures ANOVA reported a significant effect in responses for all four
questions, as seen in table 10.5, where p < 0.05 in each case.
Post-hoc pairwise comparisons using Tukey’s HSD test, reported results as follows:
43
10. Results – Test 2
10.0.
• Following: the mean for the Waves (M = 6.417, SD = 0.669) was significantly
higher than the mean for the PingPong breath pacer (M = 4.750, SD = 1.815).
• Listening: the mean for the Waves (M = 6.500, SD = 0.674) was significantly
higher than the mean for the Accordion breath pacer (3.083, SD = 1.379).
Also, the mean for the Waves (M = 6.500, SD = 0.674) was significantly higher
than the mean for the PingPong breath pacer (4.667, SD = 1.435).
• Remembering: the mean for the Accordion (M = 6.417, SD = 0.996) was significantly higher than the mean for the PingPong breath pacer (5.083, SD = 1.832).
Also, the mean for the Waves (M = 6.333, SD = 0.888) was significantly higher
than the mean for the PingPong breath pacer (5.083, SD = 1.832).
• Hearing: In this case, the pairwise comparisons did not show any significant results
at the p < 0.5 level.
Figure 10.4 – Bar plots of mean and standard deviation from questionnaire responses, which were
given on 7-point Likert scales. Error bars represent ±1 SD.
44
10. Results – Test 2
10.0.
To the question about having previous practice with breath pacing, 6 replied "yes",
although for 5 participants the practice came from participating in test 1, at least three
weeks earlier. One participant mentioned sporadic practice over the past 10 years.
To the question about practice or experience with meditation, 5 replied "yes", and 3 of
those 5 noted that the experience was minimal, the most recent being a year ago. Out
of the remaining 2, one mentioned 10 years of budo training (a form of karate), where
each session has a short meditation at the beginning and end. The other mentioned 5
years recent yoga and meditation practice.
45
11 Discussion
11.1 Discussion of test 1
At the time of writing, it is unclear what lies at the root of the statistically significant
result found in test 1, of mean heart rate being higher during the AudioVisual breath
pacer than during the Visual breath pacer. Looking at the bar plots in figure 7.2 on page
29, the significance of the difference does not intuitively come to mind. Also, despite the
ANOVA reporting a significant effect, it could be considered questionable how significant
that effect is in practice—after all, the two means are at approximately 77 and 75.4 bpm,
giving a difference of approx. 1,6 bpm. Furthermore, it should be considered that what
is sought achieved with breath pacing in relation to HRV, is a higher amplitude in the
oscillations of heart rate, not generally a higher heart rate.
The dominant frequency in HRV during breath pacing, was found to be almost exactly
0.1 Hz as expected, with very few exceptions, meaning that participants closely followed
the breath pacing cycle in each modality.
A subsequent review of the HRV data from the participant that had a peak HRV frequency of 0.003 Hz for the Audio pacer, showed that the participant’s heart rate varied
relatively little. It also showed a trend towards a slowly, but steadily, climbing heart rate
during that particular breath pacer—which also happened to be the first breath pacer in
that participant’s test. The relatively low variability, plus the trend in slowly increasing
heart rate, resulted in the main peak frequency being at the very low end. A secondary
peak was found around the expected 0.1 Hz in this case.
The comments about the audio breath pacer being annoying to listen to, are interesting
from the perspective of testing other sounds and gathering participants’ responses to
those sounds.
11.2 Discussion of test 2
In test 2, the ANOVA reported a significant effect of breath pacer on peak heart rate,
and once again the result does not intuitively present its significance (see figure 10.2 on
11. Discussion
11.3. General discussion
page 41). In this case it concerns the peak heart rate being lower for the PingPong pacer,
compared to the other two pacers.
The dominant frequency in HRV during breath pacing, was again found to be almost
exactly 0.1 Hz as expected, and this time with no exceptions. The two participants that
were the source of exceptions in this measure in test 1, did not participate in test 2.
From the questionnaire responses it is interesting to note that the discrete PingPong
sound receives the lowest mean score, for the question about how easy it was to follow
with ones breathing. Statistically, the Waves sound stands out as scoring significantly
higher (being easier to follow) than the PingPong sound.
In the evaluation of how pleasant the sounds were to listen to during breath pacing,
the Waves sound received a significantly higher score than both the Accordion and the
PingPong sound. The Waves stand out particularly from the Accordion sound, originally
found in the CardioSense Trainer product (CardioSense Trainer on page 5). The Waves
used in the test were repeated without any variation—it could be considered that adding
slight variations in the wave sounds (not in the overall timing), may lead to an even more
pleasant listening experience, and thus a more attractive product.
In regards to the question about how easy or difficult it was to hear the sounds, the
experimenter asked one participant for reason why he chose to rate the PingPong sound
lower than the other sounds. His response was, that since there was less sound overall—
because of the long silent gaps—he considered the PingPong sound less audible. This
sort of reasoning may well have led to the slightly lower mean score for the PingPong
sound.
For the question about how easy or difficult it was to remember how the sound should
guide the breathing cycle, one participant orally expressed being puzzled by the question,
as he remembered it had been stated in the instructions before the test, that all breath
pacers would begin with inhalation. Having remembered this, it seemed trivial to follow
the pacer sounds. However, it was clear from conversations after tests, that not all
participants remembered this information from the initial instructions.
11.3 General discussion
A caveat in this study, is that the pulse wave signals were not refined by applying
parabolic interpolation, before performing peak detection and calculating heart rate,
despite such an approach being recommended for the sampling rate adopted here (see
Measuring Heart Rate on page 8). The result could be a somewhat higher degree of noise
in the data.
47
12 Conclusion
Two tests have been performed to investigate if different types of breath pacing differ
in effect on heart rate variability (HRV). In test 1, the breath pacers were auditory,
audio-visual, and visual. In test 2, the breath pacers were all auditory and consisted of a
continuous accordion-like sound, a continuous sound of ocean waves, and a discrete pingpong type of sound. The waves and ping-pong sounds were constructed for this study,
whereas the accordion sound was found in a HRV biofeedback application that employs
breath pacing. Furthermore, it was investigated which sounds participants found to be
the easiest to follow and most pleasant to listen to.
A significant result was found in test 1, for the effect of breath pacer type on mean heart
rate, where the audio-visual pacer resulted in a higher mean heart rate than the visual
pacer. The result should be approached with caution, as the cause is unclear and should
be investigated further.
In test 2, a significant result was found for the effect of breath pacer type on peak heart
rate, where the ping-pong sound resulted in a lower peak heart rate than the waves and
accordion. Again, the cause for the result is unclear, and should be investigated further.
The waves sound was found to be significantly more pleasant to listen to than the other
two sounds, and the waves sound was found to be significantly easier to follow than the
ping-pong sound.
13 Bibliography
[1]
Alan Watkins. “The electrical heart: Energy in cardiac health and disease”. In:
Energy medicine east and west: A natural history of qi. New York, NY: Elsevier
(2011) (cit. on pp. 2–3).
[2]
Hye-Sue Song and Paul M Lehrer. “The effects of specific respiratory rates on heart
rate and heart rate variability”. In: Applied psychophysiology and biofeedback 28.1
(2003), pp. 13–23 (cit. on pp. 2, 10–11).
[3]
Richard Gevirtz. “The Promise of Heart Rate Variability Biofeedback: EvidenceBased Applications”. In: Biofeedback 41.3 (2013), pp. 110–120 (cit. on p. 3).
[4]
Paul Lehrer et al. “Protocol for Heart Rate Variability Biofeedback Training”. In:
Biofeedback 41.3 (2013), pp. 98–109 (cit. on pp. 3, 11).
[5]
HeartMath. Inner Balance 3.1 User Manual v3.1. http://cdn.heartmath.
com / manuals / InnerBalanceManual _ v3 _ 1 _ for _ iOS7 . pdf. Accessed:
05.06.2014 (cit. on p. 4).
[6]
MyBrainSolutions. MyCalmBeat. https : / / www . mybrainsolutions . com /
mycalmbeat. Accessed: 05.06.2014 (cit. on p. 4).
[7]
Fred Shaffer and Didier C Combatalade. “Don’t Add or Miss a Beat: A Guide to
Cleaner Heart Rate Variability Recordings”. In: Biofeedback 41.3 (2013), pp. 121–
130 (cit. on pp. 8–9).
[8]
R Benjamin Knapp, Jonghwa Kim, and Elisabeth André. “Physiological signals
and their use in augmenting emotion recognition for human–machine interaction”.
In: Emotion-Oriented Systems. Springer, 2011, pp. 133–159 (cit. on p. 8).
[9]
Axel Schäfer and Jan Vagedes. “How accurate is pulse rate variability as an estimate
of heart rate variability?: A review on studies comparing photoplethysmographic
technology with an electrocardiogram”. In: International journal of cardiology 166.1
(2013), pp. 15–29 (cit. on p. 8).
[10]
Marek Malik et al. “Heart rate variability. Standards of measurement, physiological
interpretation, and clinical use”. In: European heart journal 17.3 (1996), pp. 354–
381 (cit. on pp. 8, 10).
13. Bibliography
[11]
13.0. Bibliography
Julian F Thayer et al. “Heart rate variability, prefrontal neural function, and cognitive performance: the neurovisceral integration perspective on self-regulation, adaptation, and health”. In: Annals of Behavioral Medicine 37.2 (2009), pp. 141–153 (cit.
on p. 9).
[12]
Bradley M Appelhans and Linda J Luecken. “Heart rate variability as an index
of regulated emotional responding.” In: Review of general psychology 10.3 (2006),
p. 229 (cit. on pp. 9–10).
[13]
J Philip Saul. “Beat-to-beat variations of heart rate reflect modulation of cardiac
autonomic outflow”. In: News in Physiological Sciences 5.1 (1990), pp. 32–37 (cit.
on p. 9).
[14]
Pablo Laguna, George B Moody, and Roger G Mark. “Power spectral density of
unevenly sampled data by least-square analysis: performance and application to
heart rate signals”. In: Biomedical Engineering, IEEE Transactions on 45.6 (1998),
pp. 698–715 (cit. on p. 10).
[15]
Anne-Louise Smith, Harry Owen, and Karen J Reynolds. “Heart rate variability
indices for very short-term (30 beat) analysis. Part 1: survey and toolbox”. In:
Journal of clinical monitoring and computing 27.5 (2013), pp. 569–576 (cit. on
p. 10).
[16]
Evgeny G Vaschillo, Bronya Vaschillo, and Paul M Lehrer. “Characteristics of resonance in heart rate variability stimulated by biofeedback”. In: Applied Psychophysiology and Biofeedback 31.2 (2006), pp. 129–142 (cit. on pp. 10–11).
[17]
Paul M Lehrer. “Biofeedback training to increase heart rate variability”. In: Principles and practice of stress management 3 (2007), pp. 227–248 (cit. on p. 11).
[18]
Paul M Lehrer, Evgeny Vaschillo, and Bronya Vaschillo. “Resonant frequency biofeedback training to increase cardiac variability: Rationale and manual for training”. In:
Applied psychophysiology and biofeedback 25.3 (2000), pp. 177–191 (cit. on p. 11).
[19]
Esko O. Dijk and Alina Weffers. “Breathe with the Ocean: a System for Relaxation
using Audio, Haptic and Visual Stimuli”. In: EuroHaptics 2010 (2010), p. 47 (cit.
on pp. 12, 57).
50
14 Appendices
14.1 Appendix A
The complete code for the Arduino Uno:
// eHealth sensor platform for Arduino
#include <eHealth.h>
// Initialize variables
int airFlow = 0, pulseWave = 0;
unsigned long time = 0, timeStart = 0, loopEntryTime = 0;
String preA = String("A");
String preB = String("B");
String preC = String("C");
String stringToSerial = String();
char a = ’b’;
void setup(){
Serial.begin(115200); //initialize serial communication at 115200 bps
Serial.print(’a’); // sending a character to PC
while (a != ’a’) {
a = Serial.read(); // wait for an ’a’ from the PC
}
timeStart = millis(); // the time when we proceed to the main loop
}
void loop(){
loopEntryTime = micros(); // keep track of time at beginning of loop
if (Serial.available() > 0) { // check if PC has sent any data
a = Serial.read();
}
// if we did NOT receive a ’b’ from the PC, then send sample data
if (a != ’b’){
airFlow = analogRead(A1); // sample eHealth airflow sensor
pulseWave = analogRead(A0); // sample pulse sensor
time = millis() - timeStart; // timestamp for sensor data
// concatenate string of prefix characters and sensor data
stringToSerial = preA+time + preB+pulseWave + preC+airFlow;
// send string to serial port
Serial.println(stringToSerial);
}
// idle here until nearly 10 milliseconds have passed
while (micros()-loopEntryTime < 9996) { }
}
14. Appendices
14.2. Appendix B
14.2 Appendix B
Questionnaire from test 1:
52
14. Appendices
14.3. Appendix C
14.3 Appendix C
Questionnaire from test 2 (continues on the following pages):
53
14. Appendices
14.3. Appendix C
54
14. Appendices
14.3. Appendix C
55
14. Appendices
14.3. Appendix C
56
14. Appendices
14.4. Appendix D
14.4 Appendix D
Personal correspondence from Esko Dijk, co-author of the Philips Research paper [19]
mentioned in section 3.3 on page 11.
Re: Ocean waves as a breathing guide
[email protected] on behalf of Esko Dijk [[email protected]]
Sent:Monday, June 16, 2014 21:34
To: Christian Toft
Hello Christian,
what we created for the setup is two audio samples of waves crashing on the shore, one with the deep/low rumble
and one with the high/noisy sound of the final phase of the wave. The software we made plays these samples in
the proper rhythm. It can be set to any speed in terms of cycles per minute. That is also used for the adaptive
version which adapts to the user’s breathing rate.
Compared to a real audio recording of the sea our approach can get a bit monotonous because the sampled sounds
are always the same; however for a short test period this is not an issue. (It could be for daily use etc.)
I can tomorrow at work look up a bit more details about the setup - see if I can tell you more on this by the end
of tomorrow.
best regards,
Esko
———
Re: Ocean waves as a breathing guide
[email protected] on behalf of Esko Dijk [[email protected]]
Sent:Wednesday, June 18, 2014 10:19
To: Christian Toft
Hello,
I looked at the code of our test setup, and found some more info:
1- samples used - origin of the samples was not mentioned there but to give you an idea I have put the sample
clips used on my website: http://www.eskodijk.nl/files/[1 ] so you can listen. There are a few variants of each
sample
2- during playback a mix was made of different samples, periodically an Inhale then an Exhale sample, and the
total was mixed with a long (several minutes) calm sea sound (which is not in the zip file) at low amplitude to
blend everything together.
3- we tried samples also from Freesound.org, although not sure if these are the source of the material we used.
These are samples 31762 by Slanesh ; 48412 by Luftrum.
if you need more info let me know!
regards
Esko
1
Link removed by author of this report, as the agreement was to include only email correspondence.
57