1
A Bio-Assembly, Mosaic Building, and
Informatics System for Cell Biology
by
April Deirdre Blaylock
A thesis
presented to the University of Waterloo
in fulfillment of the
thesis requirement for the degree of
Master of Applied Science
in
Mechanical Engineering
Waterloo, Ontario, Canada, 2007
©April D. Blaylock 2007
AUTHOR'S DECLARATION
I hereby declare that I am the sole author of this thesis. This is a true copy of the thesis, including
any required final revisions, as accepted by my examiners.
I understand that my thesis may be made electronically available to the public.
ii
Abstract
In the field of regenerative medicine, there is a need to develop technologies that can increase the
overall efficiency of imaging and expanding cells in culture and in complex heterogeneous
arrangements necessary for tissue construction. Long-term live cell imaging has the potential to
significantly enhance our understanding of intercellular signaling pathways and the dependence
of phenotype on cell arrangement. A transdisciplinary approach has been taken to bridge the
fields of cell biology, robotics, and photonics to create a long-term live cell imaging system
capable of single cell handling as well as the acquisition of multiple types of data needed for data
mining and a general informatics approach to cell culture. A Bio-Assembly Mosaic Builder and
Informatics (BAMBI) system was designed and developed using custom software to control a 3axis stage manufactured by Galil Inc, and custom 1-axis micromanipulator for robotic operations.
The software also employs a Sony charged-coupled device sensor for real-time image feedback
and data acquisition. The system is mounted on a Carl Zeiss Axiovert 200 inverted microscope.
Custom-built environmental controls are used to maintain the temperature, humidity, and gas
conditions for extended live cell work. The software was designed using Visual C++ for the
Windows PC platform using an object orientated and modular design methodology to allow the
BAMBI software to continue to grow with new tasks and demands as needed. The modular
approach keeps functional groups of code within context boundaries allowing for easy removal,
addition, or changes of functions without compromising the usability of the whole system.
BAMBI has been used to image cells within a novel cell culture chamber that constricts cell
growth to a true monolayer for high-resolution imaging. In one specific application, BAMBI was
also used to characterize and track the development of individual Colony Forming Units (CFU)
over the five-day culture period in 5-day CFU-Hill colony assays.
The integrated system
successfully enabled the tracking and identification of cell types responsible for the formation of
the CFU-Hill colonies (a putative endothelial stem cell). BAMBI has been used to isolate single
hematopoietic stem cell (HSC) candidate cells, accumulate long-term live cell images, and then
return these cells back to the in-vivo environment for further characterization. From these results,
further data mining and lineage informatics suggested a novel way to isolate and purify HSCs.
Studies such as these are the fundamental next step in developing new therapies for regenerative
medicine in the future.
iii
Acknowledgements
Most of all, I would like to thank my co-supervisor Eric Jervis for taking me under his tutelage,
sponsoring my graduate studies, and being available whenever I needed his input. He has
inspired me to go beyond the limits of my education, to learn and work in the field of stem cell
research and tissue engineering. Without his support and guiding influence this work would not
have been possible. I would also like to thank my co-supervisor Jan Huissoon for his support in
my graduate studies as well as his advice freely offered whenever needed. I would also like to
acknowledge and thank my “supervisor” (in spirit), John Medley. Although he was not officially
one of my supervisors, he has helped me on a number of occasions (both undergraduate and
graduate) and served as an overall force for good during my time at the University of Waterloo.
Finally, I would like to acknowledge John Ramunas, who has proof read and provided input on
many of the pages in this document. This thesis is only part of the greater work of several
students and is truly the result of "standing on the shoulders of giants".
iv
Dedication
I wish to dedicate this thesis to my mother, Sandra Johnman, and my stepfather, the late William
Johnman. Both of who have supported my decision to return to graduate school as well as flying
me home anytime I needed to be close to my family.
v
Table of Contents
AUTHOR'S DECLARATION........................................................................................................ ii
Abstract .......................................................................................................................................... iii
Acknowledgements........................................................................................................................ iv
Dedication ........................................................................................................................................v
Table of Contents ........................................................................................................................... vi
List of Figures ..................................................................................................................................x
List of Tables ................................................................................................................................ xii
Chapter 1 Introduction .....................................................................................................................1
Chapter 2 Background .....................................................................................................................3
2.1 Light Microscopy ...................................................................................................................3
2.1.1 Fundamental Definitions .................................................................................................3
2.1.2 Wide Field vs. Confocal Imaging....................................................................................5
2.1.3 Differential Interference Contrasting ..............................................................................6
2.1.4 Fluorescence Imaging......................................................................................................6
2.2 Digital Imaging for Light Microscopy ...................................................................................8
2.3 Automated Microscopy........................................................................................................11
2.3.1 Stage and Focus Automation.........................................................................................11
2.3.2 Automated Illumination ................................................................................................13
2.3.3 Autofocus ......................................................................................................................14
2.3.4 Environmental Control ..................................................................................................16
2.3.5 High Content Screening ................................................................................................17
2.3.6 Automated Microscopy Software..................................................................................19
2.4 Cell Manipulation.................................................................................................................21
2.4.1 Ink-jet Cell Printing.......................................................................................................21
2.4.2 Laser Cell Printing ........................................................................................................22
2.4.3 Acoustic Cell Printing ...................................................................................................24
2.4.4 Rapid Prototype Cell Printing .......................................................................................25
2.4.5 Optical Trapping............................................................................................................25
2.4.6 Dielectrophoresis...........................................................................................................28
vi
2.4.7 Photopatterning .............................................................................................................28
2.4.8 Microfluidic Cell Patterning .........................................................................................29
Chapter 3 Problem Statement and Objectives ...............................................................................31
3.1 Problem Statement ...............................................................................................................31
3.2 Objectives ............................................................................................................................31
3.2.1 Primary Objectives........................................................................................................32
3.2.2 Secondary Objectives....................................................................................................33
3.3 Architecture of BAMBI .......................................................................................................34
Chapter 4 Hardware Evolution and Implementation .....................................................................37
4.1 Hardware Components.........................................................................................................37
4.2 Microscopes .........................................................................................................................38
4.2.1 Optimizing CCD Sensitivity .........................................................................................38
4.3 Environmental Control.........................................................................................................39
4.3.1 Environment Box ..........................................................................................................40
4.3.2 Temperature Regulation................................................................................................40
4.3.3 Cell Culture Environment Chamber..............................................................................41
4.3.4 CO2 Regulation .............................................................................................................42
4.4 BAMBI End Effectors .........................................................................................................42
4.4.1 Three Axis Stage...........................................................................................................43
4.4.2 The Single Axis Micropipette .......................................................................................44
4.5 Light Channels .....................................................................................................................44
4.5.1 Light Shutter .................................................................................................................45
4.5.2 The LED Array .............................................................................................................46
4.6 Control System.....................................................................................................................47
4.6.1 4-Axis Legacy Control..................................................................................................47
4.6.2 4-Axis Control...............................................................................................................48
4.6.3 4-Axis Driver Module ...................................................................................................49
4.6.4 8-Axis Control...............................................................................................................52
4.6.5 8-Axis Driver Module ...................................................................................................52
Chapter 5 Software Development and Implementation.................................................................55
5.1 The Dynamic System...........................................................................................................55
vii
5.2 Software Implementation .....................................................................................................61
5.2.1 Autofocus ......................................................................................................................61
5.2.2 Automatic Image Stitching............................................................................................62
5.2.3 Backlash Compensation ................................................................................................63
5.2.4 BAMBI Image Space ....................................................................................................66
5.2.5 Mosaic Capture and Trajectory Generation ..................................................................67
5.2.6 Mosaic Blocks ...............................................................................................................73
5.2.7 Mosaic Block File Structures ........................................................................................73
5.2.8 Mosaic Capture Algorithm............................................................................................74
5.3 Graphical User Interface ......................................................................................................79
5.3.1 Mosaic Editor ................................................................................................................80
5.3.2 Robot Control................................................................................................................82
5.3.3 Camera Window............................................................................................................85
5.3.4 Mosaic Builder ..............................................................................................................86
5.4 Code Considerations ............................................................................................................87
5.4.1 The Windows Programming Model ..............................................................................87
5.4.2 BAMBI Class Structure ................................................................................................90
Chapter 6 Applications of BAMBI ..............................................................................................101
6.1 Monolayer Cell Cultures ....................................................................................................101
6.2 Hematopoietic Stem Cell Assay.........................................................................................102
6.2.1 Method ........................................................................................................................102
6.2.2 Results .........................................................................................................................103
6.2.3 Discussion ...................................................................................................................104
6.3 CFU-Hill Formation Assay ................................................................................................106
6.3.1 Method ........................................................................................................................106
6.3.2 Results .........................................................................................................................106
6.3.3 Discussion ...................................................................................................................110
6.4 Imaging Human Islets of Langerhans ................................................................................110
6.4.1 Method ........................................................................................................................111
6.4.2 Results .........................................................................................................................111
6.4.3 Discussion ...................................................................................................................112
viii
Chapter 7 Discussion ...................................................................................................................115
Chapter 8 Conclusions and Recommendations ...........................................................................121
8.1 Conclusions........................................................................................................................121
8.2 Recommendations..............................................................................................................122
8.2.1 Enhanced Sony Drivers...............................................................................................122
8.2.2 Data Compression .......................................................................................................122
8.2.3 Autofocus ....................................................................................................................122
8.2.4 Autonomous Cell Sorting............................................................................................123
8.2.5 Fog-Light Warning System.........................................................................................123
Appendix A Mechanical ..............................................................................................................125
Appendix B Electrical..................................................................................................................143
Appendix C Software ..................................................................................................................175
References....................................................................................................................................181
ix
List of Figures
Figure 1: Working Distance for an Inverted Objective....................................................................4
Figure 2: Epi-Fluorescent Illumination............................................................................................7
Figure 3: Spectral Sensitivity for Sony XCD-SX910 BW Camera ...............................................10
Figure 4: BAMBI Overview ..........................................................................................................35
Figure 5: BAMBI Hardware Control Pathway ..............................................................................37
Figure 6: Cell Culture Environment Chamber...............................................................................41
Figure 7: BAMBI Three Axis Stage ..............................................................................................43
Figure 8: Electromechanical Light Shutter ....................................................................................45
Figure 9: 5-Channel LED Array Connection Diagram..................................................................46
Figure 10: 4-Axis DC Servo Loop.................................................................................................48
Figure 11: 4-Axis Interconnect Diagram .......................................................................................49
Figure 12: Pulse Width Modulation for DC Motor Control ..........................................................50
Figure 13: Full H-Bridge Driver ....................................................................................................51
Figure 14: Differential Amplifier Driver .......................................................................................54
Figure 15: Robot, Sample, and Camera Coordinate Space............................................................56
Figure 16: Image Space .................................................................................................................58
Figure 17: Static Backlash Characteristic ......................................................................................63
Figure 18: Backlash Correction Method 1.....................................................................................64
Figure 19: Backlash Correction Method 2.....................................................................................65
Figure 20: 2-D Time Course ..........................................................................................................69
Figure 21: 2-D Time Course Paths ................................................................................................69
Figure 22: Hypercube ....................................................................................................................71
Figure 23: 3-D Path Generation .....................................................................................................72
Figure 24: Mosaic Block Raw File Structures ...............................................................................74
Figure 25: Outer Control Loop ......................................................................................................75
Figure 26: OnTimerFunction Logic Tree.......................................................................................76
Figure 27: LED Logic Tree............................................................................................................78
Figure 28: DIC Logic Tree ............................................................................................................79
Figure 29: BAMBI Software User Interface..................................................................................80
x
Figure 30: Mosaic Editor Window ................................................................................................81
Figure 31: Navigation panel ..........................................................................................................82
Figure 32: System Properties Dialog .............................................................................................84
Figure 33: Mosaic Builder Dialog .................................................................................................86
Figure 34: Windows Message Loop Event Handling....................................................................89
Figure 35: Class Ownership Diagram............................................................................................91
Figure 36: Microfabricated array and representative culture results ...........................................104
Figure 37: Four sub-populations of morphologically distinct cells contribute to CFU-Hill
formation..............................................................................................................................107
Figure 38: Plasticity of large round cell phenotype.....................................................................107
Figure 39: Multi-scale large field mosaic of the CFU Hill assay on day 5 .................................108
Figure 40: Stages of CFU-Hill Formation ...................................................................................109
Figure 41: Eight optical sections of a human islet of Langerhans...............................................112
xi
List of Tables
Table 1: Comparison of different commercially available automated stages and focus controls for
microscopy.............................................................................................................................12
Table 2: Comparison of selected high-throughput and high-content screening systems...............18
Table 3: Comparison of selected automated microscopy software programs................................20
Table 4: BAMBI Microscope Objectives – Specifications............................................................38
Table 5: CCD Relative Light Sensitivity Chart .............................................................................39
Table 6: 4-Axis DC Motor Truth Table .........................................................................................52
xii
Chapter 1
Introduction
Cell biology, bioengineering, and microelectronics are fast growing fields wherein advances are
being made that can help millions of people who would benefit from their application in
regenerative medicine. In cell biology, scientists are working towards an understanding of the
fundamental nature of cells to give medicine new ways to treat patients. Bioengineering is a
relatively new field so that, when applied to cell biology, is more directed at unraveling the
reasons of how and why cells behave the way they do, so that models and technologies can be
developed to take advantage of advances in cell and molecular biology. Significantly, the
microelectronics industry has revolutionized the methods and the pace with which scientists can
perform experiments and analyze results. For example, the advances in computational power
using new sequence analysis techniques led to reduction on the expected time it took to map the
human genome (Casey, 1999). Inkjet technology has enabled tissue engineers to effectively print
"skin" (Boland et al., 2003). Laser scanning confocal microscopy has allowed scientists to
generate clear three-dimensional views of cells (Pawley, 1995). Each of these successes is due to
the fact that a multidisciplinary approach was taken to unite the best of all three fields.
In the field of regenerative medicine, there is a need to develop technologies that can increase the
overall efficiency of expanding cells in culture and in complex heterogeneous arrangements
necessary for tissue formation. Inter-cell signaling from a three-dimensional arrangement and
proper placement of key cell types and support matrix is necessary to create a viable coherent
structure that can mimic the tissue type it is designed to replace (Liu et al., 2002). Understanding
what cell types to use, which configurations work, and what signaling has to take place requires
researchers to perform many experiments and develop novel methods to recreate ex-vivo
conditions, gather data, and finally disseminate that data in a meaningful way. Working on the
cellular level is problematic for the research scientist since cells are on the order of 10
micrometers. Robotics assisted cell manipulation can solve the challenge of manipulating single
cells, but is still in its early stages of development. The technologies for long-term live cell
imaging have, until recently been tedious and user intensive for experimenters to setup and run.
Only in the past year have commercial solutions been available that provide high throughput high
content live cell screening as opposed to fixed-cell assays. Currently, these products offer mostly
“canned” (packaged) algorithms or conventional cell assays that may be good for commercial
operations but not as useful for research scientists and engineers who are trying to develop new
1
experiments and techniques. The present thesis investigates a middle ground approach where
technologies from the fields of automated microscopy, robotics, and computer imaging can all be
used to enable high throughput long-term live cell experiments at the research level.
The objectives of this thesis was to design and develop an imaging system to provide automated
microscopy and live cell robotic micromanipulation to enable researchers to gather large-field
long-term live cell data. This system should provide a fully integrated graphical software suite
from which to define and conduct automatic time courses, perform robotic pick-and-place
operations, and ultimately to view and export data for further processing as needed. Furthermore
it should be equipped to gather image mosaics at one or more regions of interest, each mosaic
consisting of one or multiple images in three-dimensional space with up to six possible
illumination modes through time.
A modular approach was taken to ensure that as each feature was added it could easily be
removed or upgraded without compromising the rest of the design. The stability of the system in
terms of hardware and software was deemed to be of paramount importance. Therefore, while
the imaging system was still in development, it was decided to use it on many of the live cell
experiments that were being conducted in the Jervis laboratory. The impact of the system on
these experiments and vise-versa helped shape its final outcome and application in the field of
cell biology.
In this work, a brief introduction to light microscopy is presented. Then, a full literature review
is presented on the state of the art in automated microcopy for long-term live cell imaging as well
as recent advancements in photonics and robotics for this application. After this, the problem
statement is defined and the name “Bio-Assembly Mosaic Builder and Informatics system”
(BAMBI) is introduced to describe the system to be designed and developed. The BAMBI
design is then described first in terms of hardware and then software. BAMBI has been used in
several studies in cell biology and these applications are presented and the results are discussed.
Finally, the merits of BAMBI are discussed along with conclusions and recommendations for the
future.
2
Chapter 2
Background
2.1 Light Microscopy
The light microscope has been one of the single most important tools for making scientific
discoveries since its invention around the late 16th and early 17th century. Since that time,
scientists have developed different microscope configurations and new ways to contrast light
through specimens. Many tools have been built to complement the microscope such as automatic
shutter control, charge-coupled device (CCD) image capture, and focus control. The compound
microscope, the most common in use today, uses several lenses to achieve the magnification. A
further revision, the inverted compound microscope, places the objective lens below the
specimen rather than above as in traditional systems. This is the preferred method for long-term
live cell imaging as it allows the specimen to be placed on the far side of the glass slide instead of
between the objective and the slide. This configuration allows much more room for the cell
culture environment and additional instruments. For an excellent review of light microscopy see
Fundamentals of Light Microscopy and Electronic Imaging (Murphy, 2001).
2.1.1 Fundamental Definitions
A brief review of imaging fundamentals is presented to enhance the appreciation for the
constraints imposed on system automation.
2.1.1.1 Numerical Aperture
The numerical aperture (NA) of an objective lens is defined by the angle of the light cone
accepted by the objective lens and thus it is directly proportional to the ability of the lens to
gather light into a resolvable image. It is dependant on the curvature of the lens closest to the
glass slide and the index of refraction of the lens material. Generally, higher NAs are desired
since they can achieve the better resolution. The greater the incident angle of light on the focus
plane the greater the numerical aperture and the better the resolution. A drawback to having high
NA is that it requires greater optical correction to account for spherical aberration and chromatic
diffraction. High NA lenses also have limited depth of focus and thus place more stringent
requirements on the precision of focus.
3
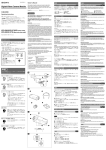
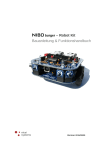
2.1.1.2 Working Distance
The working distance is defined as the maximum distance allowed an objective between the
outermost lens surface and the surface of the specimen slide or coverslip while maintaining a
sharp focus (Figure 1). In the inverted microscope position the working distance is shortened by
the thickness of the specimen slide. Generally, working distance is inversely proportional to the
NA of the objective lens.
Specimen
Focus Plane
Working
Distance
Description
and
Specifications
Microscope
Objective
Figure 1: Working Distance for an Inverted Objective
A 10x inverted objective is shown below a specimen slide to illustrate working distance.
2.1.1.3 Depth of Field
The depth of field is defined as the longitudinal resolving power of the objective. It can also be
described as the distance from the nearest object plane in focus to that of the farthest object plane
simultaneously in focus. Depth of field is only determined by NA where the greater the NA
value the narrower the depth of field. The range of values for the depth of field is on the order of
micrometers and can also be thought of as the minimum thickness of optical sections that can be
attained.
4
2.1.1.4 Field of View
The field-of-view for an objective is the diameter of the resolvable image, field number, in
millimeters as seen at the intermediate image plane. (i.e. it is the maximum diameter of the fieldof-view that can be seen at the rated power). If further optics are employed between the objective
and the observer the field-of-view can be further diminished. Modern lenses can usually attain a
field number around 25 mm.
Field of view can be defined by the following expression:
FOV =
N
M Objective ⋅ M Eyepiece
2.1
Here, FOV is the field of view, N is the field number, and the two terms in the denominator
represent the magnification power of the objective and the eyepiece.
2.1.2 Wide Field vs. Confocal Imaging
Wide field microscopy is generally any method of light microscopy that illuminates the entire
field-of-view of the sample at a time to generate the image. Confocal microscopy operates by
illuminating the sample at a single spot at a time and raster scanning (point-by-point sweep) the
entire field-of-view.
There are advantages and drawbacks to this method. In confocal
microscopy the emitted light is passed from the objective through a small pinhole usually placed
in front of a PMT detector. Because the pinhole aperture rejects most of the excited fluorescent
signal arising from above and below the focal plane, a laser is typically used for illumination.
This actually reduces the point-spread function of the objective lens and can increase the
practical resolution by a factor of about 1.4 (White et al., 1987). The light beam is usually
directed onto the back aperture of the objective lens by a small mirror that can oscillate back and
forth to rapidly scan the field of view.
This takes more time, up to several seconds, to generate
one field-of-view since it involves electromechanical motions to gather the image. One of the
most important advantages of confocal microscopy is in the three-dimensional image acquisition.
Three-dimensional confocal images are significantly less defocused by the images in the optical
layers above and below and can be used to create 3-D representations of the sample. Despite the
benefits of confocal imaging, its usage is still limited in research due to the prohibitive cost and
5
increased acquisition time for experiments. For a complete review of confocal imaging see
Handbook of Biological Confocal Microscopy (Pawley, 1995).
2.1.3 Differential Interference Contrasting
Differential interference contrasting (DIC) is a form of "optical staining" used to add more
contrast to otherwise hard to view transparent specimens when seen in bright field microscopy.
This optical staining is achieved by first polarizing then splitting the light path from the lamp,
allowing the beams to pass through the specimen, and finally polarizing and recombining the
light to form an interference image. The light is first polarized to only allow light vibrating at
single angle through to a special prism. The prism splits the light paths into two beams slightly
separated where one beam is polarized 90º perpendicular to the other. As the light beams pass
through the condenser they are both redirected in parallel but slightly apart toward the specimen.
Since each one travels a slightly different path due to varying specimen thickness, slopes and
refractive index they will have slightly different path lengths. However, the beams cannot
interfere because they are vibrating in perpendicular to each other. After light is collected by the
objective it enters another prism where the path difference and the shear are removed. Finally
traveling through an analyzer depolarizes the beam and the optical paths are allowed to interfere
with one another on the way to the observer. This results in images that have varying shades of
contrast creating a pseudo three-dimensional relief of the specimen. For a complete review of
DIC imaging, see Optical Imaging Techniques in Cell Biology (Cox, 2006).
DIC images tend to be sharper and have excellent resolution. The optical image sections seen
through DIC are also somewhat less affected by the planes above and below the focal plane.
Additionally, DIC cuts down on the amount of light passed through the specimen relative to the
bright field approach thus reducing phototoxicity and maintaining cell viability during long-term
live cell imaging.
2.1.4 Fluorescence Imaging
Fluorophores can absorb specific wavelengths of light and re-emit that energy as light at a
slightly longer wavelength in all directions. Fluorescence imaging in microscopy takes advantage
of the fluorescent properties of some inorganic and organic molecules that act as fluorophores to
image specific targets or binding sites in a specimen. Used as a tool in biomedical sciences,
fluorophores can be attached to specific antibodies or other ligands that in turn attach to specific
6
binding sites within the specimen. A similar approach can also be applied genetically when the
gene for a fluorescent protein such as green fluorescent protein (GFP) is inserted into a cell
(Chalfie et al., 1994). By introducing several different colored fluorophores multi-fluorescent
images can be taken to image different targets simultaneously. The most common method to
image fluorescent molecules in microscopy is by epi-fluorescent illumination (Figure 2).
Specimen Slide
Objective
Aperture
Fiber Optic LED
Beam Collimator
Dichromatic Mirror
Excitation Filter
Emission Filter
Filter Cube
CCD Camera
Figure 2: Epi-Fluorescent Illumination
The light path for epi-fluorescent illumination using an inverted microscope and LED source is shown. The
light is collimated and passed through a diameter-controlling aperture. The excitation filter blocks all light
except the required wavelength. The light that has the excitation wavelength is reflected 90º through the
objective and onto the specimen. The light emitted by the specimen travels back through the optical pathway.
The emitted light is transparent to the dichromatic mirror and passes through to the emission filter where any
stray wavelengths are rejected. The CCD camera collects the final emitted light.
Here the illuminating light source is generated from a light emitting diode (LED) and is carried
by fiber optics to the back of the microscope. The light beam is aligned center on the input
condenser and passes through a series of filters and then finally through a diameter-controlling
aperture. The light beam then enters the filter cube wherein a dichromatic mirror reflects the light
upward through the objective where it is focused on the specimen. The fluorophores in the
specimen absorb and re-emit the light in all directions. Some of the emitted light travels back
7
down the beam path of the objective and re-enters the filter cube where it is transmitted through
the dichromatic mirror onto the CCD detectors. The dichromatic mirror is manufactured so that it
reflects light at a specific wavelength, the excitation wavelength, and transmits light at a slightly
longer wavelength, the emission wavelength. This helps to separate the excitation light from the
emission light so that emitted fluorescence will be imaged. The excitation and emission filters
are optional components designed to further filter the specified wavelengths from entering or
exiting the filter cube and serve to reduce background signal from the excitation source.
2.2 Digital Imaging for Light Microscopy
A key requirement for digital imaging in microscopy is efficient and accurate CCD collection of
emitted photons. This means that the camera system must provide effective temporal, spatial,
and quantization resolution as well as an aspect ratio best suited to the objective field-of-view. It
must be able to sense light in the full visible spectrum including near infrared for conventional
light microscopy and sometimes ultraviolet for other experimental studies. The camera must also
exhibit fairly low noise levels when sensing light as almost all light microscopy used for live cell
imaging requires that the illuminating light energy be as low as possible so as to not damage the
cells.
CCD cameras use a charge coupled device array in which each sensor (pixel) captures the value
of incident light energy by storing it as energy potential. These values are digitally gated off the
CCD array one line at a time to form an array of digital values representing the energy potential
at each pixel (Forsyth et al., 2003). The process of digitizing the coordinate pixel values is called
sampling and the process of digitizing the amplitude values is referred to as quantization
(Gonzalez et al., 2002). The pixels themselves can be arranged in patterns red-green-blue (RGB)
for color sensors or ultraviolet-black/white (UVBW) for extended range sensors or simply as full
range monochrome black/white (BW) sensors.
The CCD sampling resolution is related to the size of each sensor. Usually the sensors are square
and have the same dimension in x and y. Cameras used in digital microscopy have values that
can fall in the range of 4 to 6 µm per sensor or pixel. A 10mm x 10mm CCD array with square
sensors measuring 4.65 µm would be able to generate a maximum resolution image of 2150 x
2150 pixels. It is important that a camera be able to image the entire field-of-view as seen by the
objective to minimize loss of information. If an objective lens with a 25 mm field-of-view were
imaged directly onto a camera CCD with no other intermediate lenses, the CCD array has to be
8
25 mm x 25 mm to capture the entire field of view. In fact, given a 25 mm field-of-view for most
objectives, it is common to introduce a 0.6x adapter lens between the camera and the objective,
thus reducing the required size of the CCD array to only 15 mm x 15 mm.
An additional consideration pertaining to light microscopy is the fact that the optical resolution
also called spatial resolution is limited by the wavelength of the light itself. For an optical
microscope, the minimum resolving distance is shown to be:
R=
1.22λ
2 NA
2.2
Here R is resolving power, λ is the wavelength of light used, and NA is the numerical aperture of
the objective lens (Inoué, 1986). The smallest resolving distance for normal light microscopy,
known as Abbe’s Limit, is observed at a wavelength of about 220 nm giving a distance of 0.11
micrometers. Given that one must have two samples for every unit of the smallest observable
unit to satisfy Nyquist’s Theorem and insure no loss of information. (Forsyth et al. 2003) It
becomes apparent that it may be possible to over-sample the image providing no additional
information. This would unnecessarily introduce more damaging light to the cells and increase
the data storage size necessary. For example, if light with a wavelength of 505 nm was used with
a 40x objective lens with a NA of 0.75 and no additional optics between the camera and the CCD
array, the minimum pixel size should be no less than 8.4 µm. Once again, by inserting a 0.6x
camera adapter between the CCD array and the objective, the smallest pixel size needed becomes
5.0 µm and the field-of-view is effectively increased by a factor of four.
The final properties important for digital microscopy are quantization (the value assigned to each
level of gray) and binning (the number of neighboring light sensors to sum together to generate
one pixel value). In the CCD Camera, the bit depth used for the conversion of the CCD potential
to a digital value determines the quantization resolution. The common range is between 8-bit,
256 shades of gray, to 16-bit, 65,536 shades of gray, per pixel. Binning modes are made available
by the CCD camera and are usually of the form n x n with n being either 1 or 2.
Binning becomes important for fluorescence microscopy where the emitted light is extremely
faint and must compete with the noise level to overcome the sensitivity threshold of the CCD
9
sensors. The relative sensitivity of the CCD camera is dependant on the wavelength of light used,
the total magnification, and the total surface area of the CCD neighborhood used per pixel.
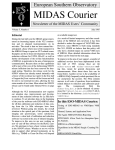
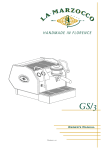
The response curve presented in Figure 3 shows the non-linear response of the BW CCD to light
energy ranging from near ultraviolet (400 nm) into the infrared (≥700 nm). The CCD is most
sensitive in the blue-green region at 505 nm falling off moderately in either direction. The fact
that the response curve is still sensitive at wavelengths greater than 700 nm emphasizes the
camera's sensitivity to the additional infrared energy or heat that can add noise to the final image.
1
Relative Response
0.8
0.6
0.4
0.2
0
400
500
600
700
800
900
1000
Wavelength [nm]
Figure 3: Spectral Sensitivity for Sony XCD-SX910 BW Camera
Shown, is the spectral sensitivity of the Sony XCD-SX910 BW camera for a selected wavelength range. The
range of the human visual spectrum (400 to 700 nm respectively) is shown in color. Adapted from the Sony
Technical Manual for the XCD-SX910/X710 (2003).
The amount of light incident on a CCD sensor is proportional to its surface area and the binning
mode. Increasing the binning mode from 1x1 to 2x2 would increase the sensitivity of light by a
factor of four. There would be a trade off between image resolution and sensitivity but the images
capture would exhibit a much better signal to noise ratio in the 2x2 binning mode.
10
The magnification and NA has a significant impact on the amount of light focused onto the CCD
array and must also be considered when choosing the binning mode and quantization level.
Higher NAs will collect more light than lower numerical apertures thus increasing the quality of
the sampled image to the fourth power of the NA.
A higher magnification is inversely
proportional to the amount of light received to the second power. Generally objectives over 20x
used for fluorescent microscopy are of the very high NA variety.
2.3 Automated Microscopy
Automated microscopy is a new tool, fueled by the progression of the microelectronics industry
and the need for researchers to push the limits of conventional microscopy. It includes motorized
microscope components and accessories to automate the image capture of time-lapse
experiments. Z-stacks, a series of optical sections, attained by focusing through a depth range,
can be captured automatically with the addition of a focus motor. A z-axis motor with the
appropriate software control can allow for correction of microscope focal drift that occurs during
time-lapse experiments. A large set of single fields-of-view can be captured and tiled together to
form a continuous image or mosaic by the incorporation of an x-y motorized stage. Multi-spectral
time courses can be acquired with motorized illumination such as a shutter or filter wheel. All of
these features may have an individual software package to control them but the hardest part is
building a single software program to make them all seamlessly work together. The nature of
long-term live cell imaging requires long run times and the program should be able to operate
unattended.
2.3.1 Stage and Focus Automation
The most basic requirement of automated microscopy is the motorized stage and focus control.
This will enable the microscope to image areas greater than the field-of-view of the objective by
moving from one location to another in the same sample or possibly even across samples from
one specimen to another. Many microscopes manufactured for life sciences are designed to
support motorized x-y stage control. The microscope manufacturer usually provides this feature
as an optional accessory, but it can also be acquired from one of the many after market
companies that cater to this need. Almost all stages used in wide field microscopy are designed
to move the plate, well, or dish containing the sample while the microscope is held stationary.
This allows the sample to be translated through the focal point of the objective as desired. The
maximum range of x-y travel will place a limit on the size of plates that can be imaged by the
11
microscope and can range from 25 mm to 180 mm respectively. Table 1 shows the specifications
of several well-known manufactures of motorized stages and z control options.
Table 1: Comparison of different commercially available automated stages and focus
controls for microscopy.
Manufacturer
Device Name
Applied Scientific Instrumentation MS-2000
Automation
Motorized XY Stage
Z-Focus Knob
Ludl
Physik Instrumente (PI)
XY
Travel Range
Z
*
Precision Precision
*
(mm)
0.8 µm
-
114 x 90
-
0.1 µm
-
3 µm
-
100 x 120
BioPrecision
Motorized XY Stage
Piezo Z
Piezo-Z Stage
-
1 nm
0.2
Z-Control
Z Focus Knob
-
0.15 µm
-
P-725
Peizo Objective
-
1 nm
0.4
XYZ M112
Motorized XYZ
0.1 µm
0.1 µm
25 x 25 x 25
-
1.5 nm
100
0.1 µm
-
25 x 55
Motorized Z Stage
-
0.1 µm
1
H120
Z Focus Knob
-
0.1 µm
-
H107
Motorized XY Stage
1um
-
180 x 69
Stage
Zeiss, Germany
Cell Observer HS Piezo-Z Stage
Applied Precision International
NanoMotion II
Prior Scientific
Motorized XY Stage
*
Precision - The variation of repeated efforts to maintain the same position over a long time, also defined as
repeatability.
Most manufacturers, but not all, will incorporate the motorized z-axis as a separate unit from the
x-y stage. The most common configuration is to have it attached directly to the microscope fine
focus control knob. By rotating the focus knob, usually with a stepper motor, a very accurate
relationship between the focal plane and the rotation of the motor can be established. Here the
resolution of the focus movement is limited to the fixed value of the stepper’s magnetic windings
allowing sub micron increments for a known rotation step. Given some backlash in the gear
assembly and the setup of the focus control inside the microscope, repeatability remains sub
micron. An added benefit of using the focus knob is that the alignment of the z motion relative to
the axis of the objective assembly will be as good as the focus alignment of the microscope. If a
servo drive is employed instead of a stepper motor, the user can expect to see improvements in
the speed of the focus knob as well as less vibration but an auxiliary encoder must be used to
accurately determine the position of the z value. In either case, the range of z motion is only
12
limited to the maximum physical distance between the objective and the sample slide (working
distance).
Z-axis automation can also be achieved by having the unit attached as an additional stage insert
to the x-y stage or as a telescoping unit placed between the microscope and the objective itself.
In either case, the most common method of actuation is via piezoelectric induced motion.
Piezoelectric actuators work by passing a voltage through a stack of PZT crystal disks interleaved
with thin metal sheets, as each crystal receives the charge it expands up to approximately 1.5% of
its original value (Teschler, 2005). This type of actuation is almost instantaneous and can be very
accurate. The only drawback is that these systems have limited travel range. Most actuators of
this type only offer a range of approximately 100 µm, but some newer versions are now offering
ranges up to 400 µm. The increase in travel length is most likely attributed to the addition of an
actuation-multiplying device, similar to a lever (Teschler, 2005).
2.3.2 Automated Illumination
The reasons for automating illumination in microscopy are governed by the information
requirements of each study.
Bright field, DIC, and phase contrast studies generally use a
tungsten halogen lamp to provide the source of illumination. In an epi-fluorescent study the
source could come from a laser system, a broad-spectrum arc lamp, or a light emitting diode.
Confocal applications usually employ a single laser to excite the specimen at any one time, but
can include several lasers of different wavelengths. Obviously the confocal application has
control built into the system as it is required in order to raster scan the entire field-of-view, but
the other systems are usually after-market additions. Halogen lamps such as the tungsten or the
broad-spectrum arc lamps are not designed to be turned off and on repeatedly and need a shutter
mechanism to block the light when it is not needed. Recently, the need for automated shutters
has increased to the point that manufacturers are now including this as a standard feature. An
automated shutter is now a standard on the latest version of the Axiovert 100M microscope
manufactured by Zeiss, Germany.
Multi-spectral fluorescent experiments that require images to be taken at different wavelengths
can use a filter wheel to block out unwanted light only allowing the excitation spectrum through
as would be the case when illuminating with a broad spectrum arc lamp. The biggest caveat to
using a broad-spectrum light source is handling the deflection of the heat safely. Most broad
spectrum light sources, Mercury, Xenon, and Metal Halide, emit infra red light that is absorbed
13
by the excitation filters causing a great deal of heat to build up. Over time the shutters can
breakdown and stick if methods of heat deflection are not employed. A solution to the problem
is to use a fiber optic light path that can excite at the desired wavelength without causing heat
damage (Carpenter et al., 2004).
Light emitting diodes only require a digital logic high or low signal to turn them on or off thus
eliminating the need for a shutter. Most LEDs emit light in a specified narrow band wavelength
thus reducing the need to implement additional band reject filters. They generate significantly
less heat than the traditional broad-spectrum arc lamps and have much longer working lifetimes.
Laser light sources are similar to the LED illumination sources in that they emit light in a
relatively narrow bandwidth thus reducing the need for additional heat filters. However, lasers
can pack a lot more power and must be carefully controlled to avoid effects like cell damage and
photo-bleaching from occurring.
2.3.3 Autofocus
In any automated microscopy application, the need to have a robust autofocus system is of great
importance especially for any long-term live cell imaging experiments. The need for focal
correction arises from unwanted focal drift, a change in the distance between the objective and
the desired in-focus plane. The cause of drift can be attributed to temperature gradient,
mechanical relaxation, cell movement, or sample settling. Temperature gradients caused by
differences in temperature between the stage, microscope, motors and their respective
surrounding environments can have a significant effect on the distance between the objective and
the desired in-focus plane (Wolf et al., 2005). During live cell time course experiments the cell
sample and sometimes the microscope itself must be held at a constant temperature, usually 12 17º above the ambient room temperature.
Therefore, to overcome these issues, autofocus control must be implemented for automated
microscopy systems involving any long-term live cell imaging. Price and Gough breakup
autofocus techniques into two major categories (Price et al., 1994): positional sensing and image
content analysis. Positional sensing could use an interferometric approach such as Molecular
Devices Corp.'s ImageXpressMicro™ system that employs a laser to focus light on to a planar
surface such as the bottom of a glass slide or cover slip. Another method could also use a digital
micrometer between the microscope stage and the objective to report any changes that occur over
time (Wolf et al., 2005). An image content analysis solution would employ a software algorithm
14
to generate an optimum focal score for each image sampled in the range of focus. Image content
may be analyzed using a closed circuit video feed (Johnson et al., 1974) where high energy in the
video signal is used as measure of in-focus (Groen et al., 1985). Image content can be converted
to digital form by means of a frame grabber or directly with a CCD camera and then analyzed for
a focal measure as well.
Image content analysis is cost effective and relatively easy method to implement, as it requires no
additional hardware other than focus control hardware and a CCD camera for image feedback.
Therefore, this section will focus on the various applications of software algorithms used in
conjunction with a focus control motor. An image content analysis solution or software solution
in general, uses the digital camera to capture images as input to an algorithm that will then
generate an in-focus score for each image. By capturing the images through a range of focal
values, it can be used to select the best in-focus image and its corresponding Z position. Many
different autofocus methods have been employed to varying degrees of success in the literature.
(Groen et al., 1985; Firestone et al., 1991; Geusebroek et al., 2000). However, robust autofocus
has been shown to be very difficult to achieve in practice.
The problems faced by autofocus algorithms can be summarized by the criteria in which they are
evaluated. Groen establishes eight criterions used in the selection and evaluation of focus
functions (Groen et al., 1985): (1) "Unimodality." There should be no regions of local maxima
or minima other than one. Exhibiting multimodality shows that the algorithm is sensitive to other
factors that may lead to false maxima. In practice, unimodality cannot be guaranteed (Price et al.
1994) but can be reduced by employing less noisy algorithms. (2) "Accuracy." The maxima must
be located at the in-focus plane. (3) "Reproducibility." The maxima must be reproducible and
sharply peaked. Generally this can be achieved once the results are normalized. (4) "Range." The
range focal distances through which the focus function operates should be as large as possible.
As the range increases so does the capture time. By incorporating various sampling algorithms,
this can be optimized for speed (Geusebroek et al., 2000). (5) "General applicability." The
function should not be limited to the type of images collected. Significant differences in the
performance of algorithms often exist between phase contrast and fluorescent imaging (Price at
al., 1994). (6) "Insensitivity to other parameters" such as noise, scratches and changes in lighting
conditions. Price has shown that lamp fluctuations can give rise to intensity spikes resulting in
false local maxima (Price et al., 1994). (7) "Video signal compatibility." This is an issue relating
to closed circuit video cameras which can be overcome by using any of the commonly available
CCD cameras on the market. (8) "Implementation. The system must be easy to implement."
15
Here the software autofocus algorithms are generally the easiest to implement due to the
digitization of the modern microscope systems.
2.3.4 Environmental Control
Maintaining live cells in culture for automatic microscopy requires that special operating
conditions are met while simultaneously allowing optical imaging to take place. This can include
conditions such as light transmissibility, temperature, CO2, pH level, sterility, and osmolarity.
Numerous cell culture chambers with widely varying designs have been introduced to meet these
needs. They can be boxed compartments that fit over all or only part of the microscope or small
chambers designed to fit between the light source and the objective lens.
One of the earliest closed perfusion chambers cited in microscopy literature set the standard for
controlled cell incubation chambers for years to come (Dvorak et al., 1971).
They also
introduced eight desirable design characteristics to have for high-resolution light microscopy of
cell culture chambers: (1) "Usable with all light microscopy techniques." This requirement meant
that the chamber have optically transparent, flat, parallel surfaces with a thickness not exceeding
1.2 mm. This would allow high numerical objectives with short working distances to be used
with bright field, phase contrast, and differential interference contrast microscopy. (2) A "closed
system." This meant that the culture chamber was safe to handle and immune to pathogens. (3)
"Sterilizability."
The chamber should be able to be easily sterilized before and after an
experiment. (4) "Made from biological inert and non-toxic materials." (5) Designs that allow
"rapid cleaning and assembly." (6) Ability to remove the chamber from the microscope and relocate it with a fixed reference point. (7) Allowed for "long-term maintenance" of the cells. (8)
Allow "rapid exchange or replacement of culture media." The problem with characteristic 2, a
closed system, is that researches are not able to manipulate the cells once the experiment has
begun. This was solved by the introduction of cell culture chamber with a thin gas permeable
layer that floated on top of the cell culture medium (Ince et al., 1983). Ince's group designed a
cell culture chamber that could be used on a microscope that facilitated the automated control of
temperature, pH, sterility, and osmolarity of the environment while still allowing free access to
the cells. The top lid consisted of a layer of non-toxic mineral oil with heated gas flowing
directly over it. The gas flow served a dual purpose allowing it to maintain gas pressure as well
as heating the culture to the maintenance temperature. Nowadays, there are many companies that
offer long-term live cell imaging chambers for researchers such as Bioptechs Inc. (Butler, PA),
16
Life Imaging Services (Reinach, Switzerland), Biocrystal Ltd. (Westerville, OH), and Invitrogen
Corp. (Burlington, ON).
2.3.5 High Content Screening
High content screening, first introduced commercially by Cellomics Inc. (Pittsburgh, PA) in
1997, has had a major impact in the field of cell biology and lately systems cell biology. The
term "high content" refers to the large amount of information that is contained in the images
collected by fluorescent microscopy, either confocal or widefield. The term "high content
screening" (HCS) refers to the high content microscopy with the addition of the automation and
analytical techniques that have traditionally been used for protein analysis, mass spectroscopy,
transcription profiling, and DNA microarrays.
HCS is generally limited to fluorescence
microscopy due to lack of specific markers and algorithms to characterize bright field, phase
contrast, or DIC images but some HCS providers do include this option for context reference.
The range of applications that can benefit from HCS is growing and improved software,
visualization tools, and biological markers are driving this technology into the future. The authors
Gough and Johnston provide an excellent review of HCS in "High Content Screening: A
Powerful Approach to Systems Cell Biology and Drug Discovery" (Taylor et al., 2006). The rest
of this section owes much of its merit to their work.
HCS platforms are distinguished by their ability to perform fluorescence based cell analysis in an
integrated and automated system that can screen upwards of tens of thousands of samples a day.
Gough and Johnston provide a list of five specifications that all HCS systems should have: (1)
Sufficient resolution and sensitivity to capture the cellular features of interest. (2) A field-of-view
large enough to image multiple cells. (3) Spectral channels to distinguish multiple fluorescent
labels. (4) Adequate speed to meet the demands of the screening volume. (5) Flexibility to access
a wide range of assay requirements.
At the time of Gough and Johnston's review, 2006, most HCS platforms had only been developed
for fixed cell assays or histological assays in that only fixed cell(s) could be assayed. Assays such
as these have no temporal connections thereby leaving a lot out of the picture and can even lead
to false conclusions (Pepperkok et al., 2006). By having HCS platforms that can provide longterm cell maintenance, these problems can be overcome. In the past year companies seem to have
caught on to the trend toward high content screening of live-cell cultures and now, more often
than not, include long-term live-cell maintenance as a standard feature. (See Table 2.)
17
All HCS systems are designed to provide fluorescence imaging, whether it be widefield optics
with rotating emission bandpass filter wheels or multiple confocal lasers scanning in parallel. In
the widefield modality, the system will have a broad range of commonly available filter sets
allowing for many different wavelengths. In the laser scanned confocal case the system is
limited to the wavelength of the laser installed in the system. However, these systems may
provide up to three or four lasers, each with a specific wavelength that can be operated in
simultaneous acquisition mode. GE Healthcare incorporates a rotating pinhole disk or Nipkow
disk to scan the image confocally while using a broadspectrum lamp with a filterwheel allowing
for a greater range of fluorescence than the laser method. Other systems have multiple cameras
to acquire images in parallel thus reducing the time required for the single channel variety.
Gough and Johnston make an arbitrary distinction between high-throughput high-content (HTHCS) and HCS systems by the capacity they have to screen wells. A HT-HCS should be able to
image in excess of 50,000 wells a day.
There are three such systems, INCA 3000 (G.E.
Healthcare), Opera (Evotec), and ImageXpress ULTRA (Molecular Devices) that are HT-HCS
systems and are compared in Table 2. They are characterized by having multiple cameras
providing three to four channels for simultaneous acquisition. However, careful attention must be
made by the experimenter so that there is no crosstalk or spectral overlap between the reporter
labels. This is a known problem with near UV excited fluorophores like DAPI and Hoechst DNA
labels.
Table 2: Comparison of selected high-throughput and high-content screening systems
System Name
Throughput
Manufacturer
Imaging Modality
Autofocus
Live/Fixed Cell
Imaging?
ImageXpress
5000A
cellWoRx
KineticScan
ArrayScan VTI
IN Cell Analyzer
1000
BD Pathway HT
IN Cell Analyzer
3000
Opera
ImageXpress
ULTRA
HCS
Molecular Devices
Widefield
Software, Laser
Fixed, Botha
HCS
HCS
HCS
HCS
Applied Precision
Cellomics
Cellomics
G.E. Healthcare
Widefield
Widefield
Widefield
Widefield
Software
Laser
Software
Laser
Fixed
Both
Both
Fixed
HCS
HT-HCS
B.D. Biosciences
G.E. Healthcare
Nipkow Disk
Confocal
Software
Laser
Both
Both
HT-HCS
HT-HCS
Evotec
Molecular Devices
Nipkow Disk
Confocal
Laser
Laser
Fixed
Both
a
Optional Component.
18
HCS and HT-HCS are still new technologies and rely on strict protocols to be used for their
reliable operation. Research is driven by novel configurations and setups that are challenging to
automate, thus only a few applications of live cell microscopy can be performed on these
systems. Some systems offer an open software architecture allowing the user to create custom
modules that can be added at a later time.
2.3.6 Automated Microscopy Software
One of the most important parts in employing automated microscopy is having software that can
effectively orchestrate the image/data acquisition, visualization, and analysis (Taylor et al.,
2007). The design and implementation of such software is a very demanding problem, especially
for live cell imaging. A number of recently developed biological assays have lent themselves
well to automation and as a result there are many software choices out there to choose from.
However, products can range from open source highly unspecific yet customizable to all-in-one
commercial software packages that are very specific in application and hard to customize.
Researchers must select the software that best matches their requirements, but in the end there is
always an inevitable trade off between customizability and functionality.
Automating the process of live cell imaging is an especially demanding task as it must be able to
adapt under dynamic conditions. As the science progresses, new and more complex assays are
being developed all the time, which require new algorithms and procedures to be implemented.
Live cells studies may require the ability to focus on a region of interest (ROI) at one moment
and then move to a different ROI at a later time. This is especially important when ROIs are
mitotic cell divisions or the assay incorporates live cell tracking. Another confounding factor is
that in most high throughput systems it is not possible to make modifications after the experiment
has started (Pepperkok et al., 2006).
It is important to quantify the features that are required for automatic microscopy software.
Automated image analysis should incorporate image segmentation of regions of interest,
classification of those regions, and tracking of the regions desired (Pepperkok et al., 2006). The
analysis software should be intuitive and user friendly, provide a real time display of the analysis
results, and provide the tools to visualize, manipulate, and compare the data (Taylor et al., 2007).
The data and images acquired should be stored and made available in a relational database
structure (Andrews et al., 2002). Most literature sources stress the importance of image analysis
and data mining over the actual acquisition capabilities.
19
A comparison of software solutions is presented in Table 3. The software programs are rated in
five categories for comparison. Throughput - the throughput needed for the application it is
intended for. Research applications generally require no more than 50,000 images a day, but they
can be installed on a conventional automated microscope. Acquisition - the ability to control the
hardware for automatic data/image capture. Analysis - the ability to process the data and images
collected. This is the first step in quantifying results. Database - the ability to store the images
and data in a relational database. This is important for running queries based on any results from
the analyses to provide the researcher with a fast tool for new discoveries. Customization - the
degree to which the program functionality can be altered. Some programs are inflexible and are
designed for a specific purpose. Add-on software modules may allow for a larger range of
applications but do not add to user customization. Macros and batch processing may not add
customization to the applications, but will add to the ease of automation. Open source code,
specific programming toolboxes, or incorporating programs like MATLAB actually enable the
user to add new functionality to the program as needed. However, the more flexible the software
programs the more demanding it can be for the programmer to implement it (Lamprecht et al.,
2007).
Table 3: Comparison of selected automated microscopy software programs
a
Software Title
Throughput
Application
Manufacturer
Acquisition
Analysis
Database
Customization
Cellenger
HCS
Definiens
No
Yes
No
No
BioApplications
HCS
Cellomics
No
Yes
No
No
KineticScan
HCS
Cellomics
Yes
Yes
No
No
CellProfiler
HCS, Research
Open Source
No
Yes
No
MATLAB
BioConductor
HCS, Research
Open Source
No
Yes
No
R
ImagePro Plus
IN Cell
Investigator
HCS, Research
MediaCybernetics
Yes
Yes
Yes
HT-HCS
Yes
Yes
No
MetaXpress
HT-HCS
Yes
Yes
Yes
Macro
MetaMorph
HCS, Research
G.E. Healthcare
Molecular
Devices
Molecular
Devices
Macro
Language
Toolbox
Yes
Yes
No
Macro, VBc
ImageJ
Research
Open Sourced
No
Yes
No
Javae
AxioVision
Research
Carl Zeiss
Yes
Yes
Yes
Batch, VBA
b
c
a
b
Requires MATLAB and image processing toolbox. R programming language. Microsoft's Visual Basic
programming language. d National Institutes of Health. e JAVA programming language. f Microsoft's Visual
Basic for Applications.
20
f
2.4 Cell Manipulation
Some long-term live cell imaging experiments require the ability to manipulate cells directly.
This may be to establish clonal colonies from a single cell, arrange cells in a specific pattern that
mimics the cell structure in-vivo, or re-implant cells in a host after live cell imaging. Tissue
engineers need to be able to work with small population sizes in order to create a structure that is
just as intricate and diverse as the naturally occurring tissue and yet still be able to produce a
large enough cell density in the order of one million cells per cubic centimetre to be useable.
Automated cell manipulation may solve the challenge of overcoming large population sizes but it
still in its early stages of development. There are many different methods of cell manipulation
already developed that may or may not be suitable for single cell manipulation. Several
technologies that show promises in the field of cell manipulation are cell based printers, optical
manipulation, dielectrophoresis, photopatterning, and microfluidics.
2.4.1 Ink-jet Cell Printing
Commercial off-the-shelf ink-jet printers have been successfully modified to print organic
materials and cells onto solid supports (Boland et al., 2003). This technology enables the
patterning of microarrays for uses such as protein, antibody, and DNA combinatorial reaction
studies. It can also be used to pattern cell libraries and cell arrangements that may mimic the
actual respective organ or tissue to be replicated.
The system employed by Boland and Wilson consisted of a modified Hewitt Packard 500 series
ink-jet printer that was broken out of the casing and mounted on a glass sheet that was in turn
mounted on a wooden frame (Boland et al., 2003). For cell printing, the standard ink cartridges
were replaced with a custom built 9-needle (30 gauge) version that was fed from nine separate
compartments. This allowed the print head to accommodate up to a maximum of nine possible
cell solution/substrate combinations. The print head is mounted onto a bar and is allowed to
move width wise across the surface of the glass. A second bar and wheel assembly provides the
lengthwise motion of a sample overtop of the glass surface. The sample to be ‘written’ upon is a
glass cover slip that is taped to a transparency sheet that is in turn needed to provide the width
surface necessary for lengthwise movement by the wheels.
A custom built graphical user
interface allowed the printer to be easily programmed by providing it with a picture of the array
deposition and a color code for the cell compartments to be used.
21
The ink-jet based cell printer could pattern cells at a minimum of 50 µm between droplets, 1.5
cells per drop, and cover an area of 1 square inch per minute. Using a cell solution of bovine
aortal endothelial cells at 1 x10⁵ cells/ml and printing them on a basement membrane of 3 mg/ml
Matrigel™ they achieved an overall 75% cell viability. The results show that this technology has
some advantages such as having high throughput, low cost components, and being easily
automated.
A challenge for ink-jet cell printing technology is that, although it is automated, it is programmed
in a feed-forward technique that does not allow for real-time quality control feedback that would
be necessary for repeatability of results on the cellular scale. For example, if a cell array were
patterned in one experiment it would be very hard to duplicate the original conditions in
subsequent runs even though it had the same program due to variances in the cell deposition (one
or two cells per droplet). Another challenge for ink-jet cell printing is that it is limited by its
current resolution of 50-µm-deposition pitch. Although on large scales this would not be a
problem, when making tissues that depend on cell-cell adhesion, the distance would be far too
great to overcome without having the cells migrate themselves, which in turn may distort the
desired original construct. More challenges such as needle clogging, cross contamination, and
sterility of the print head will have to be addressed before this technology can be fully realized in
a commercial sense.
2.4.2 Laser Cell Printing
Laser cell printing (Ringeisen et al., 2004; Barron et al., 2004) has been used to generate largescale cell arrays, adjacent arrays of different cell types, and three-dimensional layered cell
patterns. In one experiment, a laser printer known as matrix-assisted pulsed laser evaporation
direct write (MAPLE DW) was used to pattern pluripotent embryonal carcinoma cells (P19) onto
a thin layer of Hydrogel™ (Barron et al. 2004). In another experiment an improved printer based
on the MAPLE DW known as biological laser printing, BioLP, is used to pattern heterogeneous
arrays and 3-D cell layers using human osteosarcoma cells (MG63) and mouse endothelial cells
(EOMA GFP) (Ringeisen et al., 2004).
In MAPLE DW, the system uses a pulsed laser to focus energy just below a cell to vaporize the
substrate causing an explosive gas bubble that in turn ejects the cell forward onto the receiving
medium. The P19 cells were placed in a biopolymer medium at a concentration of 1.5 x 10⁷
cells/ml and spread out as a thin layer onto a 2.52 cm diameter transparent quartz disk. The laser
22
was positioned on the other side and normal to the quartz surface so that it could focus on the
interface between the quartz and the biopolymer. The laser wavelength used in this study was
193 nm and was chosen so that the water contained in the supportive bio-layer mainly absorbed
the laser energy. Using a CCD camera that was pointed confocally with the incident laser light a
user could select the portion of the bio-layer and cells that were to be printed. The receiving
surface for cell printing was a glass slide with a thin layer biopolymer coat. This coating is
necessary to decelerate the transferred biomass, provide support, and a viable growth medium for
the P19 cells. A single pulse of laser energy, approximately 400 mJ/cm2, with a spot size of 100
x 125 mm2 was enough to insure the transfer of about 10 cells at a time. The results of the
experiment showed that the cells were very sensitive to the velocity they were transferred at and
the thickness of the receiving medium. The initial ejection velocities of the cells can range from
50 to 1000 m/s that would cause deceleration values to be too great for cell viability. Hydrogel™
coatings of 40 mm were found to be necessary to provide enough deceleration time to maintain a
>95% viability.
In BioLP™ the system is based on the MAPLE DW™ printing device but makes a significant
change by inserting a barrier between the focal point of the laser and the biomaterial. Other
changes include the ability to write different cell types into heterogeneous arrays and form threedimensional layers. The BioLP set up is as described in the MAPLE DW system above except
that the quartz disk is coated with a thin (35 to 85 nm) layer of metal or metal oxide (Au, Ti, or
TiO2) between the bio-layer and the quartz surface. The barrier absorbs most of the incident
laser energy and in turn transfers energy in the form of heat to the bio-layer containing the cells.
The experiments showed that the BioLP could pattern MG63 cells onto a Matrigel™ substrate
ranging from 50 - 200 mm thick. It could perform multiple transfer operations to seed different
cell types by changing the quartz cell solution disk with a different one containing different cells
and re-registration of the disk to the substrate surface. Using a cell concentration of 3x10⁵
cells/cm2, a laser spot size of 100 mm, and laser fluence energy of 160J/cm2 resulted in 3 - 10
cells placed per 100 mm spot on a 600 mm spaced array. The deposition speed was reported to
range from 15 to 100 drops per second dependant on laser pulse frequency. Cell viability was
reported as being very close to 100% based on a live/dead cell assay. Another experiment
showed that the printer could be used to deposit cells in a multi-layer based pattern by adding
more Matrigel™ to the receiving surface and re-printing.
23
Both techniques of laser printing have the ability to deposit cells at high speed with very good
viability and can be automated with a CAD/CAM system. Cell viability concerns seem to have
been remedied by the BioLP by the introduction of an energy absorption layer. As well, the
problems found in ink-jet printing such as sterility, nozzle clogging, and cross contamination are
not applicable to this ‘non-contact’ method of transferring material.
2.4.3 Acoustic Cell Printing
An acoustic method for printing cells is very similar to the laser printing method in that it uses
focused energy to eject a cell from one surface to another. The difference in the acoustic case is
that sound vibrations produce the energy necessary for transfer. An acoustic printing device has
been developed and used to transfer nanoliter volumes between microplates for possible work on
cell-based assays (Ellson et al., 2003). Other applications claimed by this technology in the
patent literature include ejecting a single cell from a fluid onto a surface for patterning surfaces,
creating arrays or simply for sorting cells (Mutz et al., 2002).
The acoustic cell transfer system consists of a moveable transducer located below a microplate
that contains the solution to be transferred. The transducer can be positioned below a desired
microwell on the plate and then a passed radio frequency energy that it in turn can convert to
sound waves which can eject the target. Depending on the amount of energy, the frequency used,
and the fluid properties of the solvent the system can be made to transfer specific drop volumes
in the nanoliter range.
Since there have been no published results for cell viability or fidelity of cell patterning using this
technique it is hard to evaluate it’s effectiveness. It has the advantage of being automated with
the use of CAD/CAM technology like other cell printing technologies. The transducer makes no
contact with the transferred medium and therefore poses no contamination or pore-clogging
problem as an ink-jet device would. A major challenge this technology faces is that it requires
that the transferred media be in a range of specific viscosity and surface tension. Current work
(Ellson et al., 2003) used DMSO at concentrations in the order of .1% to maintain fluidity for
nanoliter droplet formation and ejection. Solvents like DMSO would not be desirable for
studying cell-to-cell interactions or creating any kind of tissue construct as it breaks down
adhesion and degrades cells. Another challenge for tissue engineering with this technology is
that the receiving surface must be inverted above the microplate for biomass transfer. This limits
the range of receiving cell array mediums that can be used and tissues deposited.
24
2.4.4 Rapid Prototype Cell Printing
A close cousin to the ink-jet cell printer, BioAssembly Tool™ (BAT), uses both pneumatic and
positive displacement ejection needles to create three-dimensional tissue constructs (Smith et al.,
2004). The BAT system brings cell printing up from microscopic to the macroscopic by being
able to create large tissue constructs on the order of centimeters in length and height with 90 µm
resolution. It has successfully been used to extrude human fibroblasts suspended in a
polyoxyethylene /polyoxypropylene matrix with 60% cell viability. It has also successfully coextruded bovine aortic endothelial cells with collagen type I onto a flat sheet with 46% to 86%
cell viability depending on the size of needle used.
The BAT system is fully automated. It consists of a motorized x-y stage (5 mm travel) with four
syringes, traversable in the z-direction (5 mm travel), made up of one positive displacement and
three pneumatically operated. Each nozzle is supplied with a video camera, a fiber-optic light
source, and individual electrical temperature controls. The stage itself is fitted with a water
jacket for temperature control while the whole assembly is fully enclosed in a working chamber
that is both thermostat, and humidity, controlled. The BAT also has the ability to extruded
individual cells and has been shown to viably extruded co-cultures of cells and polymer matrix.
Finally, since there is more than one syringe it can load multiple cell types to simultaneously
create three-dimensional multicultural constructs.
Although BAT has overcome many issues such as the cell matrix getting too dry or too cold by
monitoring and controlling temperature and humidity, it still suffers from many of the same
issues as ink-jet cell printing. This includes nozzle clogging, possible cross contamination, and
sterilization issues. The minimum internal diameter used for syringes was 90 µm which is about
2 - 10 cell widths wide in most applications. This means that cell-to-cell communication and
adhesion is not repeatable and therefore limits the ability to create a structure in vitro that truly
represents a structure in-vivo.
2.4.5 Optical Trapping
Optical trapping employs a laser to provide the pushing force necessary to trap and manipulate
cells for many different applications. This technology relies on the difference of refractive
properties between the cells and the surrounding medium that in turn allows the light to form a
vector of force as it is absorbed, refracted, and transmitted through the cell material. Various
techniques have evolved over the years but each one still relies on the same basic principals
25
mentioned above (Uchida et al., 1995). Optical trapping can be simply used to push cells in one
direction called optical transport where the laser force only supplies a pushing force in the beam
propagation direction. A single laser focused through a high numerical aperture lens can focus
the beam at very high angles of incidence directed toward the center of the beam that can be used
to grip the cell as an optical tweezer enabling selective movement in any direction transverse to
the average beam path. Combination of the two above techniques results in a levitation trapping
scheme where one laser is used to position the cell transversely, an optical tweezer, and a second
beam to move the cell up and down, optical transport. More recent technologies such as
holographic beam splitting and beam sharing can form a plurality of beamlets that can be
patterned into many types of caging shapes to manipulate cells (Gruber et al., 2004).
The first biological application of optical trapping used a single laser as an ‘optical tweezer’ to
hold and manipulate living viruses and bacteria (Ashkin et al., 1987). Focusing Gaussian laser
light through a high NA objective lens of a microscope creates a gradient that points to the center
of the beam thus creating a single beam trap. This experiment was able to trap and move a
motile bacterium, 0.5 to 1.5 µm in length, with an argon (green) 514.5 nm laser at powers as low
as 3 to 6 mW. It was found that the bacteria were optically damaged at powers in the range 1020 mW within a half-minute. Obviously the laser is a two edged sword in that the larger the
trapping power the greater the risk of harming the cell. The laser light used in this experiment
was in the green spectrum, which is easily absorbed by the cell, and it would be better to use a
wavelength with less absorptivity such as the near infrared.
Another experiment employing optical trapping used computer-generated holograms to move
colloidal silica microspheres in an array of 400 independently controlled optical traps (Curtis et
al., 2002). Holographic Optical Tweezers (HOT), as it is called, can employ a diffractive optical
element or a real-time configurable special light modulator to break up the laser beam into many
individually controlled traps that can be used to move particles in 3-D space. A benefit of using a
HOT to move biological cells is that since there are many beams available to move a cell, their
respective power can be much lower thus eliminating the hot spot problem caused by using a
single high power beam (Gruber et al., 2004).
Many biological applications for optical trapping exist such as cell sorting, measuring mechanical
properties of cells, cell purification, studying cell-cell interactions, cell arraying, and creating
three-dimensional structures. A method for high-resolution sorting of sperm cells has been
proposed using holographic optical traps to ‘funnel’ cells that are appropriately identified by a
26
fluorescence threshold (Gruber et al., 2004). The adhesion strength between cells has been
studied using optical levitation and optical tweezers. In this experiment the cells were brought
into contact by stabilizing one in the end of a micropipette while a second cell was attached to it
using levitation and optical tweezing. They were allowed to bond for 30 seconds and then the
cell held by the optical trap was ‘pulled’ away. The trapped cell eventually broke from the forces
involved that were estimated to be as large as 30 pN (Uchida et al., 1995). Three-dimensional
structures or layered patterns of cells are usually embedded in a medium such as Hydrogel™ or
collagen to immobilize the cells, provide structure, possible chemical signals, and promote cell
growth. By using a holograph optical trapping scheme it is proposed that gel based cell sorting
can take place even after the gel structure is finalized (Gruber et al., 2004). Since HOT can move
cells in three dimensions it is possible to extract cells that are in-gelled by melting of the gel by
the optical traps that can expose exit pathways. Alternatively, the whole gel can be melted and
the cells rearranged, held in place by optical traps and re-solidified.
BioRyx 200™, a commercial embodiment of the holographic optical trapping technology
described above, has been developed and available for purchase by Arryx Inc. since 2002. It can
create up to 200 simultaneous optical traps that are powerful enough to control up to 30 µm sized
objects and can be independently maneuvered in all three dimensions. It employs a 2 Watt 532
nm diode-pumped solid-state laser.
One of the most recently published methods for maneuvering cells using optical trapping uses a
diode laser bar to control a larger trapping zone (Applegate et al., 2004). The laser diode bar is
unique in that it does not form a trap at a point or plurality of points, rather it can create a
continuous line of action between 1 and 100 mm in length. It uses a laser diode bar at 980 nm in
wavelength that is capable of producing 3 Watts of average power. The laser is directed through
a low NA objective lens, then through an optional mask, reflected by a mirror and refocused
through another low power objective before being focused at the target. The mask used in the
experiment consisted of two razor blades that only allowed a sliver of the laser bar through to the
focus, but could be translated back and forth as desired. This allowed for translation of a single
trapped cell. The laser diode bar was able to trap a line of bovine red blood cells in a PDMS
microfluidic channel with an unspecified flow gradient. This technology could be used to
perform cell sorting in microfluidic chambers with a fraction of the energy required by other
optical trapping methods. It also has the advantage of being relatively simple when compared to
the computationally intensive holographic optical trapping technology.
27
Laser cell manipulation is fast becoming a viable method for maneuvering cells for many
different biological applications. However, there are some challenges yet to be over come.
Most of the lasers used a wavelength in the range of 530 nm. The problem with this wavelength
is that although it can place more force on biological cells it is also absorbed very well by them.
Larger wavelengths, such as the laser diode bar at 980 nm, would not be as readily absorbed by
cells which would improve cell viability after trapping. Another challenge facing laser-trapping
technology is that it can only be employed on surfaces that are optically transparent and only
within the small range of focal depth offered by the optical aperture. This limits the range of cell
deposition possible for creating multidimensional structures.
Most of the laser-trapping
experiments have been conducted in a highly aqueous medium due to the large forces that would
be needed to overcome the viscous friction to move a cell though a thicker medium.
2.4.6 Dielectrophoresis
Dielectrophoresis works on the fact that electric fields exist between a single charged electrode
and its surroundings. A microelectrode tip can be made to repel or attract a biological cell by
applying a charge with a specific frequency (Schnelle et al., 1999). This experiment used square
wave signals in the range of 100 kHz to 40 MHz and 5 to 28 volts peak-to-peak to power a
microelectrode just under 5 µm in diameter. By switching between the frequencies a single yeast
cell was selectively captured and released by the attractive and repulsive potentials thus induced.
The attractive field strength was shown to drop off rapidly as distance between the cells and the
microelectrode was increased. This is beneficial in that it allows for single cell manipulation in
larger cell population solutions.
Single electrode dielectrophoresis can cause damage to the biological cells membrane if too
much voltage is applied.
The long-term effects on cell viability with dielectrophoretic
manipulation need to be studied. Experiments must be made to characterize the amount of
voltage needed to move a particle through a thicker medium or a medium with a velocity
gradient.
2.4.7 Photopatterning
A method for creating Hydrogel™ microstructures with living cells using photopatterning has
been demonstrated (Liu et al., 2002). This tissue engineering technology can be used to form
complex three-dimensional tissues structures with one or more different cell types.
28
Photopatterning uses a polyethylene glycol (PEG) based Hydrogel™ to encapsulate the
biological cells into a scaffold that is in turn crosslinked using UV light. A pre-treated glass
slide, to allow bonding at the surface, was flattened against a Teflon™ base and sealed. A prepolymer solution containing PEG diacrylate, HEPES buffer solution, and a photoinitiator was
combined with human hepatoma HepG2 cells and injected through channels in the Teflon to fill
up the free space between the glass and the base. A photo mask was printed using a highresolution line printer and placed upon the glass surface.
A 10 mW/cm2 UV light at a
wavelength of 365 nm was used to initiate cross-linking in the pre-polymer solution. After
solidification the glass slide was removed from the Teflon mould and washed with HEPES
buffered saline solution that removed the uncross-linked pre-polymer leaving behind the cell
biopolymer pattern. This process was repeated to create intricate three-dimensional structures
such as fibrous micro weaves.
The impact of photopatterning on cell viability was reported as not significant. UV light has the
potential to cause cell damage by introducing free radicals, however it was reported that the
biopolymer acted as a free radical sink. The results of the photopatterning showed that there is a
lower limit to how small the features created could be. It was shown that features sizes less than
200 µm resulted in larger features, up to 200% at 50 µm, than the intended size.
2.4.8 Microfluidic Cell Patterning
Microfluidic cell patterning is the novel combination of fluid dynamics in microchannels and cell
patterning by deposition of biopolymers and cells. A microfluidic chamber or stamp, as it is
called, is a three level structure composed of two layers of transparent elastomer,
polydimethylsiloxane (PDMS), sandwiched together. The top layer contains the channels that
are needed to cross over the structure, the bottom layer contains the channels need to cross under
the structure, and the union of the two PDMS layers provides the upper and lower halves of the
complete structure. A method for the fabrication of microfluidic stamps that contain threedimensional channels has been described in literature (Anderson et al., 2000). The biological
applications for microfluidic cell patterning can include creating cell and protein arrays for
biosensors and drug screening or for creating tissue constructs (Chiu et al., 2000). This requires
that cells in a biopolymer matrix must be deposited into structured arrays via the microchannels
by fluid gradients imposed at the entrance and exit channels. The deposition of cells using threedimensional microfluidics was successfully demonstrated using bovine capillary endothelial
(BCE) and human bladder cancer (ECV) cells (Chui et al., 2002). Two cell structures were
29
created: a series of concentric squares and a checkerboard pattern with tiny capillaries linking
them together. This provided a proof of concept that more complex structures could be created
using these techniques.
In another study, three types of cells were successfully layered into a heterogeneous tissue using
a three-dimensional microfluidic system (Tan et al., 2004). Layering cells one after another is
possible in microfluidic stamps because of contraction of the biopolymer matrix caused by cells
themselves.
The process of contraction is controlled by three factors: cell type, cell
concentration, and time. In this case, the goal was to create a three layer arterial type tissue
composed of human lung fibroblasts, umbilical vein smooth muscle, and umbilical vein
endothelial cells. The final 3-D structure produced by the experiment was characterized as being
well organized. Although it maintained the distinct layer pattern, there was still significant cell
migration between the layers that must be overcome if this type of tissue is to make it into
clinical trial.
The microfluidics approach to cell patterning, although very good at actually patterning tissue
structures, will have to overcome challenges to be a commercially viable tissue-engineering tool.
Using fluid gradients or capillary action to transfer cells will not guarantee repeatability of
results. The flow of cells cannot be easily controlled on a cell-by-cell basis but rather are seeded
en masse with a probability that one will attach to the surface at a given site. This will limit the
efficiency of single cell work such as the study of single stems cell fates in microwells where
many wells were constructed and only a fraction of them were populated, by chance, with a
single cell (Chin et al., 2004).
30
Chapter 3
Problem Statement and Objectives
3.1 Problem Statement
In regenerative medicine it has become of great importance to understand the underlying
mechanisms of behavior and function of cells within the human body. There is a need to relate
the physiological characteristics of cells with time and function through visual reporters such as
fluorescent markers. To do this, cells must be isolated and observed in culture while responding
to different conditions in order for us to understand how cells change with respect to their
environment. Previous studies have been limited by the lack of automated tools to culture and
observe these live cell interactions over long time periods until recently. With the great advance
in computer data storage capacity and digital camera technology in the past few years'
researchers are now able to take the next step forward in long-term live cell research. In this
study, a fully automated microscopy system has been developed for the PC to facilitate long-term
live cell imaging.
The system, entitled the Bio-Assembly, Mosaic Builder, and Informatics system (BAMBI), will
combine the process of laying down cell types in media, capturing the events taking place, image
content visualization, and data export for the purpose of data mining and informatics.
Throughout its development BAMBI will continually be used by researchers for different
applications within regenerative medicine. These applications will provide the crucial inputs and
feedback on the BAMBI design allowing it to grow and respond to specific needs. BAMBI can
be thought of as a true work-in-progress that will continue to evolve beyond the specifications
presented in this thesis.
3.2 Objectives
The design criteria for BAMBI has been divided into two sections: Primary and secondary
objectives. The primary objectives are considered to be hard goals that must be met by the
system. Some of these goals were present at the beginning of this work, and some were
additional requirements that were added during development to support the various experiments
in the lab. The secondary objectives are meant to serve as guiding principles for the overall
system design.
31
3.2.1 Primary Objectives
3.2.1.1 Automated capture of multiple fields-of-view through time
Previous work (Ramunas et al., 2007) has outlined the need for more than one field-of-view to be
taken during a single time course experiment. Being able to observe a low probability event
requires that one have many events to observe. The benefit of capturing a very large array of
fields is that one can go back to the beginning of the time course, zoom-in, and play these events
forward again while observing them in greater detail. The increase in the amount of data
captured allows more statistically rigorous observations with a higher probability of capturing the
events of interest.
3.2.1.2 Capture of three-dimensional fields-of-view through time
The capture of a three-dimensional image can be achieved by taking images of multiple optical
sections through the z-axis of the specimen. In previous work (Moogk et al., 2007), it was
shown that a 3-D time course was necessary to identify the key cell dynamics within a human
islet of Langerhans. A 3-D time-course can provide a wealth of information about cell-cell
interactions in three-dimensional cell aggregates.
3.2.1.3 Automated capture using multiple fluorescent light sources
With the introduction of fluorescent labeling techniques in the past decade it has become
necessary to provide an imaging system that can operate in the fluorescent domain. Allowing for
multiple fluorescent channels enables different markers to be excited and recorded during the
same live cell experiment.
3.2.1.4 Robotic handling of cells for pick-and-place operation
The ability to capture and release individual cells allows research to be conducted on a single cell
level. Previous work (Ramunas et al., 2007) used BAMBI to recover individual cells subsequent
re-implantation in live mice to ascertain the pluripotency or "stem cell like" qualities of the cell.
As much of the operation of pick-and-place operations should be performed by the robotic
interface so that it might be automated in the future.
32
3.2.1.5 Automated robotic micromachining of multi-well arrays
The ability to manufacture microwell arrays enables many simultaneous experiments to be
conducted at the same time under the same conditions. The automation of the machining process
alleviates the user from the tedious repetition of hundreds of commands.
3.2.1.6 System is robust against failures
The software should be implemented such that failures or system crashes are handled gracefully.
There should be precautions in the software or hardware to avoid potentially damaging or
creating hazardous conditions. When in automatic mode, the user may not be aware a crash has
occurred. Therefore, in the event of a failure, care must be taken to insure motors should not be
left in a runaway state or other devices like lights are left "on". Consideration will be given to
BAMBI as it is intended to be run on Microsoft's Windows XP™. Windows XP is not a true
real-time operating system and therefore there is no way to absolutely guarantee that the software
can always react to failures when they occur. The way around this is to provide an additional
layer of hardware support for failure conditions. An example would be the addition of a failsafe
timer on the heater or light circuits that would deactivate the device if left "on" too long.
3.2.2 Secondary Objectives
3.2.2.1 Software is easy to navigate and use
The software should retain a standard Microsoft Windows XP application look-and-feel. This
would include maintaining a similar menu layout to well known programs such as Adobe
Photoshop™ and Microsoft Word™. The software should include a help menu to assist the
novice user in any part of the application.
3.2.2.2 Software allows modifications to be made during a live experiment
The ability to react to changing conditions or make adjustments to the way in which data is being
collected after the experiment has already been started is a key feature of BAMBI. Almost all of
the high content screening systems available commercially lack this seemingly simple yet very
important functionality. Having lost potential data due the inability to alter an experiment midrun can be expensive ethically, in the case of sacrificial donor cells, and financially due to time
lost and reagents used.
33
3.2.2.3 Software stores all data in a format easily exchanged with other programs
Given that BAMBI serves as the front end for a wide range of data mining applications, any
output data should be in a format that can be easily opened by the receiving application. Any
relevant textual data should be stored in a well-known or accepted format that could be opened
directly by any spreadsheet program such as Microsoft Excel™, IBM Lotus 1-2-3™, and
Borland Quattro Pro™.
3.2.2.4 Software is easy to upgrade and modify
The field of cell biology is a dynamic environment where new markers and techniques are
continuously being developed and tested. The researcher should be able to add new routines and
capabilities to BAMBI with as little effort as possible. This should include the use of good
coding methods such as object-orientated programming and modular or encapsulated design.
The final code submitted should be fully documented and, ideally, available in html document
format.
3.2.2.5 Software will provide the user with a real-time display during all operations
During data capture, robotic micro machining, or pick-and-place operation BAMBI should
provide the user with “real-time” feedback. This could include helpful diagrams, heads up
display of the current motor status, and display of the currently captured image.
If an
experimental run is active, it should provide information about where the system is in relation to
the experiment as a whole, how long it has been running, and a forecast of the time left. User
interface elements should be responsive to the user, even under heavy computational stress
conditions. This could include the use of multiple threads, efficient message handling, and
multiple interrupts.
3.3 Architecture of BAMBI
BAMBI can be represented as many functions, each one devoted to a specific task, and all of
them linked together in a mutual communication network. Figure 4 provides an overview of these
functions and how they relay information to each other.
34
BioAssembly Mosaic Builder and
Informatics
Light Channel
Effectors
Cell Environment
Vision
Real-Time Display
Image Capture
Image Processing
Data File
Informatics
Figure 4: BAMBI Overview
This figure shows the breakdown of the BAMBI acronym and its main functions. BAMB represents the
functions that are required for “real–time” data collection and I represents the functions that can be performed
post-collection.
Here BAMBI is divided into two parts: The Bio-Assembly Mosaic Builder as one and Informatics
the other. The first part encapsulates all the "on-line" functions that must take place during an
actual experiment run. Where as the second part, informatics, is traditionally an "off-line"
function that can be done anytime after the experiment has taken place. The first section forms
the scope of this thesis work while the Informatics section has been left to others to develop in
parallel. However, rather than break BAMBI up into BAMB and I, all references made to BAMBI
from this point forward will refer to work done for this thesis unless otherwise noted.
The figure shows the many functions BAMBI must provide to facilitate long-term live cell
imaging. The cell environment box represents the state of all the dependant conditions that are
needed to support the cell(s) including the dish, reaction chamber, or slide containing the sample.
This includes the cell(s) media, temperature, CO2 concentration, and humidity. The effectors box
represents all the ways we can control the variables in the cell environment. This includes any
robotic end effecter or manipulator used for cell pick-and-place operations, CO2 levels, and
humidity and temperature regulation. The light channel box represents any type of light source
that can be used to image and contrast or excite fluorescence in cells. This would include the
control of the shutter as well as light box. This is really a subset of the effector box, but is shown
35
separately for clarity of purpose. The vision box represents the process of imaging the field-ofview by the CCD camera. The image capture box shows that there must be a way to control the
digital camera and grab the frames acquired for further display or processing. The imageprocessing box represents the tasks that can be performed on the captured data. This could
include feature tracking, autofocus, and image contrast and enhancement for live viewing. The
real-time display box represents the graphical user interface for the program. It provides a heads
up display of the current image data gathered from the image capture process during a live
experiment. Ultimately the final result, a data set and associated image set must be stored in a
format that can later be retrieved. This is the job of the data file box. It provides all the functions
necessary to collect this data and make it available to the image processing box as well as any
other program that may be required.
The large bounding box encompassing all the functions in BAMB from Figure 4 represents the
overall software package. Each piece of hardware usually has its own set of drivers and software
required to control it. The purpose of this software is to make the individual pieces work in
harmony and communicate effectively with each other. Each function in BAMB shown in Figure
4 is further broken down and described in complete detail in the subsequent chapters: Chapter 4,
Hardware Design and Implementation, and Chapter 5, Software Design and Implementation.
36
Chapter 4
Hardware Evolution and Implementation
4.1 Hardware Components
The BAMBI hardware components can be divided into seven general categories as shown in
Figure 5 below.
Environment
Control
PC
Control System
Light Channels
Microscope
Effectors
Vision
Figure 5: BAMBI Hardware Control Pathway
This figure illustrates the control pathway for the hardware components used in the BAMBI system. The
personal computer (PC) runs the software for the control system and is used to communicate with all the
devices as well as the vision system.
The personal computer (PC) houses the servo controller cards and feedback devices as well as
running the software that orchestrates the communication between all components. The software
program is represented by the control system and is responsible for control of the environmental
settings, microscope illumination, end effectors, and the vision system. The environment control
box represents the temperature, CO2, and humidity regulation. The light channel represents the
electromechanical shutter for the broad-spectrum lamp and the electronic operation of the array
of fluorescent light channels. The microscope and vision boxes represent the inverted microscope
on which all experiments are performed and the CCD camera attached to it.
37
4.2 Microscopes
Three microscopes have been modified to work with the various configurations of BAMBI. Each
is an Axiovert 200 inverted microscope manufactured by Carl Zeiss, Germany. All microscopes
have the same features and specifications respectively and are herein referred to as M1, M2, and
M3. Most of the BAMBI 4-axis prototype work was conducted on M3, with the final 8-axis
design implemented on M1 and M2. Each microscope was fitted with a 5x, 10x, 20x, and 40x
objective. The optical specifications, including working distance and NA of the objectives are
summarized in Table 4.
Table 4: BAMBI Microscope Objectives – Specifications
Numerical
Working
Field of
Aperture
Distance
View
5x
0.12
9.9mm
23mm
A-Plan
Phase 0
10x
0.30
5.5mm
25mm
Plan-neofluar
Phase 1
20x
0.50
2.0mm
25mm
Plan-neofluar
DIC
40x
0.75
0.5mm
25mm
Plan-neofluar
DIC
Magnification
Correction
Contrast
Method
4.2.1 Optimizing CCD Sensitivity
A big concern for long-term live cell imaging is avoiding cell damage from illumination sources.
As light can cause genetic mutations, cell death, and other unwanted reactions, it is always best to
limit light exposure to minimum amount necessary to achieve the goals of the experiment. In the
case for fluorescence studies, overexposure of the exciting wavelength can cause bleaching of the
fluorophores that can invalidate the consistency of the results for long term comparative studies.
The amount of energy needed by each of the CCD elements to register a non-zero value sets the
bar for the minimum amount of light needed to capture an image. A balance must be made
between the amount of light needed by the CCD camera to generate an acceptable image and the
health of the cells. Given that overall magnification, NA of the lens, and camera binning effect
the amount of light that reaches the CCD elements, there are choices that can be made to make
such experiments feasible (see Table 5).
38
Table 5: CCD Relative Light Sensitivity Chart
Rank
Objective
NA
Camera
Adapter
Camera
Binning
Relative
Sensitivity
1
2
3
4
5
6
7
8
9
10
11
12
13
14
15
16
40
20
10
40
40
20
20
10
10
40
20
5
10
5
5
5
0.75
0.5
0.3
0.75
0.75
0.5
0.5
0.3
0.3
0.75
0.5
0.12
0.3
0.12
0.12
0.12
0.5
0.5
0.5
0.5
1
0.5
1
0.5
1
1
1
0.5
1
0.5
1
1
2x2
2x2
2x2
1x1
2x2
1x1
2x2
1x1
2x2
1x1
1x1
2x2
1x1
1x1
2x2
1x1
1.00
0.79
0.41
0.25
0.25
0.20
0.20
0.10
0.10
0.06
0.05
0.04
0.03
0.01
0.01
0.00
Table 5 ranks the relative sensitivity of various combinations of optical elements and camera
binning modes. The camera binning mode is a hardware controlled feature supported by most
microscope rated CCD cameras that allows the energy received by a group of pixels to be
summed to a single value. By increasing camera binning from 1x1 to 2x2, the CCD sensitivity is
increased by a factor of 4, and noise is reduced. The downside is that the resolution of the image
is reduced by the same amount. The numerical aperture (NA) of the objective lens plays the
most important role in increasing sensitivity as the intensity is proportional to (NA)4. The
combined magnification of the objective and the camera adapter affect both the size of the fieldof-view and the light intensity.
Here, the light intensity is proportional to the overall
2
(magnification) . The end result becomes a choice between the size of the field-of-view, the
camera resolution, background noise, and exposure levels tolerated by the cells.
4.3 Environmental Control
Each microscope was provided with an environmental control system to enable long-term live
cell imaging. The environmental control system regulates temperature, CO2, and humidity. To
accomplish this, a large insulated box with various panels for experimenter access was
constructed and placed around the microscope. A gas line, attached to a 3000 psi CO2 tank with
39
a regulator, is fed into the box. Temperature is maintained with a conventional hand-held hair
dryer with feedback control provided by a digital temperature gage. The hair dryer is mounted
inside the box and the temperature gage is mounted to the microscope stage. M3 was fitted in one
environment box, while M1 and M2 shared a larger environment box. The M1and M2 setup
allows for a control setup to be conducted in parallel under the same conditions on each
microscope. M3 is also fitted with a laminar HEPA filter flow hood inside the environment box
to maintain a sterile environment for open culture experiments on the microscope stage. This
system maintains horizontal laminar flow of filtered air through the entire work area of the
enclosure thus maintaining sterility. This allows M3 to be used for cell pick-and-place operations
without contamination of the cell culture. M1 and M2 can only be used in a "closed" chamber
configuration.
4.3.1 Environment Box
The environment box is crafted from panels of 1 inch thick aluminum foil faced foam sheathing.
The sheathing has a thermal resistance R-value rating of 6.5 that is common for most home
sealing applications. The sheathing is cut into square panels and fastened together into a box
with aluminum angle brackets for support. All the connections and exposed edges are sealed
with aluminum foil tape.
4.3.2 Temperature Regulation
A simple hair dryer and temperature sensor are used to control the temperature inside the
environment box. The resulting inside temperature can be maintained between 36 and 37º as is
needed for live cell experiments. The heat is supplied by a commercially available 1600 Watt
hair dryer manufactured by Revlon Corporation operating from a standard 125V 60Hz power
supply. Heater control is managed with solid-state relay connected to a standard wall outlet for
power, and a PC computer for the control signal. The heater is controlled "shot gun" style, either
"on" or "off", depending on the logic state of the 5-volt control signal with "on" corresponding to
5 volts and "off" corresponding to 0 volts. A USB analog and digital input/output device by
Labjack ™ Corporation (CO, USA) installed in the host PC sends the signals directly to the relay
via software command.
The heat sensor is an EI1022 temperature probe from Electronic
Innovations Corp. (CO, USA). The analog output from heat sensor is connected to the analog to
digital converter on the Labjack device. This signal is then used as feedback by the software
program to regulate the temperature. Once the heat sensor is calibrated by comparing it's readout
40
with an actual calibrated thermometer that is placed beside it inside the environment box it can be
used to maintain a temperature within +/-1º from target.
4.3.3 Cell Culture Environment Chamber
The cell culture environment chamber design allows for CO2 and humidification controls for
long-term live cell imaging. Temperature is maintained by the microscope environment box as
described previously. A three-dimensional cutaway of the complete chamber resting on the
BAMBI end effector is shown in Figure 6.
Outer Chamber
Moat
Water Reservoir
Culture Medium
Inner Chamber
CO2
End Effector
Figure 6: Cell Culture Environment Chamber
Three-dimensional cutaway of the cell culture environment chamber, as it would appear when laying on top the
BAMBI 3-axis end effector.
The cell culture environment chamber features a low profile and three mutually parallel thin glass
sections for optimal DIC imaging. The glass slides are micro cover slips with a thickness range
between 0.14 and 0.17 micrometers. All slides are kept in parallel configuration to avoid light
aberrations. The total height of the environment chamber is 20 mm - 25 mm depending on the
application. For DIC experiments, the height of the chamber is a critical factor, and must be no
more than 25 mm to allow room for the condenser to focus through specimens attached to the
bottom of the inner chamber.
The line out from the CO2 flask is fed directly into the outer chamber inlet as shown in the
bottom left of Figure 8. The flow of the CO2 is deflected by the wall of the moat upon entry to
41
chamber that prevents concentrated flow into the inner chamber. Humidity is provided by natural
evaporation of the nano-pure water contained in the moat that encompasses the inner chamber.
The outer chamber may be lifted off at anytime to provide access to the inner cell culture
chamber or to refill the moat. Sterility is maintained by the coverlid of the inner chamber. Gas
exchange with the culture medium occurs through passive diffusion between the contact of the
inner lid and the inner cell culture chamber.
4.3.4 CO2 Regulation
The CO2 gas is provided from a 4500 psi rated steel tank with a two-stage regulator. The first
stage regulates the gas pressure between 0 to 4000 psi and the second stage regulates the pressure
between 0 and 30 psi. A final pressure of approximately 1 psi is used for CO2 perfusion during
live cell time courses. A 5 mm diameter hose is connected to the secondary stage and stepped
down to 2 mm before connection to a 0.2 µm filter. The purpose of the filter is to remove any
possible bio-active contaminants. A second 2 mm diameter hose is run from the filter to a sealed
flask half filled with nano-pure water. The outlet of the hose inside the flask is such that it lies at
the bottom of the flask and is completely submerged by the water. The CO2 gas is then allowed
to bubble up through the water. This effectively humidifies the normally dry CO2 gas before
entry into the cell culture environment chamber. A 2 mm diameter outlet hose channels the
humidified CO2 from the flask to the environment chamber. All hose lines including the flask are
sterilized (autoclaved) before they can be used for a live cell experiments. In the case of M1 and
M2 they share the same CO2 line and therefore a splitter is attached to the outlet hose on the
flask. Each subsequent line to the M1 and M2 cell culture environment chambers has a rotameter
to ensure that each chamber gets the same CO2 flow rate.
4.4 BAMBI End Effectors
The end effectors used in BAMBI are a 3-axis stage and a single axis micropipette. The 3-axis
stage provides the motion for all three directions in space (x, y, z) and the micropipette is allowed
to translate up or down for an "injection" like motion. Together these two end effectors allow for
automated panning of the cell culture, focus control, and pick-and-place operations.
42
4.4.1 Three Axis Stage
A 3-axis Cartesian robotic stage is used to mount and move a sample through the microscope’s
focal point. A drawing of the complete three axis robotic stage is shown in Figure 7. The stage is
made up of three linear actuators that are mated to each others moving surface to form the x, y,
and z perpendicular motions of a traditional Cartesian robot. The y-axis is attached directly to the
moving part of x-axis and the z-axis is attached to the moving part of y-axis with a 90-degree
mounting bracket. A custom designed cell culture mounting plate is attached to the z-axis linear
actuator to hold the live sample. Full drawings of the cell culture plate are provided in Appendix
A. 4-5.
Z Axis
Z
90º Connector
X
Y Axis
Y
Cell Culture Plate Attachment
X Axis
Base plate
Figure 7: BAMBI Three Axis Stage
A drawing of the three axis stage with an attached cell culture holder. The coordinate axes in the top right
indicate the directions of positive motion for the linear actuators. All three actuators are mutually attached. Y
is attached to X and Z is attached to Y via a 90-degree connector. X is directly attached to the base plate that is
in turn attached directly to the microscope platform.
The three actuators are Ultra-High-Resolution Micro-Translation Stages manufactured by Physik
Instrumente (PI), Germany. The actuator's encoders have a design resolution of 0.007 µm and a
25 mm travel range giving a total working space of 25 cm3. They can achieve a minimal
incremental motion of 50 nm and move at speeds up to 1.5 mm/sec. A small DC motor with a
Backlash compensated leadscrew powers each actuator. The unidirectional backlash is limited to
2 µm for each axis. However, there is some interplay between all three axes that is evident when
43
any one axis is changing directions. Additional side lash also occurs due to the free play and
frictional effects of the two bearing rods, shown in yellow in Figure 7, within a single actuator.
The mounting plate for the cell culture is attached to the z actuator stage and is made out of
aluminum for reduced weight. The coordinate origin used for the robot is arbitrarily located but
could be located anywhere since movement is assumed to be completely translational.
4.4.2 The Single Axis Micropipette
A micropipette is used to perform single cell pick-and-place operations for live cell experiments.
A long glass needle with a very small diameter called a micropipette is attached to the moving
surface of a linear actuator. The linear actuator is mounted to the microscope stage via a
modified manual controlled x-y stage panner. The linear actuator can be positioned at any angle
between 0 and 90º relative to the microscope stage. The long axis of the micropipette is in
parallel with the direction of translation to create an injection type motion.
The linear actuator has the same design and manufacture as the aforementioned Ultra-HighResolution Micro-Translation Stages by Physik Instrumente. The micropipette is made from a
thin tube of glass with one end drawn out to tiny tapered opening and a plastic tube attached to
the other. The micropipette tip is only about 3-5 micrometers in inner diameter when used to
grip cells in culture and 15-30 µm when used to draw cells inside. The tube is filled with media
and is attached to a manually controlled syringe that can move very small to large volumes via a
fine and course adjustment thumbscrew. The actual pressure inside the tube is sensed with a
digital pressure transducer to give the operator feedback on the amount of force necessary to keep
the cell attached or inside the micropipette. As it is difficult to tell from direct viewing which
direction the current pressure gradient is, the digital display is very helpful in this regard.
4.5 Light Channels
An electromechanical shutter and a LED illumination panel control the illumination for longterm live cell experiments. For broad spectrum "white" illumination a shutter is used to swing in
and out of the light path as necessary. For fluorescent illumination an array of LED's are
selectively turned on and channeled into the back port of the microscope.
44
4.5.1 Light Shutter
The light shutter is an electromechanical shutter used to block light from the tungsten-halogen
lamp (HAL) on the Axiovert 200 microscope. This is illustrated in Figure 8 where the shutter is
shown between the light source and the condenser of the microscope. The light facing side of the
shutter is coated with a thin layer of aluminum to effectively block both the heat and light from
the source. The arm is swung into or out of the light path via a voice coil actuator held in
opposition with a spring. The spring is used to return the swing arm back to position once the
voice coil’s signal is disabled. The system is controlled by a simple 5-volt on/off signal provided
by a computer. . The shutter is actuated by a voice coil and spring.
Light Source
Electromechanical
Light Shutter
Condenser
3-Axis End Effector
Microscope Stage
Figure 8: Electromechanical Light Shutter
The broad spectrum light shutter is shown between the light source and condenser of the Zeiss Axiovert 200
microscope. The shutter is shown in the open position, allowing light to pass through the condenser and into
the sample.
45
4.5.2 The LED Array
The LED Array is a computer controlled light panel that can deliver amplified light at a specific
peak wavelength to the microscope for use in fluorescent imaging. The LED Array system is
essentially a box with five fiber optic exit ports, each with its own filter holder and LED light
source. Each light can be turned on or off by software control. A 15-pin ribbon (only 5 plus 1
ground are used) connects the BAMBI 8-axis Control Module to control the LED channels. A
special fiber optic five-to-one adapter conjoins the five ports into a single fiber. The resulting
fiber optic line is routed to the back of the Axiovert 200 microscope. The complete connection
diagram is shown in Figure 9.
+12V DC
Power
Supply
627 nm
530 nm
BAMBI
8-Axis
Control
Module
15-Pin
Ribbon Cable
5-Channel
LED Array
505 nm
5 to 1
Adapter
455 nm
Axiovert
200
Microscope
356 nm
Figure 9: 5-Channel LED Array Connection Diagram
This is the connection diagram for the 5-channel LED light array. Power is supplied to the box via a single 12v
DC power supply to drive the five LEDs. Each LED output is routed via 100-micron diameter fiber optic cable
to a custom built 5 to 1 adapter. The resulting 100-micron diameter fiber optic cable is then attached to the back
port of the Zeiss Axiovert 200 microscope.
One problem with using a fiber-optic light source arises when more than one LED is spliced into
the fiber. For example, a tri-color fiber optic channel would require that only 1/3 of the light
energy from each source be allowed to enter the channel. 1/3 of the maximum illumination
potential may result in low excitation levels and thus low emission levels.
Thus camera
sensitivity becomes a critical factor as the signal to noise ratio will drop by 2/3 per channel.
46
4.6 Control System
The control system for BAMBI has gone through several major revisions and many incremental
improvements as the experimental studies progressed. The original BAMBI consisted of a 3-axis
stage and 4-axis ISA legacy controller card manufactured by Physik Instrumente, Germany.
Problems with migration from Windows 95 to Windows NT led to the purchase and
implementation of a completely new system.
The new system consisted of a 4-axis PCI
controller card supplied by Galil, USA and a new 3-axis modular stage from Physik Instrumente,
Germany. This is the current system on M3. The need for dual microscope control for M1 and
M2 led to the development of an 8-axis system. This consisted of a single 8-axis PCI controller
card connected to two 3-axis stages, one for each microscope. Each of the new controller
configurations, 4 and 8-axis, in addition to the legacy 4-axis system will be discussed in the
following sections.
4.6.1 4-Axis Legacy Control
The original BAMBI setup consisted of a C-812 4-axis ISA controller that communicated with
the PC via the IBM ISA bus. Four transistors provided the current for each DC motor in an Hbridge arrangement from the controller card itself. Communication with the card was possible by
using a handshaking protocol that included writing to two different addresses and reading from
one. This card was designed and built in 1991 to run under Microsoft DOS and Windows 3.1.
Additionally, it could also operate under Windows 95, 98, and 2000 as they allowed full access to
these access read/write memory locations. However, it could not operate under the more recent
Microsoft operating systems such as Windows NT and Windows XP since they blocked access to
these memory locations for security reasons. At the time BAMBI was in development, the
University of Waterloo Chemical Engineering Computer Services had banned the use of all
Microsoft operating systems released before Windows NT or XP from the Campus Network due
to inherent security risks in the older software. The manufacturer considered the controller card a
"dead product” (Legacy) and therefore there was no driver available for Windows NT or XP.
This required that a new driver be written to access the protected memory on the C-812 for use in
Windows NT and XP.
This driver was completed during my undergrad co-op term in 2003 at the University of
Waterloo. The resulting driver is distributed under GNU public license and is made available in
the accompany software CD for this thesis. The performance of the driver, however, was
47
hindered by the fact that there was a faulty read address on the controller card. The effect this
might have on the movement commands for the axes either reduced or increased the target value
by one digit or in other words an order of magnitude. Although it happened rarely, its effects
would be devastating for the running experiment. As a result, this system was scrapped and
completely replaced with a fully supported and modern 4-axis controller system.
4.6.2 4-Axis Control
A 4-axis control system employing a 4-axis controller card and custom 4-axis driver was
implemented on M3 to drive the 3-axis stage and 1-axis micromanipulator described above. A
diagram showing the overall servo loop is presented in Figure 10.
Computer
DMC 1842 Controller
4-Axis Driver
Encoder
Motor
Figure 10: 4-Axis DC Servo Loop
This diagram shows the servo loop for the 4-axis DMC 1842 controller showing the basic elements including
the computer, controller, amplifier or driver, motor and feedback encoder.
A PCI "Econo" series 4-axis controller card manufactured by Galil Motion Control, Inc. (CO,
USA) is used to control the 4 axes. The "Econo" series controller does not supply power directly
to the DC motors as the C-182 does and therefore required additional hardware (4-Axis Driver)
to drive the motors. The controller can supply either a pulse width modulated (PWM) or a +/10-volt analog (16 bit DAC) command signal for normal DC motor operation. The card features
8 uncommitted digital outputs and 8 uncommitted TTL (0-5 volt) inputs. The bi-directional
FIFO (first in first out) buffer on the controller card provides communication on the PCI bus. A
Galil ICM-2900 Interconnect Module is used to breakout the analog and digital signals to and
from the card. A more complete picture is presented in Figure 11 showing the wire connections
for the complete control system for one axis.
48
DC Power
Supply
+12V
GND
MOTORX+
GND
AMPENX
PWMX
Amplifier
(Driver)
OUT1
DC Motor
+5V
DMC-1842
ICM-2900
100-Pin
Controller
Interconnect
Cable
Card
Module
MOTORX-
FLSX
RLSX
MAX+
MAX-
Encoder
MBX+
MBXGND
+5V
Figure 11: 4-Axis Interconnect Diagram
The complete wire connection pathway for the x-axis servomotor is shown in this diagram. The remaining 3
axes are connected in exactly the same manner. The link between the DC motor and the encoder represents the
physical connection within a single encased assembly. FLS: Forward limit switch. RLS: Reverse limit switch.
MA: Motor A channel quadrature. MB: Motor B channel quadrature. OUT: Digital output. GND: Ground or
reference voltage. PWM: Pulse width modulation. AMPEN: Amplifier enable signal.
4.6.3 4-Axis Driver Module
A custom built 4-axis driver was designed and implemented to supply the power, drive the
motors, and manage the wire hookups between the 100-pin cable and the motors. This includes
the ICM-2900 interconnect module, amplifier (Driver) and DC Power supply shown in Figure
11. The driver utilizes the PWM signal provided by the controller card to create the DC voltage
for the motors. The PWM signal is a steady stream of pulses at a constant period with varying
pulse width or duty cycle. Figure 12 shows the effect of various pulse widths on the DC motor. If
the duty cycle of the PWM is 50% the effective voltage being passed through the motor is zero
and the motor speed is also zero. If the duty cycle is 0% the motor experiences the negative full
49
source voltage and the motor will drive at full reverse velocity. If the duty cycle is 100% the
motor experiences the positive full source voltage and the motor drives at full forward velocity.
Pulse Width
50% Duty Cycle
Stop
80% Duty Cycle
Forward
20% Duty Cycle
Reverse
Constant Period
Figure 12: Pulse Width Modulation for DC Motor Control
Pulse Width Modulation (PWM) is shown with varying pulse durations and their effect on the direction of the
servomotor motion. The 50% duty cycle results in a stop condition. The 80 % duty cycle results in a forward
rotation. The 20% duty cycle results in a reverse rotation. The frequency of the pulse is always the same.
Internally the driver makes use of a full H-bridge to power the motor. The PWM signal is used
in a locked anti-phase configuration. Splitting the PWM signal into two and inverting one of the
signals creates the locked anti-phase condition. The resulting two signals are then used to drive
each side of the H-bridge. The circuit diagram in Figure 13 illustrates this.
This circuit requires the amplifier enable (AMPEN) signal to be high in order for power to be
supplied to the motors. This preserves a safety feature that is used by the Galil controller card to
cut power to the motors in the case of an unexpected timeout or fault condition. The driver also
requires that a logic low signal be provided on one of the digital out lines (ENABLE) to enable
the corresponding motor. This was a design feature to allow the controller to effectively switch
between two motors per output channel. Thus, the controller capacity can be doubled from 4 to 8
axes respectively. To date, this feature has not been fully implemented. Managing two motors
from one channel requires duplicate driver hardware and custom software to save motor states
between the two drives.
50
vs
C1
T1
T4
D1
D4
M
T2
D2
PWM
D3
T3
ENABLE
AMPEN
Figure 13: Full H-Bridge Driver
This diagram shows the full H-bridge driver in locked anti-phase configuration that is used to drive a single DC
motor. The 'H' refers to the pathway the voltage is allowed to flow through the motor between the four NPN
power transistors. The 4-axis controller provides PWM (pulse width modulation), ENABLE (auxiliary enable),
and AMPEN (amplifier enable) signals. The DC voltage source, VS, (+12V, 1A) is used to power the motor.
The PWM signal is split and one signal inverted (locked anti-phase) to provide the two input signals to left and
right sides of the H-bridge.
The operation of the motor is governed by the state of the four transistors T1 through T4 that
form the four corners of the "H" and the motor forming the "bridge". If the upper left and lower
right transistors are 'open' and the rest closed then current is allowed to flow from the source,
across T1, through the motor, across T3, and out to ground. Conversely, if the lower left and
upper right transistors are 'open' and the rest closed then current is allowed to flow from the
source, across T4, through the motor, across T2, and out to ground. The external bridge of diodes
(D1-D4) is made by four fast recovery elements (recovery time < 200 ns) to prevent voltage from
flowing backward in the circuit and possibly damaging the motor. A truth table showing the
results of the various combinations of the three control signals and their effect on the motor are
given in Table 6.
51
Table 6: 4-Axis DC Motor Truth Table
Inputs
Motor
ENABLE
AMPEN PWM
H
H
H
Forward
H
H
L
Reverse
L
X
X
Free Running
X
L
X
Free Running
H=High, L=Low, X=Don't Care
It is important to note that if either ENABLE or AMPEN go low the motor enters a free running
stop condition and not a breaking condition. This allows the motor to be moved manually by
hand without resistance if needed. Ideally, the voltage source is equivalent to the maximum
positive working voltage of the motor. In this case the motors are rated at +/- 15 volts but the
power supply is only 12 Volts. The maximum velocity the motors can safely travel is 200,000
counts per seconds that corresponds to a DC power supply slightly under than 12 volts with no
load. Since the loads will be very small, the amount of over-voltage necessary would be
minimal, and the less expensive 12V power supply becomes a better choice. A complete circuit
diagram and parts list for the 4-Axis driver module can be found in Appendix B.2.
4.6.4 8-Axis Control
An 8-axis controller design was implemented to simultaneously control a 3-axis stage and 1-axis
micromanipulator on both M1 and M2. This design employed an 8-axis PCI "Accelera" series
controller made by Galil Motion Control. The controller card features 24 uncommitted, isolated
inputs and 16 outputs as well as 8 uncommitted analog inputs. The controller provides an analog
signal between –10 and +10 volts with 16-bit DAC resolution for DC motor control but does not
supply an alternative PWM control signal like the 4-axis "Econo" model. However, it does
provide a similar amplifier enable signal for each axis to power down the motor in case of a
hardware fault or timeout. The card communicates via the PCI bus using a FIFO and dual Port
RAM buffer for fast reading and writing. The minimum update rate for the 8-axis configuration
is 125 µs respectively.
4.6.5 8-Axis Driver Module
Like the 4-axis control system, an additional driver module was designed and built to transform
the control signals provided by the controller card into the required voltages for the motors.
52
However, since the 8-axis "Accelera" controller card does not provide PWM, a different circuit
was required to translate the analog command signal. Additionally, the new design allowed for
improvements to be made over the original 4-axis driver. This included breakout screw terminals
for all inputs and outputs offered on the Galil 8-axis card, auxiliary –12, +12, and +5 volt power
connectors, LED readouts for all digital activity including motor error, limit switch contact, home
position, and motor movement.
The 8-axis driver hardware is housed in a 400 mm x 260 mm x 150 mm EM-06 chassis by
Circuit Specialists Inc. (AZ, USA). The chassis features two internal mounting rails and 1.5 mm
thick aluminum front and back plates. The front and back plates were customized for the driver
hardware and two internal shelf units were constructed to fit the internal mounting rails and to
provide support for the internal components. The complete mechanical assembly for the 8-axis
driver module can be found in Appendix A.2.
The 8-axis driver uses the "Accelera" -10 to +10 volt analog command signal to drive the dc
servo motors. The driver employs a differential amplifier driver circuit to translate the analog
command signal into the current necessary to power each of the motors (see Figure 14). The
input signals to the circuit are the amplifier enable (AMPEN), enable (ENABLE), and the analog
command signal (CMD). The AMPEN and ENABLE signals must both be logic high for power
to reach the motor. Like the 4-axis circuit, the AMPEN signal preserves a safety feature of the
Galil controller to turn off the motor during fault or timeout situations. It is also used by
software to turn on or off a motor. A switch on the front panel of the 8-axis driver module
provides the second ENABLE signal. Each axis has a physical toggle switch that is used to
select between servo or stepper motor operation.
This allows either a stepper motor or
servomotor to be used with the Galil “Accelera” controller. However, the stepper circuit driver
hardware was not essential to the BAMBI project and will be completed in future work. In any
case, the actual switch must be switched to the servo side for normal servomotor operation. The
final input to the driver circuit is the CMD signal that is supplied by the Galil “Accelera” to
control the motors. The circuit is designed to amplify the CMD signal 1:1.2. That is, given a 10volt command signal, 12 volt will be applied across the contacts of the servomotor. The complete
electrical schematics and parts lists for the 8-axis driver module can be found in Appendix B.3.
53
vs
ENABLE
AMPEN
10k
C1
CMDX
R1
+
-
C2
+
R3
C1
M
C2
+
-
-
R1
GNDX
R3
C3
R2
C3
R2
Figure 14: Differential Amplifier Driver
This diagram shows the differential amplifier driver circuit for the x-axis. The remaining seven axes use the
same circuit design. This circuit accepts six input signals: Power supply ground, CMDX (+/- 10 volt analog
command signal provided by the Galil controller), GNDX (reference ground for the CMDX signal), AMPEN
(TTL amplifier enable signal provided by the Galil controller), and ENABLE (the additional TTL enable signal
provided by a manual switch on the front panel). Each amplifier supplies current to the motor from the power
source (VS).
54
Chapter 5
Software Development and Implementation
5.1 The Dynamic System
It is important to define the dynamic relationships between the various components of the
BAMBI system. In Figure 15, a simplified picture is shown of a sample plate positioned between
the objective lens and the light source of an inverted microscope. This diagram shows the
individual coordinate spaces attached to the 3-axis plate, camera, and sample. When working
with three coordinate systems it becomes important to define the relationships between each of
them and how they relate to the image space used by the computer and seen by the user on the
computer screen.
The dynamic model for robot space is derived from the positive directions of motion for the
linear actuator for each axis. The robotic slide or end effector can move in any of the x, y, and z
directions which can best be described as a right-handed Cartesian system where all three axes of
motion are mutually perpendicular and linear.
Each axis of motion has an independently
controlled corresponding DC motor. The positive direction of the axes indicates the incremental
motion of the DC motor. An assumption is made at this point that there are no cross correlation
terms between any of the axes and that they travel in perfectly linear paths. Obviously there is
some interplay between the axes due to friction and small deviations in straightness of travel and
will have to be accounted for by software.
55
ZS
Microscope Light
Focal Point
Sample
Medium
Polarizer, Prism, Condenser
Robot Plate
XR
YS
ZR
XS
Sample Space
Robot Space
YR
Objective, Prism, Analyzer
YC
Camera Space
ϑ
XC
CCD Camera
ZC
Figure 15: Robot, Sample, and Camera Coordinate Space
A simplified diagram of the light path for in an inverted microscope and the Cartesian coordinate systems
attached to the robotic plate, specimen sample, and camera. Robot space represents the coordinate system
relative to the robot manipulator. Sample space (inset) represents the coordinate system attached to the
chamber, slide, or dish containing the sample. Camera space represents the coordinate system attached to the
camera itself.
56
The dynamic model for the robot is shown below as a state vector pR, which represents the
position of the robot given the state of its motors (xR, yR, zR).
⎡ xR ⎤
p R = ⎢⎢ y R ⎥⎥
⎢⎣ z R ⎥⎦
5.1
The dynamic model of the focal point within the sample is also defined in a left-handled
coordinate system. The origin of the coordinate system is completely arbitrary but it is shown to
be at the center of the current focal point within the sample in Figure 15 (inset). Like in robot
space, the dynamic model for the sample is shown below as state vector pS, which represents the
position of the focal point within the sample.
⎡ xS ⎤
p S = ⎢⎢ y S ⎥⎥
⎢⎣ z S ⎥⎦
5.2
Camera space is shown at the bottom of Figure 15 and represents the image the observer would
see. However, only one degree of freedom is offered by the fact that the camera can be rotated
within its attachment to the microscope about the axis normal to the x-y plane. The dynamic
model for the camera is shown below as a state vector pC, which represents the position of the
camera at any given rotation, θC, in the direction shown in Figure 15.
p C = [ϑC ]
5.3
Image space is illustrated in Figure 16 and defines the coordinate system attached to the image
the observer would see when looking directly at the computer screen. The origin in the upper left
hand corner coincides with the origin of the axis in camera space and represents the first pixel in
the upper left corner of the CCD array. This is identical to the camera space. The left hand
coordinate system was chosen to match the coordinate system used by the Microsoft Graphical
57
Device Interface (GDI) architecture and to provide an intuitive top down view when looking at
the screen.
ZI
xI
pI
XI
zI
yI
YI
Figure 16: Image Space
A representation of the coordinate system attached to the image space when observing the capture image on the
computer screen. This is a left-handed coordinate system wherein the z-axis comes out of the screen toward the
observer. The image origin coincides with the position of the focal point in sample space and the first pixel of
the CCD camera array.
The dynamic model for any position in image space is shown below as a state vector pI, which
represents the position the focal point within the sample.
⎡ xI ⎤
p I = ⎢⎢ y I ⎥⎥
⎢⎣ z I ⎥⎦
5.4
Given that image space and sample space are flipped 180º along the x-axis to each other, this is
again flipped 180º along the x-axis by the optics of the system. Therefore, holding the camera
58
angle at zero, image space and sample space are related by Equation 5.5 where Α is the scaling
vector accounting for the power of the optics.
pI = A ⋅ pS
5.5
The scaling vector is shown in 5.6, where α is the multiplied magnification factors of the
microscope objective and camera adapter lenses. The magnification for is the same in both x and
y directions but is unity in z.
⎡α 0
A = ⎢⎢ 0 α
⎢⎣ 0 0
0⎤
0⎥⎥
1⎥⎦
5.6
The relationship between image space and the position of focal point within the sample space
given the angle of rotation of the camera, ϑC, and the x, y, and z positions of the robot is solved
in the solution below.
Given T is the translational matrix from robot to image space we get:
0⎤
⎡1 0
⎢
T = ⎢0 − 1 0 ⎥⎥
⎢⎣0 0 − 1⎥⎦
5.7
Given R(ϑ) is the rotational matrix from robot to image space provided the angle, ϑ, of the
camera as shown in Figure 15 we get:
⎡ cos(ϑ ) sin(ϑ ) 0⎤
R(ϑ ) = ⎢⎢− sin(ϑ ) cos(ϑ ) 0⎥⎥
⎢⎣ 0
0
1⎥⎦
59
5.8
The combined transformation is the product of the two transforms in Equations 5.7 and 5.8:
0⎤
⎡cos(ϑ ) sin(ϑ )
⎢
R (ϑ ) ⋅ T = ⎢ sin(ϑ ) − cos(ϑ ) 0 ⎥⎥
⎢⎣ 0
0
− 1⎥⎦
5.9
The equation to map coordinates from image space to robot space now defined as the product of
Equations 5.9 and 5.4 and the inverse of the magnification vector Α is shown in Equation 5.10.
p R = A −1 ⋅ R (ϑ ) ⋅ T ⋅ p I
5.10
To map robot space to image space, both sides of Equation 5.10 must be multiplied by the
combined inverse transform to yield the final result in Equation 5.11.
p I = A ⋅ [R(ϑ ) ⋅ T ] ⋅ p R
−1
5.11
The fully solved form of the Equation is shown as Equation 5.12.
x R ⋅ cos(ϑ )
y R ⋅ sin(ϑ )
⎤
⎡
+
2
2
2
2 ⎥
⎢ cos(ϑ ) + sin(ϑ )
cos(ϑ ) + sin(ϑ )
⎥
⎢
x
y R ⋅ cos(ϑ ) ⎥
sin(
ϑ
)
⋅
R
⎢
pI = A ⋅
−
⎢ cos(ϑ ) 2 + sin(ϑ ) 2 cos(ϑ ) 2 + sin(ϑ ) 2 ⎥
⎥
⎢
− zR
⎥
⎢
⎦
⎣
5.12
Ideally the camera angle could be held constant at 0º which would significantly simplify the
mathematics as shown in the following:
60
⎡ xR ⎤
p I = A ⋅ ⎢⎢− y R ⎥⎥
⎢⎣ − z R ⎥⎦
5.13
5.2 Software Implementation
5.2.1 Autofocus
Having reliable autofocus for long-term live cell experiments is critical to the success of the
study when left in unattended operation. Without autofocus the experimenter must make these
unavoidable adjustments by hand often and throughout the entire course of the study. In longterm live cell imaging studies, the time needed between focal corrections may range from every
five minutes to every hour depending on the conditions. The reasons for focus control are many:
temperature drift, mechanical settling, cell movement, and servomotor drift. Not only are the drift
effects significant, they can be long lasting as well.
During the initial heat-up phase the focus will drift significantly, but will eventually reach a kind
of equilibrium after one or two hours. However, since the temperature controller will introduce a
small cyclic variance due to the cycling of power to the heater, this will be seen as a small
oscillation in the focal plane. The mechanical settling of the microscope focus mechanism is
usually problematic at the beginning of a time course and tapers off over time but never stops
changing. A big problem is the servo motors themselves as they will generate heat while in
operation and can impart significant changes to the focal plane. Since motors are not always in
constant use, i.e. waiting for the time to elapse for the next acquisition cycle, they will also
impart an oscillation effect on the focal plane.
BAMBI has implemented several autofocus algorithms over its lifetime and each one has proven
to be unreliable for long-term live cell imaging so far. Some of the problems encountered with
autofocus are having multiple focus curves, vibration, background noise, varying experimental
conditions, and the limited time required for focus. Multiple focus curves are generated when
there are several objects at different depths within the focal range that are in-focus. Vibration can
hamper any work on a microscope as it causes significant blurring of the images. Generally,
vibration is dampened out as much as possible before starting a run; however a single vibration
event during an autofocus correction procedure could have unpredictable results. Once focus is
61
lost, it is usually hard to get back programmatically. Background noise can confuse some
algorithms that define good focus as the amount of information contained by an image such as a
derivative or entropy approach. Performance of an autofocus algorithm can be very dependant on
the type of Illumination used (Sun et al., 2004). Various cell cultures and media conditions can
also play a role in how well the focus function performs.
The focus function chosen for BAMBI performs well over a wide range of conditions including
Bright Field, DIC, and fluorescence illuminations (see Equation 5.14). Normalized variance is a
statistical measure of focus that weighs the deviation of intensity from the background with a
power function.
Fnormalized _ var iance =
1
H ⋅W ⋅ μ
Height Width
∑ ∑ (i(x, y ) − μ )
x =0
2
5.14
y =0
The benefit of using this method is that is not as sensitive to noise compared with the gradient or
derivative methods. However, the problem of having multiple in focus objects causes a great
deal of confusion. This can be caused by having cells imaged in a microwell, where the well
walls themselves exhibit in-focus features. Other environment factors like the surface of the
glass slide or gap chamber can also cause confusion.
The next step in developing this algorithm further is to have BAMBI only allow the focus
function to be calculated inside small window selected from within a field-of-view.
This way
only the object of interest inside the window will be optimized for focus. Other techniques could
be tested, such as implementing a fuzzy approach to make the best guess as to which focal
maxima to select or combining several autofocus functions and taking a weighted average.
5.2.2 Automatic Image Stitching
BAMBI implements the automatic tiling or stitching of images in a very straightforward manner.
Because the accuracy of the servomotors are well within a micron when backlash is corrected for
the images can simply be tiled according to the value of the servo motor coordinates for each
image. Applying Equation 5.13 to convert from motor units to pixel locations is all that is
required provided the rotation of the camera is precisely 0º. As well, BAMBI does not have to
account for lens aberration since the objectives used are highly corrected and introduce very little
optical error to the images themselves.
62
5.2.3 Backlash Compensation
Backlash exists in practically every mechanical system that involves friction, gears or drives. It
can occur whenever a mechanism changes its direction or rate of travel. Its cause is well known
and is usually designed out of the system as much as possible before it is manufactured. An
example of a backlash characteristic is shown in Figure 17.
Output
Input
Figure 17: Static Backlash Characteristic
Each time the direction of movement changes sign there is a loss of contact in the gears between the load and
the motion. This figure is adapted from (Lewis et al., 1997).
Each of the Galil M-112 micro-translation servos is backlash compensated to less than 2 µm by
the use of precision lead screws and gear head. Linear guides with precision ball bearings insure
that the straightness of travel deviates no more than 0.5 µm. These linear guides are
manufactured with very tight tolerances to reduce backlash and maintain low friction. However,
in actual operation when the servo changes direction there is a small amount of sidelash that
occurs. Sidelash is a term for the complementary backlash experienced by the orthogonal
direction of motion. That is, if the x-axis direction of travel was stopped and reversed, there
would be a small change in the y-axis position. This is due to the small amount of free play
between the linear guides and the moment of inertia generated by the offset location of the servo
lead screw.
63
When BAMBI is working at high magnifications a backlash of 2 µm can be quite significant and
must be compensated for by other means.
Backlash correction can be achieved by the
introduction of a position sensor on the load (end-effector) with feedback to the control
algorithm. This is called Dual-Loop-Feedback-Control. Because the micro-translation stages are
complete solutions with shrouded compact components it would be too costly and bulky to add
more hardware to implement. In light of this difficulty, two software approaches to correct for
backlash have been investigated and implemented in the BAMBI software.
The first method shown in Figure 8 works on the principle that the once backlash is measured for
each servo's direction of travel it does not change with time. The correction is performed each
time the direction motion changes sign. This method also requires a homing movement to be
performed prior to use to ensure the servomotor is not currently dwelling in the backlash noncontact region when the first movement is made. This was implemented by having the servos all
move in the negative direction, well beyond the backlash value and then forward again the same
distance. This ensured that the servos had no free play between the load and the motion in the
forward direction. Figure 18 shows how the algorithm would work for a single axis.
Get Target
No
Sign of Direction
Changed?
Yes
New Position = Current Position + Backlash * Old Sign
Move to Target
Figure 18: Backlash Correction Method 1
This figure shows the logic for negating backlash when the backlash value has been measured for a servo.
When the sign of the motion command changes the current position is overwritten with the new corrected
position value before the movement command is allowed to continue.
64
The drawback to this method of correction is that the position values of the servos are rewritten
each time the servo changes direction; therefore, a small amount of round off error will be
introduced to the system each time the direction changes. When this algorithm was implemented
on BAMBI it was shown to drift over time due to this effect. A possible solution to the problem
would be to avoid overwriting the position value and use an offset variable whenever reporting
positions back to the program. That way there would be no loss of information due to round off,
because the offset is only applied whenever the position is reported. Another confounding
problem with this method was only observed during live cell imaging when the temperature
effects became an issue. Live cell imaging requires the environment chamber to be heated to 37º
Celsius. Additionally, the trajectory of the robot is composed of one hundred waypoints or more,
which will heat the motors up to 53º Celsius depending on the speed and torque settings. The
temperature has a huge effect on the value of the backlash, possibly due to the high gear ratio.
The effects on the backlash are of a cyclic nature due to the capture cycle of the arrays. The
motors heat up during a capture cycle and cool back down while waiting for the next cycle to
begin.
The second method of backlash correction is a more straightforward approach. That is, each point
in a trajectory or path is always approached from the same direction for each servo (see Figure
19).
Get Target
No
Negative
Direction?
Yes
Move to (Target – Backlash)
Move to Target
Figure 19: Backlash Correction Method 2
This figure shows the logic for negating backlash by approaching the target from the same direction each time.
The value of the backlash correction is slightly greater than the actual measured backlash to avoid temperature
and torque effects.
65
Like in the previous method, this technique still requires a homing maneuver to take place before
the first movement is made to ensure that the servo does not start in a non-contact region. It is not
subject to the round off errors in the first method and would always work provided the backlash
correction was greater than the actual backlash to account for temperature and torque effects.
The implementation of this algorithm on BAMBI proved to be successful. There was still drift in
the position of the servo due to the cyclic heating of the motors during operation, but it was
minimized compared to first method. The drift in position due to temperature effects could not
be avoided and tended to oscillate less and less as the experiment continued.
One drawback to this method is that it requires a more complicated the trajectory path to ensure
each waypoint is approached from the same direction. It significantly increased the number
movements needed. It also requires more communication and coordinated timing between the
Galil controller card and the BAMBI application. Some application threads had to wait on the
backlash maneuver to complete before completing their function.
This required additional
process threads to be created and inter thread communication to be implemented to coordinate
their actions.
Ultimately, the second method ensured there was no free play between the motor and the load
regardless of the temperature when approaching from the same direction. The distance required
to correct for backlash was approximately three times the measured backlash to ensure that the
distance corrected for would not be susceptible to heat or torque effects. If a backlash correction
was needed it was found that it was better to perform a backlash correction maneuver for all three
axes to minimize the co-variance or sidelash effects between the adjoined axes mentioned earlier.
For these reasons, the second method of backlash correction was chosen to be used in the final
BAMBI design.
5.2.4 BAMBI Image Space
BAMBI software uses the left-handed coordinate system described in Figure 16 to draw the
images on the screen. That is, the camera image is displayed in this format with the horizontal
direction corresponding to x and the vertical direction corresponding to y. Elevation, z, is
positive in the direction coming out of the x-y plane, the computer screen, towards the observer.
Angles are measured about the z-axis starting at the x-axis and increase in positive value in the
clockwise, x to y, rotation. Since the image is in units of pixels there must be a mapping between
pixels and actual motor units given the magnification of the camera and the objective lens. If we
66
assume the camera to be orientated such that its x and y axes are exactly parallel to the x and y
axes of the image space then we can eliminate the rotational term in Equation 5.10 to get the
position of the robot in motor units as a function of image position:
⎡ xI ⎤
p R = A ⋅ ⎢⎢− y I ⎥⎥
⎢⎣ − z I ⎥⎦
−1
5.15
Here, A is the magnification vector of the objective and camera adapter lenses or the scaling
values between the camera and image space. Displaying an image on a computer screen requires
that the units are in terms of pixels. Therefore, an additional step must be taken to relate the
screen pixels with motor units. The final equation relating the position of the robot to image
space given magnification, pixel size, and motor unit size is:
⎡ xI ⎤
p R = A ⋅ C ⋅ M ⋅ ⎢⎢− y I ⎥⎥
⎢⎣ − z I ⎥⎦
−1
5.16
The two additional constants are C, the size in millimeters of one element on the CCD array, and
M, the number of motor units per millimeter. This equation assumes that C and M are the same
for both x and y directions. If this is not the case, then C or M could be replaced with a vector of
constants instead. The z term in such a vector would be arbitrarily chosen to match one of the x
or y directions resulting in a volumetric representation of pixel size called a voxel. Both of these
constants can be found in the specifications of the servo/encoder and digital camera used. In the
case for BAMBI, the Galil M-112.1DS motors have a count of 145636 motor units per
millimeter, and the Sony XCD-SX910/710 cameras have a square pixel size of 0.00465
millimeters per pixel.
5.2.5 Mosaic Capture and Trajectory Generation
The process of capturing images for a long-term live cell imaging can be very different from one
experiment to the next.
It depends strongly on the type of information needed and the
constraints/conditions imposed by the cells themselves. Experiments can range from a single
field-of-view captured through time using only DIC illumination to many fields-of-view
67
spanning x, y, and z captured through time at different intervals for both DIC and fluorescent
illumination. The hardiness of the cell types will determine the exposure time or how often they
can be illuminated before damage starts to occur. If the goal of the experiment is to find a low
frequency event then many fields-of-view will need to be imaged with enough optical resolution
to answer the questions the experiment is designed to solve. As resolution goes up, the number
of fields-of-view needed will also go up. A balance must be made between the resolutions
required, the size of the image field and the exposure cycle time allowed by the cells and the
physical limits of the robot itself.
BAMBI divides possible experiments into three categories: 2-D time courses, 3-D time courses
or hypercubes, and multi-channel fluorescence. These three categories can be used alone or in
combination to generate a complete live cell imaging time course.
5.2.5.1 2-D Time Course
The 2-D time course is a monolayer consisting of one or more fields-of-view located anywhere in
a defined 2-D plane (See Figure 20). This will generate a 2-D image mosaic through time easily
viewable on a 2-D workspace. The plane that the images or waypoints will be generated on can
be created by several methods. The user can define a starting position in (x, y, z), a row and
column grid spacing, and the number of waypoints in the x and y direction. This holds the z-axis
constant and automatically generates the waypoints to fill in the space defined.
Alternatively, the user can define a three points on the bounding area of a rectangular 3-D plane.
That is, the plane is defined by the (x, y, z) positions for the upper left, upper right, and lower
right corners. Given the row and column grid spacing the program will fill the plane with as
many waypoints that can fit in the bounded region. The program will generate the z component
of any waypoint given its row and column (m, n), the step sizes ∆x and ∆y, and the gradient
∂z
∂z
components
and
(See Equation 5.17).
∂y
∂x
Z (m , n ) = Z (0 , 0 ) + n ⋅
∂z
∂z
⋅ Δx + m ⋅ ⋅ Δy
∂x
∂y
5.17
This approach enables straightforward 2-D image mosaic construction when the ROI in the
specimen is not strictly parallel to the microscope's axis.
68
Figure 20: 2-D Time Course
A 2-D time course is shown as a single plane of focus through the objects of interest. The plane represents the
region in XYZ space wherein image locations are to be placed. The three balls represent spherical cells that are
in the region of interest (ROI) of the cell culture.
The trajectory or path generation is simply a matter of generating the waypoints in the correct
order for image capture. The BAMBI software makes a distinction between two image capture
paths for a 2-D Time course: the top down S-curve or the top down left to right Zigzag
trajectories (see Figure 21).
B
A
X
Y
1
2
3
4
1
2
3
4
8
7
6
5
8
7
6
5
9
10
11
12
9
10
11
12
16
15
14
13
16
15
14
13
Figure 21: 2-D Time Course Paths
Two robotic stage path patterns for collecting a 2-D set of images. A. S-Curve pattern. B. Zigzag pattern. The
stage takes less time to complete the S-curve pattern than the Zigzag, but is less amenable for real time
visualization.
69
The S-curve method provides a does not have to return to the far left column after it captures
each row, therefore it has a shorter path to follow resulting in faster cycle times. This is
especially important when there are many fields-of-view to acquire with short cycle times.
Another benefit is that when the images are later stitched together to form a mosaic, the shorter
paths translate to shorter time intervals between fields-of-view directly above or below one
another. That is, the smaller time interval between images in the row above or below minimizes
live cell movement between the frames. A drawback to this method is that it requires additional
processing and attention to the way in which the image data is opened in other editor programs.
It breaks the continuity of batch processing algorithms that rely on monotonically increasing file
offsets to access data in the file structure. (i.e. if the mosaic is to be inversed or flipped and the
final row contains less than the full amount of columns, they must be zero padded with blank
data before flipping). However, this problem can be overcome by using the actual logged
coordinates of each image to load the raw image files rather than a predefined path.
5.2.5.2 Hypercubes
An extension to the 2-D time course is a 3-D time course called a hypercube (see Figure 22).
The added dimension is in the z direction thus creating a volume of waypoints in the space (x, y,
z). Others have referred to this as 4-D image acquisition with the extra fourth dimension defined
as time, indicating that it is in fact a 3-D time course (Burglin, 2000). Similar to the 2-D time
course, the hypercube can be defined by a point (x, y, z) in 3-D space with defined rows and
columns an additional grid spacing, ∆z, called a slice.
As before, the user can define a hypercube by selecting 3 points on the boundary of a plane in 3D space and specifying the row, column, and slice step size. The gradient method is used to
calculate the first surface (top plane) and the z-slices are just offsets from this plane. To calculate
the z positions, x and y are held constant and an offset is applied to the z value for each waypoint
below it. Therefore, in a strict sense, the hypercube may not be exactly orthogonal. However,
these effects are small and can be ignored with no impact to the results of the study.
70
Figure 22: Hypercube
A 3-D time course is shown as a stack of eight focal planes in 3-D sample space. The spheres represent cells or
cell aggregates that are in the culture medium.
The transparency of the cells, the media, the contrasting method, and the numerical aperture of
the object lens determine how far the waypoints can effectively span in the z direction. Almost
all hypercubes must be imaged with DIC or a very high NA lens to help remove the unwanted
light from above and below the image plane. Under these conditions is possible to provide a
confocal-like result with depths as great as 25 um.
The path generation is identical to the 2-D time course except for each waypoint in the first
surface (top plane) there are an additional set of waypoints created incrementally in the negative
z direction. The negative z direction corresponds to an upward motion of the stage. The upward
motion of the stage helps to reduce focal drift resulting from gravitational settling in the
mechanical system. Figure 23 shows how the path would be generated for the first row of either
of the 2-D time courses presented in Figure 21. The same procedure is applied for any subsequent
rows.
71
1
4
7
2
5
Z
8
3
6
X
Y
9
Figure 23: 3-D Path Generation
This figure illustrates the robotic stage trajectory pattern for the first row of a 3-D set of images. The waypoints
1, 4, and 7 lay on the top surface of the 2-D plane and are generated according to the S-curve or Zigzag pattern
specified. The next waypoint in the trajectory, 10 will be located on the top surface, below 7 if the S-curve
pattern is chosen and below 1 if the Zigzag pattern is chosen.
5.2.5.3 Multi-channel Fluorescence
Multi-channel fluorescence imaging is an extension to the concept of the hypercube in that it
adds an additional dimension to the time course. The hypercube now becomes a vector H,
composed of the three spatial dimensions (x, y, z), time t, and illumination ρ (see Equation 5.18).
H= x
y
z t
ρ
5.18
BAMBI is equipped with a LED array that can be used to illuminate the cells with up to five
different excitation wavelengths. Multi-channel fluorescence significantly increases the amount
of information that can be gathered from a long-term live cell study. BAMBI can take advantage
of the fluorescent properties of some inorganic and organic molecules that act as fluorophores to
image specific targets or binding sites in a specimen. By introducing several different colored
fluorophores multi-fluorescent images can be taken to image different targets at the same time
point, respectively.
72
5.2.6 Mosaic Blocks
The amount of information that can be contained in a single square centimeter of a specimen
slide is extremely large. Of course, this depends on what features the experiment is looking and
this in turn will determine the magnification, illumination, and cycle times. This forms the upper
limit to the amount of space that can possibly be imaged for a given study. Sometimes the
features of interest or ROI are sparsely located throughout a large area and other times they are
close together in a few small groups or aggregates. In either case, there are regions of the space
that contain no valuable information and regions that do; therefore it makes sense to only image
the ones that do. BAMBI solves this by introducing dynamic mosaic blocks.
Mosaic blocks are a set of waypoints that have been defined in 2-D or as a hypercube for a
specific ROI. An experiment can have more than one mosaic block. Each block embodies a
complete long-term live cell imaging study unto them selves. They contain all the information
necessary to navigate to the points, capture the images, store the data, and report back to the main
program. They can be dynamically created and destroyed at any point in the experiment,
allowing the user to capture a newly found feature of interest or stop imaging an area that cells
have died or is no longer of value. Another special feature of mosaic blocks is that they can grow
in size, shrink, and even move within the space as needed.
5.2.7 Mosaic Block File Structures
BAMBI stores the setup information for all mosaic blocks in a single file with the filename
extension “bam”. The BAMBI "bam" file format is fully described in Appendix C.1. Each
mosaic block has its own set of files for actual data storage. The data storage files come in pairs
for each illumination source used by the block. The actual image data is stored in a raw “flat
file” format composed of consecutive 8-bit pixel values with the extension “raw”. The actual
position the robot, timestamp, and identification information is stored in a corresponding commaseparated file with the extension “csv”. If the illumination source is fluorescent then the image
files are further separated into two raw formats, one for fluorescent and the other for DIC
illumination. (See Figure 24.)
73
DIC 2
t=3
DIC 1
t=3
DIC 2
t=2
DIC 1
DIC 2
Fluorescent 2
t=3
t=2
Fluorescent 1
t=3
t=1
Background 1
t=3
DIC 1
t=1
Fluorescent 2
t=0
DIC 2
t=0
Fluorescent 1
t=0
DIC 1
t=0
Background 1
t=0
A.
B.
Figure 24: Mosaic Block Raw File Structures
This figure shows the files structure for a single mosaic block composed of only 2 fields of view (1 and 2)
captured in both DIC and fluorescent illumination. The sample period shown for DIC and Fluorescence is t=1
and t=3. A. The file storage pattern for DIC (could also be phase contrast or bright field) illuminated images. B.
The file storage pattern for the fluorescent illuminated images.
Because fluorescence illumination is not as bright as DIC, several images are taken and summed
to create a single viable image. When this is done, the background noise present in the images is
amplified. To remove this effect, a set of background images is taken without any illumination
and is subtracted from the summed fluorescence image. The same number of background images
are taken as the fluorescence set. They are only taken once at the beginning of each fluorescence
cycle at the first waypoint. The background noise is not dependant on location as much as it is on
the camera properties like dead pixels and small differences in the CCD element sensitivities.
5.2.8 Mosaic Capture Algorithm
At the heart of BAMBI’s mosaic capture operation is a set of logic trees that allow the individual
mosaic blocks to be captured completely independent of each other, but share the resources in a
concurrent fashion. It is important that the resources which are in different process threads such
as the camera, shutter, illumination, and robot are only manipulated by one mosaic block at a
time. This is accomplished by the use of a single outer control loop that is closed by an OnTimer
event handler. (See Figure 25.)
The OnTimer logic algorithm is shown as an outer control loop that allows entry into three
possible logic blocks: OnTimerFunction, LEDLogic, and DICLogic.
74
OnTimer
OnTimerFunction
DICLogic
LEDLogic
Figure 25: Outer Control Loop
The mosaic capture algorithm's outermost control loop is governed by a Windows event timer that is captured
by the OnTimer message handler. If the appropriate timeout is received the OnTimer handler calls the
OnTimerFunction function which can in turn call the DIC and LED logic algorithms.
The first block is the OnTimer function is a message handler that intercepts the windows timeout
message. If the appropriate timeout is received it calls the OnTimerFunction, otherwise it
releases the timeout message and waits for the next one.
5.2.8.1 OnTimerFunction
The OnTimerFunction purpose is to determine if the user has chosen to stop the data capture
process, and if not, passes the control on to the appropriate logic block (see Figure 26). It checks
to make sure the user has not stopped or paused the mosaic builder, if so it resets the timer and
exits. If the mosaic builder has not been stopped or it checks to see if a mosaic block is in active
capture mode, if so it will check the iChannel variable to see if it needs to be sent for LED or
DIC processing. If not, it will activate the block and check to see if there are any LED Blocks
present. If there are no LED blocks it passed control to the DICLogic function, otherwise it
passes control to the LEDLogic function.
75
Started?
No
Yes
Set Timer
Is Block Active?
No
Yes
Block Mode On
Exit
iChannel>4
No
LEDLogic
Any LEDs?
No
Yes
DICLogic
Yes
iChannel=5
iChannel=1
DICLogic
LEDLogic
Figure 26: OnTimerFunction Logic Tree
The mosaic capture algorithm's OnTimerFunction checks the status of the program to ensure that the user has
not paused or stopped the mosaic builder. If it is in the started state its job is to determine if a block is in active
capture mode, if not it will turn it on. Its job is to pass control to the correct illumination block for further
processing.
5.2.8.2 LED Logic Tree
The function of the LED logic tree is to capture the LED, background, and corresponding DIC
images. The algorithm (See Figure 27) first checks to see if it is in LED mode. That is, has it
already started processing the mosaic block? If not, it checks to see if any of the LED captures
are ready to be taken. Most LED capture times span a cycle of 2 hours or more and so more
often than not, the module will usually set iChannel to 5 and reset the timer. This action will
cause the OnTimerFunction function from above to redirect the block to DICLogic for processing
instead. Only if there are LEDs ready to be captured, does it activate the LED mode and move
the robot to the first waypoint in the mosaic and reset the timer. The robot takes time to get to
the first location, so rather than wait for it to get there, resetting the timer will pass control back
to the program until the robot is ready. If LED mode is activated, it checks to see if the robot has
reached the waypoint and has stopped moving, a state known as on target. If the robot stage is
not on target the routine simply resets the timer and passes control back to the program. If the
robot stage is on target, the routine checks to see if a background image has been taken at this
waypoint. If not, it takes the appropriate number of background images for each LED channel
76
that is ready, resets the timer, and exits. Background images are taken with the camera shutter
speed and gain settings for the respective LED image to be taken, but with the LED light off. If
the background image has been taken, it checks to see if the LEDs are finished. If not, it will
capture all the LEDs that are ready to be taken for this waypoint with the appropriate camera
shutter speed, gain, and LED light enabled. During an image capture event such as LED
accumulates, control is not released back to the graphical user interface (GUI) until the image
capture finishes. The timing of the LED was found to be such a critical part of data collection that
it was allowed to have full access to the executing thread. Future editions can evaluate this
feature in more detail, perhaps allowing the GUI to operate inside an additional thread. In either
case, the control of the thread during image capture will not be given up until the images are
acquired for the waypoint. The extra GUI thread would only allow the user to click on buttons
that would have no actual effect until the images were captured. Once the images are collected, it
enables the DIC illumination, sets the timer, and passes control back to the program.
Once all the LEDs are finished, it checks to see if the DIC images have been taken. If not, it
checks once more to see if the DIC Illumination is enabled. Because the user actually sets the
preload for the spring-loaded electromechanical switch, it can open and close at different rates
from one experiment to another. This code will allow for an additional check on an addition
feedback device such as a limit switch or light sensor to indicate that the shutter has indeed
opened. If the light is not yet enabled, it resends the command to open and resets the timer. If
the light is enabled for DIC Illumination it sets the camera shutter and gain for DIC and captures
the image, closes the shutter and immediately checks to see if there is another waypoint in this
mosaic block to move to.
If the DIC images have all been taken for a given time point the routine checks to see if this
waypoint was the last one in the mosaic block. If it isn’t, it moves the stage to the next waypoint,
resets the timer and exits. If this is the last waypoint it turns off all the active modes, resets the
timer and passes control back to the program. This restarts the process so that the next mosaic
block that is ready can be processed.
77
No
No
Yes
LED Mode?
No
Any LED(s) Ready?
Yes
Set Timer
iChannel=5
Yes
On Target?
No
Background(s) Done?
LED Mode On
No
Exit
Take Background(s)
Yes
Yes
LED(s) Done?
Move to First Waypoint
Take LED(s)
Set Timer
Set Timer
Turn on DIC
Exit
Exit
Set Timer
Exit
No
No
DIC Light On?
DIC Done?
Yes
Yes
Turn on DIC
Take DIC
Set Timer
Turn off DIC
Yes
Last Waypoint?
No
Exit
Block/LED Modes Off
Move to Next Waypoint
Move to Next Block
Set Timer
Set Timer
Exit
Exit
Figure 27: LED Logic Tree
The mosaic capture algorithm's LED logic tree is responsible for the capture of all the LED illumination images
and their corresponding backgrounds. It also takes all the DIC images for that time point to keep the context
between DIC illumination and the fluorophores.
5.2.8.3 DIC Logic Tree
The DIC Logic tree is responsible for the capture of DIC illumination blocks that do not require
fluorescence for the time point (see Figure 28). The function checks to see if it is in DIC mode.
That is, has it started the DIC image capture process? If not, it checks to see if it is time to take a
DIC image for this block. If not, the algorithm turns block active mode off, moves the internal
pointer to the next mosaic block, resets the timer, and exits the function. If it is time to take the
DIC images, the routine turns on the DIC capture mode, moves the robot to the first waypoint in
the mosaic block, turns the DIC light on, resets the timer, and passes control back to the program.
78
No
No
DIC Ready?
Yes
DIC Mode?
No
Yes
Block Mode Off
DIC Mode On
Move to Next Block
Move to First Waypoint
Yes
On Target?
Take DIC
No
Last Waypoint?
Yes
Turn on DIC
Move to Next Waypoint
DIC/Block Mode Off
Set Timer
Set Timer
Turn off DIC
Exit
Exit
Move to Next Block
Set Timer
Exit
Figure 28: DIC Logic Tree
The mosaic capture algorithm's DIC logic tree is responsible for the capture of all the DIC illuminated images
that do not need fluorescence at that time point.
If the DIC mode is active when the program enters the DIC logic tree, it checks to see if it is on
target. If not, the robot is still in motion and the routine resets the timer and exits. If the stage is
on target, a DIC illuminated image is collected and the algorithm checks to see if this was the last
waypoint. If so, it will turn the block mode off, close the DIC shutter, move the internal pointer
to the next mosaic block, reset the timer, and exit the function. Otherwise, the routine moves the
robot to the next waypoint without closing the DIC shutter, resets the timer, and exits.
5.3 Graphical User Interface
From the user perspective the software program is divided into four distinct groups that are
tethered by a single dialog interface (see Figure 29). The Mosaic Editor group provides a GUI to
load raw image files, display them in various ways, and allow editing of images and time courses.
The Robot Control group provides a Navigation Panel through which the user can directly
interact with the robot, view robot properties, and change its settings. The Camera Window
group provides the real time display of the images currently being captured via the Sony camera
and can save these images as snapshots or movies. The final group, Mosaic Builder provides the
user with all the tools and controls needed to set up automatic long-term live cell capture of
79
mosaic blocks. This includes setting up the trajectory paths, illumination conditions, and
managing them.
BAMBI
Main Dialog
Mosaic Editor
Robot Control
Camera Window
Mosaic Builder
Mosaic Viewer
Navigation Panel
Camera View
Mosaic Capture
Brightness &
Contrast
Robot Control
Camera Control
Block Setup
Mosaic Editor
PID Settings
Manual Capture
Light Setup
Image Processing
Robot Properties
Light Control
Information Panel
Figure 29: BAMBI Software User Interface
The BAMBI software is divided into four functional groups that are all accessed via a single dialog interface.
The Mosaic Editor provides the GUI for mosaic display and editing. Robot Control exposes all the functions
necessary to interact with the robot. Camera Window provides a GUI for the real-time display of the camera.
Mosaic Builder provides GUIs to set up, control, and save data from long-term live cell imaging experiments
5.3.1 Mosaic Editor
The Mosaic Editor group provides a set of tools that allow the user to load, edit, view, and export
captured time course files. The first task of the Mosaic Editor is to display the Mosaic Editor
Window GUI (see Figure 30). This widow provides a menu the user can interact with. The first
menu choice "Edit" allows the user to open any raw mosaic block file for display. This can even
include a time course that is currently being captured on BAMBI. File integrity is maintained by
accessing the data in read only mode. Once a time course is opened only one field of view is
displayed on the screen at one time. The Mosaic Editor Window places four slider bars at the
edge of the display to allow the user to navigate the mosaic block by row, column, slice, and time
point.
80
The "Select" menu allows the user to select regions of interest in the form of a bounding
rectangle. The user can export the selection as an image or movie if given a range of time points.
The editor can save images and image sequences in several formats: raw, avi, jpg, and tiff.
Time
Slice
Row
Column
Figure 30: Mosaic Editor Window
The Mosaic Editor Window provides all the functions to load, view, edit and save BAMBI mosaic blocks. It
can display the images as single frames or in a tiled mosaic view. Selected ROI from the time courses can be
saved in image or movie format.
The "Image" menu allows the data to be displayed in different ways. The actual data set can be
reordered to suit different capture patterns and images can be flipped or inversed.
When navigating 2-D or 3-D multi-frame mosaics, the "View" menu allows for 3 modes to view
images on screen: One-up, Four-up, and All up. One-up will display a single field-of-view in 3-D
space given the row, column, slice, and time point as determined by the position of the four slider
bars. Four-up mode increases the display to include exactly four adjacent imaged at a time for a
given time frame and region in space. Four-up mode effectively decreases magnification by a
factor 2 but still maintains the base resolution for display. The All-up mode as the name suggests
displays the entire tiled mosaic at the same base resolution for a specified time point and depth
81
(in the case for a hypercube or 3-D time course). The user can play the movie forward or
backward through time, zoom in or out, and adjust the brightness and contrast settings. The
brightness and contrast settings are very important controls to identify features in fluorescent data
sets, as the dynamic range of the pixel intensities can be very small.
The Mosaic Editor is able to accommodate very large raw files, often 300 Gigabytes or more,
with millisecond load times while navigating the image set. This is possible because the editor
only loads into memory the current images that are displayed. This removes the limit imposed on
most image editors that must load the complete file into memory before viewing.
5.3.2 Robot Control
The Robot Control group encapsulates all the functions required to view, edit and manipulate the
devices attached through the Galil controller card. This currently includes the 3-axis stage and
single axis micromanipulator, electromechanical shutter, and LED array panel. Various dialogs
or panels can be accessed to control each of these processes. When the Robot Control group is
activated for a given microscope, it creates a GUI dialog called The Navigation Panel (see Figure
31).
Figure 31: Navigation panel
The navigation panel is a pushbutton interface for manual control of the robot (3-axis stage and 1-axis
micromanipulator). The colors of the direction arrows indicate the state of the motors. Green: motors are on.
Yellow: motors have tripped a limit switch. Red: motor is off.
The function of the Navigation Panel is to provide the user with a pushbutton interface to control
the robot. Direction arrow keys are provided to move all four motors by manual user mouse click
command.
The directional arrow keys are color coded to help identify the state of the motor
82
without adding too much clutter to the screen. Green indicates that the motor is turned on and is
able to move in the direction indicated by the arrow. Yellow indicates that that the motor has
encountered a limit switch in the direction indicated and will not travel in that direction any
further. Red indicates that the motor is off and both directions of travel are not possible until it is
turned on. An emergency stop button is provided to halt motor movement in all directions if
needed. The user can also define a home position, home, and center on home as needed. The
reset button is provided to reset the motors if an error during manual operation is encountered.
This cycles the motor control off then on. The BL button is used to turn the backlash correction
on or off for manual motor operation. When using the Navigation Panel in conjunction with a
time course, the backlash correction should be enabled to keep the current position inline with the
waypoint positions. If the user is not navigating for a time course, backlash correction can be
turned off to increase the speed of the robot. The step sizes for manual control are user
configurable and are shown in motor units only. The actual robot position is also displayed in
motor units for each axis. If more motor detail is required an additional dialog called the
Information Panel can be opened from the Main Dialog window.
The Information Panel displays the current state and configuration settings for each motor. This
includes the dynamic information: torque, velocity, and static information: reference position,
actual position, position error, stop code, and step size. Apart from step size, additional motor
settings like torque, velocity, and acceleration can be configured from within the Motor Settings
dialog.
BAMBI makes use of a proportional, plus integral, plus derivative (PID) controller to manage
motor motion. This feature is provided by the Galil card itself, but the PID parameters must be
provided for and tuned by the user via the Systems Properties Dialog. This dialog provides the
user with a GUI to set and tune the PID setting for each motor as necessary (see Figure 32). This
dialog was designed to allow the user to quickly change settings and immediately observe the
results of those changes by having BAMBI automatically generate the step response. The step
response for any given set of PID values can be displayed by pressing the Get Step Response
button.
Generally, once the parameters are set for a motor they do not need to be changed unless the
motor is replaced. However, due to varying operating conditions, such as heat and varying mass
of the loads, it may become necessary to tune the parameters. If this must be done during a live
cell imaging experiment, the time to tune the motors must be as short as possible. The automatic
83
step response feedback can significantly speed up tuning the system if the user is knowledgeable
in reading a step response graph.
Figure 32: System Properties Dialog
The System Properties Dialog is used to tune the proportional-integration-derivative (PID) control loop for each
of the motors. There are two automatic tuning methods in addition to the manual method. The dialog provides
a Get Step Response button that will perform a step response on the motor and graphically show the results.
This provides immediate feedback on the validity of the current control parameters.
Generally, the motor should attain the input position as quick as possible with no undershoot and
as little over shoot as possible. It should maintain that position without error before commanded
to return back. On returning back to the start position, it should do so in the exact same manner as
it did for the step target. Figure 32 shows a motor that consistently overshoots the target and
exhibits ringing but does ultimately stop at the correct value. This system would benefit from
additional tuning.
Two methods of automatic tuning are available: General Tuning Method and AutoTune Method.
Both methods employ the built in automatic tuning algorithms provided by the Galil controller
card driver itself (Galil, 2006). The first method steps the motor back and forth while increasing
the values of the PID until it becomes unstable, then the values are backed off to a final value that
84
may be appropriate. This is the most flexible method of tuning but it is not appropriate for the
Physik Instrumente motors on the BAMBI 8-axis amplifier system. The AutoTune Method works
well with the BAMBI 8-axis system. It operates by putting the motor through a series of pulses
of a varying pulse and duration. The optimal cross over frequency is determined and the PID
values are adjusted accordingly.
Sometimes it may be required to fine-tune the parameters after running one of the automatic
methods for a satisfactory response. Various methods of manual tuning are available in the
literature (Astrom et al., 1995; Lewis et al., 1997; Ziegler et al., 1942). A straightforward method
to tune the PID values specific to the BAMBI 8-axis system is presented below:
1. Set KP to 50 -100.
2. Set KI to 0.
3. Set KD to an arbitrary value between 200 and 400
(Approximately four times KP).
4. Increase KP until the system just meets the target position on
the step response curve
5. Gradually increase both KD and KP if necessary until a quick
response time is seen.
6. If there is some steady state error, gradually increase KI until
the final position error is zero and desired response time is
met without too much ringing.
5.3.3 Camera Window
The camera window provides a real time display of the Sony CCD cameras allowing the user to
change camera settings and view the current image on the screen. The user can independently
adjust the view’s brightness and contrast without changing settings on the camera itself. This
helps to preserve the original dynamic range of intensity values for the image being collected.
The user can choose between the available resolutions for the camera and the frame capture rate.
While in operation the user can dynamically adjust the gain and shutter speed of the camera
85
hardware for the best performance as needed. The origin of the image, upper left corner on the
screen, is mapped to motor units from the actual position of the 3-axis stage. The coordinates are
displayed in the status bar at the bottom of the camera window. The position values are updated
with the appropriate offsets as the user moves the mouse anywhere within the window view.
Single image captures and movie captures can be saved to file as needed. The movie capture
mode is useful for saving a video record of a manually controlled robotic procedure such as pickand-place operations with the micropipette.
5.3.4 Mosaic Builder
The Mosaic Builder is the GUI that allows the user to set up automatic time courses. Time
courses composed of one or more mosaic blocks. Each mosaic block contains a set of waypoints,
illumination rules, and camera parameters (see Figure 33). The complexity of a mosaic block can
range from a single DIC illuminated field-of-view captured through time to a set of fields-ofview in a 3-D volume with DIC and fluorescent illumination through time. Mosaic blocks are
displayed in a recursive tree view to make viewing and modification of block settings very
efficient and user friendly.
Figure 33: Mosaic Builder Dialog
The Mosaic Builder window is shown to illustrate the GUI design for the setup, control, and storage of longterm live cell imaging experiments. Mosaic blocks are displayed in a recursive tree view.
86
Each mosaic block with all of its respective properties is displayed in a recursive tree list format.
This allows the user to select the level of detail as needed. It also provides a user friendly and
intuitive interface for viewing and changing parameters on the fly. The ability to stop a time
course and change the settings for a mosaic block after a live run has started is a boon to the
success of the experiment. Allowing blocks to grow, shrink, and follow the ROI as needed
greatly increases the amount of valid information captured.
5.4 Code Considerations
BAMBI has been developed entirely in C++ using Windows Visual Studio 2005 MFC. The
camera control drivers were adapted from Chris Baker and Iwan Ulrich’s version 6.3 CMU 1394
camera driver from Carnegie Melon University (Baker & Ulrich, 2004). Galil provided the
motor control drivers and library files for use with Visual C++ 2005.
Originally, the early
versions of BAMBI employed Windows NT drivers and software developed in-house to support
Physik Instrumente C-812 (Karlsruhe, Germany) motor control card but this code became
obsolete when the new motors and controller cards were purchased. Throughout the development
of BAMBI, different devices and applications were implemented to support the new
specifications of experiments and assays within the lab. Designs were implemented and tested;
redesigned and retested as needed; resulting in numerous changes to the existing software. Some
of these additions were kept and some abandoned in favor of final approaches presented herein.
In order to minimize the effort required on the programmer to implement these changes the
underlying code had to be easy to change and swap in or out different code sections. To this end,
BAMBI was developed within an object-orientated framework from the very beginning.
5.4.1 The Windows Programming Model
5.4.1.1 Microsoft’s Foundation Classes (MFC)
Since the introduction of Windows in 1987, Microsoft had created an object-based Application
Interface (Windows API) that allowed programmers to interact with system objects.
As
Windows and the Windows API developed further an object orientated wrapper for C++ was
created called Application Frameworks (AFX) that later evolved into the Microsoft Foundation
Classes (MFC) that is in use today. MFC is a set of object-orientated C++ classes that affords
programmers all the advantages of object orientated code design. Object orientated code design
depends on three guiding concepts: encapsulation, inheritance, and polymorphism.
87
(1)
Encapsulation: hides the system objects such as windows, graphic cards, and hard drives and
represents them as a simple handle or pointer. (2) Inheritance: grants the programmer the ability
to inherit all the code from an existing class and even expand on it. (3) Polymorphism: is the
ability to change the way an existing block of code from an inherited class is implemented
(White et al., 1999).
5.4.1.2 Windows Message Loop
Every Microsoft Windows application has a message loop that allows it to handle local and
system events in a queued manner. System events can be passed from one program or application
to another and used to communicate between them. Local events are passed between windows,
dialogs and threads within a single application. Every Windows program begins execution with a
WinMain() function that provides an entry point for all the subsequent processes such as
windows, dialogs, and views for the application. The WinMain() function is the equivalent
windows version of the Run() function found in MS-DOS applications and there can be only one.
The WinMain() function illustrated in Figure 34 implements a continuous message loop that
grabs the topmost message from the local event cue, translates, and dispatches it to the
appropriate message handler. In this case, the message handler is the WinProc() for the window
shown in the diagram.
88
-
x
Window
Local Event Queue
Msg 1
Msg 2
.
.
.
.
Msg n
WinMain()
Message Handler
GetMessage()
WinProc()
{
.
.
.
}
TranslateMessage()
DispatchMessage()
Figure 34: Windows Message Loop Event Handling
This figure shows the Windows main message loop event handling. Each instanced window communicates
with the rest of the program via the Winmain() function. This diagram was adapted from (LaMothe, 2003).
5.4.1.3 Multithreading in MFC
In order to take direct advantage of multiple central processing units (CPUs) a solution must
implement multiple threads. However, a single processor can still benefit from multi-threading as
well by allowing applications to better control the concurrency of operations by the CPU. A
thread is defined as a single unit of executing code within a process or application (White et al.,
1999). In MFC there are two major types of threads: Worker Threads and User Interface Threads.
A worker thread can complete tasks that do not require windows event processing or GUIs such
as windows or dialogs. User interface threads have access to the event queue and can create and
destroy GUIs as needed.
Each Windows application has at least one thread object called
CWinApp which is a subclass of the user interface thread.
Assigning worker threads is relatively straightforward and requires very little code to create and
destroy them. Worker threads are useful to perform lengthy calculations that would otherwise tie
up the main window thread. This is not ideal, as it will cause the window or dialog to lock until
the required calculations have been completed. User interface threads on the other hand, require
much more code to create and destroy them properly. However, they can instance user interface
classes such as more windows and dialogs which the worker threads cannot.
89
5.4.2 BAMBI Class Structure
BAMBI has been designed in a modular fashion in an effort to keep the code groups within their
own context as much as possible. In other words, if a module were removed from the code, the
rest of the code should still be able to function normally. Obviously the jobs that the module
may have performed would not be accessible, but the program would nevertheless be able to run
and continue to perform the unaffected operations. Figure 35 illustrates how the classes of
BAMBI are related to each other through ownership. The parent or owner of all BAMBI classes
is the CBAMBIApp. It can create two graphical user interface threads: CMosaicBuilderThread
and CNavpanelThread. It can also create a single instance of four classes: CRobotControl,
CCameraFrame, CCameraFrame, CBAMBIDlg, and CChooseDlg. It can also create as many
instances of the class CImageFrame as needed. Each one of these classes, except for the
CChooseDlg, may in turn create other class instances as needed by the program.
90
Figure 35: Class Ownership Diagram
This figure illustrates the class creation and ownership in BAMBI. Dotted lines represent new user interface
thread objects instanced from the calling class and dash-dot lines represent worker threads.
91
5.4.2.1 CBAMBIApp
CBAMBIApp is inherited from CWinApp, the main user interface thread in this Windows
application. Its job is to create the first GUI, in this case the CBAMBIDlg, and any subsequent
windows or user interface threads as needed. It retains pointers and handles to the objects
created, allowing them to be used by other classes, and in the event of a shutdown it can destroy
them in a safe manner. It can also create the CImageFrame, CRobotControl, CChooseDlg,
CCameraFrame, and CImageFrame windows in addition to two graphical user interface threads
called the CMosaicBuilderThread and CNavPanelThread. Because the CImageFrame does not
have limits on how many instances are allowed to run, CBAMBIApp can create more than one
instance as needed. This allows the user to have multiple images or mosaic blocks open and
displayed simultaneously on the screen at the same time.
5.4.2.2 CBAMBIDlg
CBAMBIDlg is the first GUI that opens and is the main user dialog interface through which the
user is able to call on CBAMBIApp indirectly to perform desired actions. There is no visible
window for CBAMBIApp other than the CBAMBIDlg dialog. CBAMBIDlg coordinates the
actions of CBAMBIApp by providing the user with a menu dialog from where choices can be
entered to instance the appropriate classes needed. Therefore, CBAMBIDlg remains available
throughout the entire duration of the program. In most Windows applications the CWinApp is
usually accessed through a main window interface instead of a dialog interface. A window
interface supports a document view in addition to the menu options where as a dialog only has
menu items. This is similar to opening Microsoft Word and having a blank document page show
up ready to be filled with text. Since BAMBI does not have this need, in fact it is not even
certain what kind of job the user has in mind, it is better to start with a list of choices before
assuming a window view will even be needed.
5.4.2.3 CAboutDlg
The CAboutDlg is created by the CBAMBIDlg interface to display general information about the
BAMBI program. This includes the currently running code version, copyright information, and a
general dialog about the BAMBI and its creators.
92
5.4.2.4 CChooseDlg
The CChooseDlg is a dialog created by the CBAMBIApp to force the user to choose which
microscope is to be used if it detects the 8-axis version of the Galil controller. The choice will be
either M1 corresponding to axes 1-4, or M2 corresponding to axes 5-8.
This allows
CBAMBIApp to access the correct registry values for the servos, shutter, and LED array being
used.
5.4.2.5 CMosaicBuilderThread
CBAMBIApp is responsible for the creation of CMosaicBuilderThread, a user interface thread.
This thread manages the entire mosaic capture process by allowing all the mosaic builder related
GUIs to run in a separate thread from the main user interface. The first task of
CMosaicBuilderThread is to create a CMosaicBuilder dialog box from which the user can
interact with. The decision to place the mosaic builder application in a separate thread was to
avoid lock ups between the CBAMBIApp and the CMosaicBuilder classes. During automated
image capture, the CBAMBIApp thread will wait on events from the DMC Controller card that
would cause a single threaded process to become blocked or locked.
5.4.2.6 CMosaicBuilder
The CMosaicBuilder class is the main dialog GUI used for the creation and management of
mosaic blocks for long-term live cell imaging. It displays the tree list view of the mosaic blocks
and contains all the algorithms for running a time course. It also contains the code to load and
export the "bam" files.
5.4.2.7 CFileChooser
The CFileChooser dialog is a subclass of the MFC CFileDialog. Its purpose is to provide a GUI
dialog to allow the user to create, save, and load files from computer system. Sub classing
CFileDialog allowed BAMBI to access to private variables in CFileDialog that were needed to
separate file names from the file paths during saving and retrieval.
5.4.2.8 CMosaicBlock
A CMosaicBlock class contains all the parameters that define a BAMBI Mosaic Block. It is
created by CMosaicBuilder and inserted into the CObject list of CMosaicBlocks for the current
93
time course. The structure and function of each parameter of CMosaicBlock is fully defined in
Appendix C.2.
5.4.2.9 CWayPoint
Each CMosaicBlock class contains a CObject list of CWayPoints that are created when the
mosaic array is calculated. CWayPoint is a subclass of CObject and contains the ID, (x, y, z)
coordinates, and state of the enable for the waypoint.
5.4.2.10 CBlockBuilderDlg
The CBlockBuilder class is a dialog GUI created by CMosaicBuilder to enable the user to create
a mosaic block. It also allows the user to easily generate waypoints from defined coordinates and
parameters.
5.4.2.11 CLightBuilderDlg
The CLightBuilderDlg class is a dialog GUI created by CMosaicBuilder to enable the user to
setup the illumination settings for the mosaic block. This includes DIC and multi-channel
fluorescence.
5.4.2.12 CBMEditCtl
The CBMEdtCtl is a small dialog GUI created by CMosaicBuilder to allow the user to easily
navigate to the waypoints in a mosaic block. Once at a waypoint, the coordinates can be adjusted
if needed and the results saved. CMBEditCtl also allows the user to enable or disable the
waypoint from being captured.
5.4.2.13 CBlockTreeCtrl
CBlockTreeCtrl is sub classed from CTreeCtrl and is created by CMosaicBuilder. This class
implements the mosaic block tree view that is displayed in the CMosaicBuilder dialog.
5.4.2.14 CNavPanelThread
CBAMBIApp is the parent for the CNavPanelThread, a user interface thread. Upon creation, this
thread instances the CNavPanel dialog. Like the CmosaicBuilderThread, a user interface thread
94
is required to display the Navigation Panel to avoid lock ups when the main user thread is waiting
on a robot move.
5.4.2.15 CNavPanel
The CNavPanel class is a dialog created by CNavPanelThread to allow the user to interact with
and control the 3-axis stage and micromanipulator. It is a Friend Class of CRobotControl. The
friend status allows CNavPanel to access all the private members and functions of
CRobotControl. However, since CNavPanel can access the private functions of CRobotControl,
great care must be taken to ensure that it takes into account any offsets that may have been
imposed by CRobotControl. Otherwise, it is possible to unintentionally access the control of the
wrong four axes that may have been granted to possible concurrent instance of the BAMBI
program.
5.4.2.16 CRobotControl
CRobotControl is inherited from CWnd and serves as the main interface and interpreter to the
Galil DMC Controller card. It is created by CBAMBIApp directly and runs within the same
thread as CBAMBIApp. Technically, CRobotCotnrol is an instance of a window interface, but it
is never made visible. There are several reasons for this: In order for a class to respond to
system event messages like user configured interrupts they must be able to access the WinMain()
message loop which is available to classes derived from CWnd. In addition, CRobotControl
serves as the parent window for CInfoPanel and CArrayBuilder dialogs. Because dialogs
minimize whenever a parent window is minimized it was not appropriate to attach these dialogs
to any parent window that could be inadvertently closed or minimized. Since the CRobotControl
is a window class, but it has not been made visible, these child dialogs can remain (on top) when
needed and are never minimized due to the parent window being minimized.
The CRobotControl class marshals the 3-axis stage, 1-axis micromanipulator, LED panel, and
electromechanical shutter. This class is made available to the other windows, dialogs, and
threads by making it a global object. It operates as a gatekeeper, exposing all the functions
necessary to operate the DMC controller in public functions. By forcing the classes to use the
public methods exposed by CRobotControl it becomes straightforward to make changes to the
way the controller is used because the code only needs to be modified in one class. This
encapsulation allows the code to adapt to changes such as replacing the controller with a new
95
design or manufacture very quickly. This encapsulation also has the benefit of being able to
providing translations or offsets globally in one place. This is important when the program is
started on an eight axis-controller card because the CRobotControl class must know which four
of the eight axes are to be used but the calling function does not. Therefore, it can simply add an
offset of 0 or 4 to all the internal commands without having to involve every part of the program
that needs to operate the controller.
5.4.2.17 CRobotThread
During CRobotControl creation, a new worker thread called RobotThread is started with a handle
to the DMC Controller Card. This worker threads sole task is to pole the controller for any errors
in communication. It was implemented as a work around for a problem found when running two
instances of the BAMBI program on the same controller card. When one application terminates
its HANDLE to the DMC Controller Card, the driver issues a card command that shuts down any
communication with the buffer. This is not a problem unless you have another application using
the card at the same time, as it will lose communication with the update buffer as well. The
worker thread poles the card’s buffer count, if it should ever receive the same value twice in a
row, it will issue a command to reinstate communication with the buffer. Galil Inc. has been
informed of this issue with the "Accelera" models, but to date has not yet published a fix for it.
5.4.2.18 CInfoPanel
The CInfoPanel is a dialog GUI created by CRobotControl to display and edit the current state
and configuration settings for each motor.
5.4.2.19 CArrayBuilder
The CArrayBuilder is a dialog GUI created by CRobotControl for semi-automated construction
of microwell plates.
5.4.2.20 CCameraFrame
The CCameraFrame is inherited from CMainFrame and contains a single CView object, the
CCameraView. The CCameraView is responsible for the display of the video images captured
by the Sony 1394 Firewire camera. It creates a C1894Camera object and passes its handle to a
new worker thread called the CameraThread. This thread is responsible for the continual update
96
of the display image buffer located in memory. The CCameraView also exposes access to its
settings with a GUI dialog, the C1394CameraDlg, whenever it is required. The CCameraFrame
is also the parent window for CImageControlDlg, CLightSetupDlg, and CLabJackDlg.
CImageControlDlg is a GUI panel that allows the user to change the hardware gain and shutter
speed settings for the camera. The CLightSetupDlg allows the user to configure the LED panel
lights and CLabJackDlg allows the user to setup the LabJack hardware settings.
5.4.2.21 CCameraView
The CCameraView is inherited from CView and is the parent of C1394Camera and
C1394CameraDlg. CCameraView implements the CameraThread as well as all the functions
necessary for the control of the C1394Camera class.
5.4.2.22 CameraThread
The CameraThread is a worker thread created by CCameraView. Its purpose is to continually
capture the current image from the CCD camera buffer and write it into the memory buffer. It is
the job of the CCameraView to continually access the memory buffer and display the image as
needed.
5.4.2.23 C1394Camera
The C1394Camera is a class that encapsulates a selected 1394 Firewire CCD device to be used
by the program. This class is made available by the C1394Camera driver as a header only. The
source code resides inside the driver "dll" file.
5.4.2.24 C1394CameraDlg
The C1394CameraDlg is a GUI dialog used to change the settings for various features for the
CCD camera. This includes parameters like brightness, contrast, gain and shutter speed. This
functionality is provided by the C1394Camera driver.
5.4.2.25 CImageControlDlg
The CImageControlDlg is a GUI dialog created by the CCameraFrame class to evaluate the
fluorescence illumination settings.
It allows the user to try out various gain, shutter, and
97
accumulates and see the results immediately. The accumulated images are summed and the
resulting image is displayed in the Mosaic Editor Window.
5.4.2.26 CLightSetupDlg
The CLightSetupDlg is a dialog GUI that is used to setup and configure the light sources that are
availible for illumination. This includes the DIC and LED channels. Information such as
wavelength, color, and a short name can be saved in the registry for each of the channels. It also
has buttons to turn the channels on or off for testing.
5.4.2.27 CLabJackDlg
The CLabJackDlg is a dialog GUI that is used to configure any devices that are attached to the
Labjack controller. Like the CLightSetupDlg, it has buttons to allow the user to turn on or off the
channels for testing.
5.4.2.28 CImageFrame
CBAMBIApp creates the CImageFrame, which inherits from CMainFrame, to display and edit
images, mosaics, or time courses. BAMBI supports more than one CImageFrame at a time in
case the user wants to have several files open.
5.4.2.29 CImageView
The CImageView is an implementation of the CView class and is used to display an image inside
the CImageFrame. Each CImageFrame has one CImageView object.
5.4.2.30 CBrightConDlg
The CBrightConDlg is a GUI dialog used to adjust the brightness and contrast settings for the
current CImageView.
5.4.2.31 CSelRectDlg
The CSelRectDlg is a small GUI dialog used to help the user select a rectangular area on the
current CImageView image. This is used for extracting parts of a time course into a separate file
as a movie or an image.
98
5.4.2.32 CSaveSelAsMovieDlg
This GUI dialog is used to save a rectangular selection of a mosaic block opened in the Mosaic
Editor as a movie.
5.4.2.33 CFImage
A CFImage is a CObject class that contains all the information to extract an image from a raw
file. The CFImage class contains a pointer to a location in a "raw" file, the number of bytes to
read, and the coordinate placement of that image within a mosaic block. When Mosaic Editor
opens a "raw" image file of a mosaic block, it creates a CFimage object for each image in the file
and places them in a linked list. Mosaic Editor is then able to quickly access any image needed
by using the CFImage class to grab the data as needed.
99
100
Chapter 6
Applications of BAMBI
Much of the work presented in the present chapter is the result of the combined effort of several
students whose work spans the last four to five years. My involvement started in the summer of
2003 while working as a co-op student working in the Lab for Single Cell Bioengineering at the
University of Waterloo. At that time, I was given the task of writing software to interface a 3axis stage to a microscope and visualize data captured via an attached digital camera. I managed
to finish this task in the four months allotted. Upon graduating, I decided to return to the lab to
build upon my prior work as fulfillment towards my Masters of Applied Science degree.
The result of this work has lead to the development of a completely new automated microscopy
system entitled Bio-Assembly, Mosaic Building, and Informatics (BAMBI). The process of its
development and iterative testing was tied directly to the requirements of the studies that were
being run by other students in the lab at the time. I was directly involved in many of the
experiments providing direct support for the electronics and even performed some of the cell
culture protocols for the 5-day CFU Hill colony assay. These studies have shaped the
requirements and final outcome of BAMBI.
6.1 Monolayer Cell Cultures
Previous work introduced a novel cell culture chamber, herein referred to as the "gap chamber",
which could be used to image cell aggregates as a true monolayer (Ramunas et al. 2007). The
design effectively restricted the growth of cell aggregates to a single layer rather than a
multilayer thus avoiding light from other cells on top and below obscuring the focused image.
This successfully facilitated the imaging and lineage analysis of individual cells within an
aggregate while allowing high resolution "confocal like" DIC contrasting. Originally developed
to view murine neural stem cell neurospheres (Ramunas et al. 2007), it has also been used to
image primary rabbit blood cells (unpublished work), murine embryo bodies (unpublished work),
murine hematopoietic stem cells (Dykstra et al. 2006), and human islets of Langerhans (Moogk
et al. 2007). The use of the gap chamber allowed many of the 2-D time course experiments that
have been captured by BAMBI to be conducted. Its introduction also served as the starting point
for BAMBI research and development.
101
The success of the first murine neural stem cell assay showed that long-term live cell imaging
could be achieved and the results revealed relationships between the lineage, phenotype and
microenvironment. However, since neurodisks formed only from a neural stem cell progenitor, it
was a rare event. This restricted the imaging to be done at a low resolution of 5x until a cell
colony was observed to form. Only then could one of these colonies was selected to be imaged at
the higher resolution of 40x. This made high-resolution movies of the initial stage of neurodisk
formation difficult to impossible to capture. In order to capture these early events we needed to
implement an automated stage to capture as much of the area of the gap chamber as possible at
high-resolution. This motivated the design of BAMBI and its requirement to construct 2-D time
course images for future cell culture work.
6.2 Hematopoietic Stem Cell Assay
Time lapse video imaging offers unique opportunities to determine how specific physical
properties of individual living cells change with respect to each other over time and under
different conditions. Here we wanted to know if time-lapse video imaging could be used to
identify previously unidentified behavioral traits of hematopoietic stem cells (HSCs) with
functionally validated long-term multilineage repopulating activity in-vivo. In other words, could
long-term image tracking be used to identify behavioral traits that could be used in the future to
uniquely identify HSCs. The complete details of this work can be found in the original published
work (Dykstra et al. 2006).
6.2.1 Method
To search for new indicators of self-renewing hematopoietic stem cells, highly purified
populations were isolated from adult mouse marrow, micromanipulated into a specially designed
microscopic array, and cultured for 4 days. During this period, each cell and its progeny were
imaged at 3-min intervals. Individual clones were then harvested and assayed for HSCs in mice
by using a 4-month multilineage repopulation endpoint.
Cells were cultured in custom fabricated microwell chambers. These microwell arrays were
constructed by applying silicone gel to a glass coverslip to form a film approximately 20 µm
thick. Before the gel was allowed to set, the slide was attached to the microscope stage and a 100
µm wide glass scraper tool was attached to the BAMBI 3-axis micromanipulator. BAMBI was
then used to machine sets of perpendicular rows to form the array of microwells (see Figure 36.A
102
and B). A short glass tube was then affixed around the array to form a reservoir to contain the
culture medium.
To deposit the cells within the array, the entire reservoir was filled with 1 ml of medium
containing approximately 50 cells that were then allowed to settle. After settling, each of the 40
microwells was then loaded with a single cell by repositioning the cells using a glass
micropipette held stationary with the tip end at the focal plane of the microscope. The cell
chamber itself was translated in x, y by the BAMBI 3-axis stage for cell pick-and-place
operations. The micropipettes were made from capillary tubes (3-000-203-G/X; Drummond) by
using a vertical pipette puller (Model 720; Kopf) and cut with a single-crystal diamond tipped
glass etcher to give an opening 15–30 µm wide. Images were obtained on a Zeiss Axiovert 200
microscope equipped with phase-contrast optics and a Sony XCD-SX900 digital camera. Cells
were exposed to light only during imaging. A single stationary field-of-view was captured over
time at 3 minute intervals for approximately 4 days. Each cell in each image of the 1850-image
time course was scored for morphological characteristics, location, and parentage by using
human-assisted custom cell-tracking software that generated pedigree diagrams with other data
superimposed on them for visualization. Data from these diagrams were then imported into
standard analysis programs (EXCEL, MATLAB, and PRISM) to test correlations between
candidate biomarkers and HSC activity.
6.2.2 Results
The results of the experiment showed that there were indeed characteristics of the HSCs that
could be used to predict an HCS with an efficiency of 63%, an increase in previous
discrimination methods of 2 to 3 fold. The discrimination attributes were reduced cell cycle times
and lack of uropodia during the 12 hours immediately preceding injection of the cells into the
recipient mice. Figure 36 presents a summary of the results.
103
Figure 36: Microfabricated array and representative culture results
(A) A digital image of an array showing 40 silicone microwells, each capable of holding up to approximately
150 cells that can be tracked simultaneously. (B) Higher-power view of a representative well containing one
cell suspended in medium. (C) Close-up of the well shown in B after 4 days. (D) The pedigree diagram of the
clone that developed in the well shown in C, illustrating the precision with which sequential cell divisions could
be timed. (E) Cell-cycle time histogram of 67 individually cultured cells. A delayed initial cell cycle was
observed, followed by synchronously maintained subsequent divisions. Cells that did not complete the
corresponding cell cycle were excluded from this histogram. (F) Comparison of the cell-cycle times of
individual progeny pairs, demonstrating the pronounced synchrony retained between such ‘‘sister’’ cells,
despite the wide range of cycle times observed. Cells whose sisters did not complete the corresponding cell
cycle were not included in the plot. (G) Example of part of a clone in which many cells have large trailing
projections (uropodia). Arrows indicate cells with uropodia. (H) Example of part of a clone in which very few
cells have uropodia.
6.2.3 Discussion
The use of BAMBI was a critical factor in the micro fabrication of the multiwell arrays.
However, the first arrays were made by manual command instructions to control the end effector
movement that soon became tedious to perform. This laid the groundwork for an automated array
104
creation add-on module that would simply create the complete array given a relatively few set of
inputs.
Although BAMBI lacked a separate axis for the micropipette movement the x-y stage movement
enabled researchers to pick and place the cells in to and out of the microwells with great
precision. The need for another axis to control vertical pipette motion was clear as it was quite
difficult to do this by hand and wasted a lot of precious time. The latest design of BAMBI has
incorporated a 4th axis to automate this motion and cell seeding and sorting times have been
drastically reduced. Additional micropipette designs such as the miniaturization of the pipette
inner diameter and use of a digital pressure transducer to provide feedback on the fluid pressure
and direction inside the micropipette has also improved performance.
Use of the micropipette for the cell repositioning while viewing through the eyepiece indicated
that it would be preferable to have the keyboard controller inside the flow hood for right-handed
operation. The current version of BAMBI has a radio-controlled numeric keypad inside the hood
that can be used to control movement.
The level of detail obtained in the 5x magnification time course provided enough information to
track and identify uropodia, but much of the inner cell was not resolvable. At this time BAMBI
could not yet capture multiple fields-of-view and only a stationary time course could be
conducted. This magnification limited the pixel count from 5 to 6 pixels per cell which is far less
that what is needed to observe inner cell contents. The pictures shown in Figure 36.G and H are
representative of cells that were captured with a higher power objective. This shows the level of
detail that could be attained if automatic panning had been available.
This early work was confounded by the limitations of the hardware. The 4-axis controller card,
C-812 (Physik Instrumente, Germany), was obsolete in that it was originally developed to work
on Windows 3.14. To allow it to function on Windows XP a custom memory access driver was
developed.
However, an intermittent problem with the communication buffer would cause
unintended insertions and deletions in the command buffer that could have unpredictable effects
on stage movements. This made long term live cell imaging frustrating as the micropipette tip
was inadvertently shattered multiple times and 2-D time courses were unreliably captured. The
final solution was to replace the hardware with a completely new state of the art system.
105
6.3 CFU-Hill Formation Assay
The process of vasculogenesis (blood vessel development following the differentiation of
endothelial progenitor cells (EPC) or angioblasts) is believed to persist into adulthood. This has
generated interest in the use of the putative EPC for neovascularization of ischemic or injured
tissue and for the clinical assessment of risk factors for various diseases. Although this cell has
not been characterized as yet, a number of groups have reported the ability to culture a unique
colony type containing a central core of round cells with radiating spindle shaped cells at the
periphery. We have termed these unique colonies Colony Forming Unit-Hill or CFU-Hill, and
their assay the 5-Day CFU-Hill assay. Quantification of colonies correlated with various clinical
disorders with reduced colony number associated with cardiovascular risk and function, chronic
obstructive pulmonary disease and rheumatoid arthritis. In an attempt to understand the origin
and behaviors of the cell population(s) responsible for colony formation, we used long-term live
cell imaging to characterize and track the development of individual colonies over the culture
period.
6.3.1 Method
Whole blood was collected from 30 normal donors (age range 24-55 years), peripheral blood
mononuclear cells (PBMC) were isolated and the 5-Day CFU-Hill assay was performed. The
CFU-Hill assay is performed using EndoCult® media (StemCell Technologies Inc.) and human
fibronectin coated multi-well plates. On day 2 of the assay, non-adherent cells were collected
plated on three fibronectin coated glass coverslips in 24 well dishes. The dishes were imaged for
the remaining 3 days on three 200 Axiovert (Zeiss, Germany) microscopes.
One of the
microscopes was fitted with a BAMBI 3-axis stage controller and was used to image a single
well of a 24 well plate. A 10 x 10 field-of-view time course was collected every 7 minutes.
6.3.2 Results
Long-term live cell imaging showed that plated cells immediately began to display very different
morphologies. The four distinct morphologies were classified as small round cells (SRC), small
podiated cells (SPC), large round cells (LRC), and spindle like cells (SLC) shown in Figure 37.
106
Figure 37: Four sub-populations of morphologically distinct cells contribute to CFU-Hill
formation
A. Small round cells. B. Podiated cells. Irregular shaped cells with protruding podia. C. Large round cells,
cobblestone appearance with tiny protruding cilia. D. Spindle like cells.
A novel discovery of an event that took place on day 4 of the CFU-Hill assay was made possible
only though time course imaging (see Figure 38). This sequence demonstrates the plasticity of
the LRC phenotype as they can transform into a SLC and back again in as little as 7 hours.
Without time course imaging these would be scored as separate cell types when in fact they are
the same cell with different morphologies.
Figure 38: Plasticity of large round cell phenotype
A. Large round cell at t=0 hr. B. Same cell has transformed into spindle like phenotype at t=4 hr. C. The same
cell is in the process of returning to the large round phenotype at t=6 hr. D. The same cell has returned to the
large round phenotype and has begun to move away from the region at t=7 hr.
Results of large field imaging showed that the most important cell in CFU-Hill formation was the
LRC phenotype. Not only was it identified as the source of all the spindle-like cells, it was also
shown to be primarily responsible for the CFU-Hill formation itself. This result could only be
shown clearly by tilting the microscope stage by 5º. Preliminary results had confirmed that this
approach yielded a similar number of CFU-Hill without the high numbers of SRC. The tilt
ensured that senescent or non-adherent cells and debris would gradually leave the region of
interest allowing for a much clearer picture of CFU-Hill formation. In Figure 38.C, a picture of a
107
CFU-Hill produced by this method shows that the most dominant cell type present is the LRC
and SLC. A second CFU-Hill can be seen in the lower right section of inset B. This CFU-Hill
formed near a piece of debris that appeared to nucleate colony formation.
Figure 39: Multi-scale large field mosaic of the CFU Hill assay on day 5
A. Original 10x10 microscope image mosaic B. Zoom of 6x6 section at 150% C. Zoom of single image frame
at 500% showing a typical CFU-Hill.
Additionally, it was shown that CFU-Hill formation was a rare event. This is evident in Figure
39, wherein only 2 hill colonies formed within a region of approximately 5 millimeters square.
Morphologically distinct cell populations can also mobilize to resemble CFU-Hill formations
with varying levels of similarity throughout the five day experiment (see Figure 40).
108
Figure 40: Stages of CFU-Hill Formation
A. Proto-Clusters. B. Proto-Clusters with Spindles. C. Clusters. D. Clusters with Spindles.
The Proto-Clusters in Figure 40.A are characterized as aggregates of three or more cells that are
transient, but maintain a cohesion and similar travel path for at least 20 minutes. They may be
composed of one or more cell phenotypes, large round cells (LRC), spindle like cells (SPC), and
small podiated cells (SPC). Figure 40.B shows Proto-Clusters with Spindles characterized by
having at least one SLC and two or more cells of any other phenotype. They are transient in
nature as the round cells can leave almost as fast as they arrive. These SLC clusters typically
start to form after day 4. A cluster is shown in Figure 40.C. Clusters are aggregates of fifteen or
more cells that last more than several hours. They may be composed of one or more cell
phenotypes LRC, SPC, and SLC. The final stage of CFU-Hill formation is characterized as
clusters of which some of the cells have started to undergo spindle transformation (see Figure
40.D). Once spindle formation has started it will continue until many more of the large round cell
members have transformed into the spindle like phenotype at which point the central mass of the
cluster will almost disappear.
109
6.3.3 Discussion
CFU-Hill colonies are the result of the aggregation of cells and are not clonal as originally
believed. Endothelial precursor cells in the CFU-Hill colony assay are composed of a
heterogeneous sub-population that require further classification. The source of the spindle like
cell phenotype is the result of the large round cell phenotype changing morphologically into the
spindle like cells.
Large field-of-view long-term live cell imaging can provide new information and answer
questions about low frequency events at single cell resolution. CFU-Hill colony formation
requires multiple coordinated cellular behaviors including morphological changes and cell
migration, likely in response to a chemokine gradient. Characterization of the cell types and
regulatory molecules that support the formation of CFU-Hill colonies may increase our
understanding of clinical disease. The probability of forming a CFU-Hill colony is quite low
(.025 per image) compared with the number of proto-clusters and proto-clusters with spindles (~4
per image). Cluster formation has a probability at a peak value of about 0.5 per image, 40 X
greater than the count of CFU-Hill formed.
We have demonstrated that using large-field long-term live cell imaging dynamic events and cell
activities can be recorded and classified even for low frequency events such as CFU-Hill
formation. Future work will focus on using these observations to identify and classify progenitors
with a potential to go on to form a CFU-Hill. If this work is successful, we will recover cells for
further molecular characterization. This project is an example of the application of behavior
activated cell selection (BACS) and lineage/cell culture informatics.
6.4 Imaging Human Islets of Langerhans
Type I and II diabetes are associated with the autoimmune destruction of insulin producing beta
cells or impaired beta cell function. Islets are composed of tens of hundreds of cells consisting of
an outer shell of alpha cells shrouding an inner mass of beta cells. Recent evidence has shown
that there is a possibility for insulin therapy through islet transplantation. As donor islets are of
limited availability, there is a need to be able to expand islet cell mass in-vitro. Long-term live
cell imaging has the potential to identify the specific cells and processes involved in islet
transformation. Using a novel imaging chamber, it was shown that it is possible to construct a
high-resolution three-dimensional time course of a human islet while maintaining the structure of
the islet cells and the intercellular matrix (Moogk et al. 2007).
110
6.4.1 Method
Imaging chambers were constructed with a gap chamber to ensure the cells would not grow more
than 4 cells in height. A 2 x 8 millimeter glass slide was glued at the short ends to a coverslip
with silicon adhesive glue. A short 12 mm inside diameter glass tube was glued to the coverslip
to form a watertight well around the gap. Human islets were isolated from cadaveric donor
organs at the Montreal General Hospital.
To load the islets under the imaging chamber the top surface was lifted from the bottom cover
slip using tweezers and 5-10 μL of the suspension was pipetted onto the coverslip at the opening
of the imaging chamber, which was then drawn into the gap space by capillary action. The top
surface was gently lowered to minimize ejection of the loaded islets and microspheres.
Islets were imaged on an inverted microscope (Axiovert 200, Zeiss Germany) with a stationary
stage and a single z-axis focus control motor. Chambers were maintained at 37oC in a 5% CO2
humidified air atmosphere. To minimize phototoxicity, an electromechanical shutter was used to
ensure incident light from the microscopes only reached samples while images were being
acquired. Images were captured at a 3 minute interval using a digital camera (XCD-SX910, Sony
Japan). The islets were manually focused on an optical section deemed to be near the center of
the islet. The focus was locked, but readjusted from time to time to account for slight focal plane
drift.
6.4.2 Results
The imaging chamber successfully restricted the z-axis thickness of the culture and kept the islets
within the focal range for high-resolution DIC imaging. The gap within the chamber allowed the
islets to exist in an in-vivo state while limiting the islet thickness to 2-4 cells in height. This
facilitated the successful z-axis optical sectioning as shown in Figure 41 and subsequent tracking
of each cell history within the islet.
111
Figure 41: Eight optical sections of a human islet of Langerhans
Z-axis optical sections of a human islet in a 25 mm gap chamber using DIC illumination. The optical sections
are 5 μm apart and include an extra section above and below the islet to ensure the entire islet was imaged. The
scale bar equals 25 μm.
At the end point of the experiment, 5 days, the islets were fixed and stained with fluorescent
markers for the islet hormones insulin, glucagon, and somatostatin. The Islets cells identified
with fluorescent imaging could be related to the final time point of the DIC time course which
allowed for movies to be observed with the knowledge of cell phenotype.
6.4.3 Discussion
This study showed that 3-D time course imaging was useful in the analysis and characterization
of cellular activities in cellular aggregates for transplant. As Islets are a gift from human donors
and only some (less than 10) from one donor are amenable for imaging, care must be taken to
insure that as many of these events as possible are captured. This means that BAMBI must be
able to simultaneously capture several different islet locations for long-term live cell imaging. At
the time of this study there was only one field-of-view available with only motion of travel (zaxis) automated. The current BAMBI design allows for multiple locations or blocks to be imaged
simultaneously via the automated 3-axis stage.
Focal drift and the gradual settling of the islets within the collagen matrix required that multiple
adjustments were necessary to keep the islet centered within the z-stack. To account for this,
extra optical sections were taken above and below the islet. However, focus was still manually
adjusted to keep the islet centered within the stack to avoid the task of having to apply a drift
correction to the data at the end of the experiment.
112
In the fluorescent modality rat kidney cells have been successfully tracked in 3-D by finding the
center of mass of the fluorescence intensity each time the image stack was collected (Rabut et al.
2004). Here, the figure-of-merit to maximize is light intensity, which can be collected directly
from the raw image data. In the human islet experiment, DIC illumination also provides light
intensity values but they are not well correlated with the center of mass of an aggregate. To
accurately use DIC illumination for an autofocus algorithm requires more work. The latest
version of BAMBI provides a measure of focus by determining a figure-of-merit based on
normalized variance between each slice. By constantly maximizing this figure-of-merit and
repositioning the cell within the center of the focal stack it should be possible to maintain focus
for long term studies without the need for user intervention.
At the time of this experiment only one field-of-view could be optically sectioned for a single
time course. Although the islet selected for long-term imaging was small enough to fit into a
single field-of-view, there were other islets observed under the gap that would have required up
to four fields of view at the current magnification. This can now be achieved with the latest
version of BAMBI using mosaic blocks.
113
114
Chapter 7
Discussion
The realization of the BAMBI system was only possible by adopting a transdisciplinary
approach.
BAMBI was designed using mechatronic engineering principles to work on a
chemical engineering problem that fell within the context of cell biology and photonics. The
problem was: "Can we identify stem cells in culture and expand them in-vitro?" This required a
fully integrated imaging system with life support for long-term live cell assays that could be
manipulated on a single cell level.
The original functional design goals for BAMBI started out as this simple need to image more
than one field-of-view over time under various conditions. Starting in 2005, new live cell
experiments required additional features to be implemented and, in turn, these features enabled
experimenters to ask more questions and to push the limits of BAMBI. This again required
additional enhancements to be added until the final system was developed. The end result was a
system that could capture multiple fields-of-view, capture contiguous images in a ROI that may
represent a 2-D or 3-D region of space in time. The addition of dynamic mosaic blocks allowed
the ROIs to be created or destroyed, to grow or shrink as needed to capture the live cell dynamics
of the experiment. 3-D mosaic blocks can also be used to optically section cells or aggregates of
cells when used with DIC illumination.
Five additional fluorescent LED wavelengths are
available for fluorophore imaging. BAMBI provides a micropipette manipulator to pick-andplace single cells within the microenvironment that enables researchers to set up conditions found
in-vivo and experiment on a single cell level ex-vivo. All these features are made available and
managed within a single multithreaded software application.
The task of implementing the mosaic capture algorithms and autofocus were the two of most
challenging tasks faced. The most difficult task to implement on BAMBI was the mosaic capture
algorithm itself. This was mainly due to the fact that a concurrent algorithm had to work with
multiple threads, including user interface threads which are much harder to manage.
Multithreading was a necessary addition to the program. It allows the mosaic capture algorithm
to wait on feedback from the robot or video capture device before continuing. This is essential in
maintaining safe concurrent operations that depend on actions being completed at the right time.
It also allows the user to interact with GUIs in a "real-time" way that is, being able to interrupt a
process while it is currently running. The problem of having a robust algorithm was confounded
115
by the fact that there could be more than one mosaic block and each mosaic block has up to six
possible illumination modes all to be captured at different intervals.
The second most difficult challenge to implement was robust autofocus. Even an autofocus
function that works 99% of the time is not robust when one considers the effect that 1% could
have on the time course. Focus functions must operate very quickly when the assay demands fast
cycle times. It is simply not feasible to collect images through the entire depth of field; only a
limited number of images can be gathered above and below the last focal plane to determine the
correction for the new image given the time constraints of cell tracking over multiple ROIs.
Indeed, if the 1% focus result were to place the incorrect "in-focus" image at the edge of the
correct focus range, the next focus check may not find the true peak of the focus curve. Other
factors such as the high amount of noise present in images due to low illumination conditions
used to maintain the health of the cells, multimodal focus curves, and the dynamic nature of the
experiment where the background substrate is not constant from one experiment to another, all
factor into how well an autofocus function performs. For now, one must be vicarious when
employing the autofocus features of BAMBI, but for the future there is promise that a robust
autofocus solution is still attainable with artificial intelligence, fuzzy systems, or Bayesian
approaches.
The success of BAMBI can be measured by its robustness, the use of dynamic mosaic blocks,
and the ease at which endpoint software can integrate with the system. One of the most important
design criteria was that BAMBI maintain stable operation over hundreds of hours - the system
must be robust, as an interruption in time course imaging at any point will result in an experiment
failure. If a system were to crash during a time course it can be costly both financially and
ethically. Financially, the cost of reagents used and number of man-hours spent preparing for the
run are not recoverable after an experiment fails. Ethically, the type of cells used in the
experiment could come from human or animal donors. In the case of animal donors, they are
usually sacrificed just before the experiment to harvest the cells of interest. When a study like
this fails, it often brings into question the cost versus benefit of live animal studies.
The process of “validating” BAMBI against failure required a considerable amount of debugging
and practice test runs, often using polyurethane beads or mouse cell lines. In the end, the process
of testing, performing practice runs, and getting feedback from actual experiments lead to the
creation of a stable software and hardware platform that met the (evolved) design criteria. Since
the last iteration of BAMBI released in December 2006, the system has been running
116
experiments simultaneously on three microscopes, almost continually without failure. The
successful implementation of dynamic mosaic blocks truly sets BAMBI apart from other
automated microscopy systems to date. The ability to pause an experiment once it has started
and dynamically add more regions of coverage, grow or shrink existing regions is just not
available in the systems surveyed to date. However, most automated microscopy software
providers are aware of this deficit and it is only a matter of time before they implement their own
dynamic solution. Finally, BAMBI has been successfully mated with a number of off-line
endpoint programs such as Microscoft Excel, Microsoft Access, NIH ImageJ, CellTracker™, and
CellHunter™. The purpose of these programs is to perform post-capture image processing,
pattern recognitions, and informatics on the data gathered by BAMBI.
Although BAMBI has achieved its original primary objectives it should still be considered a
work in progress. The number of cell based assays and imaging techniques are always growing.
This is partly due to the fertile nature of the field of cell biology and is partly due to the ongoing
advances in computer technology.
As these fields advance, so will the applications for a
BAMBI-approach to cell culture analysis and manipulation. The most relevant advancements that
could be considered for the next version BAMBI would be: robust autofocus, online image
processing, and autonomous single-cell handling. Robust autofocus would allow the
experimenter to walk away from long-term live cell time courses with confidence that the images
will be kept in focus. As yet, autofocus is roughly 80% reliable but can be improved by focusing
on only a small portion of the image containing a single focal curve. Online image processing
might include the ability to track cells in "real-time", either under DIC or fluorescent
illumination, for the purposes of automatically growing, moving, and shrinking mosaic blocks as
needed. Online image processing would occur at the same time as the experiment to allow closed
loop feedback of the system.
Autonomous single-cell handling could work with online
processing to allow BAMBI to automatically pick-and-place cells. Currently, BAMBI can be
controlled robotically for this purpose, but the task is usually very tedious as experiments can
require manual placement of several hundred cells.
BAMBI is a new facet in the field of automated high content and high throughput live cell
imaging. It is unique in that it can provide a wide range of features compared with other
available commercial systems. It can operate at speeds that can attain more than 50,000 fields-ofview a day which places it in the high throughput category according to Gough and Johnston
(e.g. Molecular Devices, ImageXpress ULTRA, and Evotecs Opera). Most importantly, it is a
seamless add-on to a conventional microscope and allows it to be used for work at the research
117
level. That is, if a microscope itself employs a unique illumination technology such as multiphoton excitation, BAMBI would be able to take advantage of that. At the time of this writing
there are no other systems that feature single-cell pick-and-place operation with automated
microscopy. Usually, commercially available systems leave the robotic manipulation of cells to
entirely different systems. A comprehensive group of features like BAMBI would require
commercial systems to either develop their own technology for cell manipulation in-house or
support the plethora of currently available systems. Providing support for an entirely different
product is very costly and requires a significant amount of redundant coding. Currently BAMBI
is proprietary software and is not yet available to the general public. Therefore the degree of
customization BAMBI offers the end user is a matter of perspective.
Within the Jervis
Laboratory it allows for the limitless customization of BAMBI provided the user understands
Windows Visual C++ and MFC. Without access to the source code, it would not be possible to
add additional functionality. There are solutions to this problem, such as implementing a script
language that would enable the user to add functionality that was not already there. The most
obvious choice would be to allow for script based image processing algorithms to be added as
needed. Generally, the BAMBI software is very flexible in this regard and lends itself easily to
new code modules and modification of existing ones.
Accumulating more images increases the number of events scored and thereby imparts more
statistical significance to the assay. As systems like BAMBI approach the theoretical limits of
the current technology for image collection rates, a new bottleneck is reached where the pace of
data collection far exceeds the pace of data extraction and mining. Although data mining is
usually an off-line process and thereby not under time constraints, feasibility limits can be
imposed by the nature of the data being extracted.
At least in the bright field modality,
identification of cells, cell types, various morphologies, and tracking of cell lineages still requires
a human to sit down and actually do it. Computer algorithms are still in the developmental stages
when it comes to tracking cells robustly without fluorescent markers for guidance. BAMBI has
changed the problem from "Can we gather sufficient data with available imaging infrastructure?"
to "Do we have sufficient human resources to process data offline?" Therefore, care should be
taken to acquire the least amount of data necessary to achieve the goals of the experiment.
Through the course of many live cell experiments with BAMBI it was found that the upper limit
to the viable amount of data captured depended on maintaining an imaging cycle time of no less
than three minutes to enable cell tracking. If the time course is less than three minutes, the cells
become overexposed to light and there are no appreciable gains in temporal information.
118
However, if the time course takes longer than three minutes, there may be no guarantee that the
cells can be individually tracked between time points.
119
120
Chapter 8
Conclusions and Recommendations
8.1 Conclusions
Although challenging to implement, multithreaded design was essential for managing concurrent
operations required to efficiently automate large field high throughput long-term image captures.
In the automated system there is variability in the time it takes for some events to occur such as
opening a shutter, collecting an image, performing a backlash correction, or writing to a file.
Multithreading frees BAMBI from having to wait on each event to finish before starting the next
one. Provided the events are handled in a thread safe manner, the efficiency of image capture has
been enhanced to sub-second intervals between adjacent fields-of-view in some cases.
Using backlash correction with the ultra high-resolution servomotors (Galil Inc., USA) proved to
be very precise over long periods of time and wide ranges of motion. The repeated collection of
images gathered from multiple fields-of-view through time showed very little drift after the
system reached temperature equilibrium. Additionally, the accuracy of the servomotors enables
the display of image mosaics to be stitched together without the need to perform lengthy
corrections; corrections for position overlap discrepancies can require minutes to hours to process
depending on the size of the mosaic.
The implementation of dynamic mosaic blocks allows researchers to modify the scope of a
currently running live cell experiment without having to restart the time course. Dynamic mosaic
blocks can be grown or shrunk, and created or destroyed, in order to capture the regions of
interest as cell colonies grow and move. This is beneficial to researcher; as they are not locked
into a single image capture protocol.
BAMBI has proven itself to be a robust software application that is not prone to crashes that
would otherwise compromise the outcome of live cell experiments. Since the last iteration
compiled on December 2006, BAMBI has been running experiments on three different
microscopes on a daily basis without failure. This success is the result of using an iterative design
methodology wherein the development, test, feedback, development cycle was performed on a
near continuous basis while actual experiments were in progress.
121
The ability to work at a single cell level on a cell-by-cell basis paired with long-term live cell
imaging allows researchers to answer a completely new set of questions related to cell behavior.
Cells are not insensitive to their surroundings; scientists are discovering that a change in a cell's
neighboring environment has a significant impact on its behavior or phenotype. BAMBI enables
researchers to create these environments in-vitro to learn about these effects.
8.2 Recommendations
8.2.1 Enhanced Sony Drivers
When the original BAMBI software was written, drivers for the Sony XCD-XS710/910 CCD
cameras did not exist and an open source generic 1394 Firewire version had to be used. This is
the 1394Camera v.63 driver provided by Carnegie Mellon University. Unfortunately, this driver
does not support camera binning for the Sony cameras used on M1, M2, and M3. Recently, Sony
has released a version of their driver that supports camera binning. It is recommended that these
new drivers be incorporated into the BAMBI software program to take advantage of camera
binning.
Binning will greatly increase the cameras sensitivity to the very faint emissions
experienced under fluorescent illumination conditions.
8.2.2 Data Compression
Given that experiments have been running almost continually on microscopes M1, M2, and M3
for the past seven months, there will come a point where the data storage capacity of the hard
drives will be exceeded. Rather than purchase more storage, data compression techniques could
be used to compress the raw image files. A lossless image compression algorithm such as LZW
(Gonzales et al., 2002) has an average compression ratio of 1:5 that could be employed to shrink
the finalized raw files.
8.2.3 Autofocus
Although autofocus has been implemented on BAMBI, it has not yet stable enough state to be
used for long-term live cell operations.
It is recommended that research continue on this
application with the following suggestions. Other studies have shown success focusing on a
fluorescent marker (Burglin, 2000).
It may be possible to place a fluorescently coated
polyurethane bead in the cell culture media as a reference.
By performing fluorescently
illuminated autofocus on the bead it may be easier and more robust allowing for a general
122
correction for focal drift. Another possibility is to perform a cross correlation between the
previous in-focus image and the stack of images acquired to generate the current focal score. The
correlation coefficients could be used to weight the focal scores generated from each image.
8.2.4 Autonomous Cell Sorting
The first step in developing a fully automated cell pick-and-place capability for BAMBI was to
develop the robotics necessary for manual control. With the exception of pressure control
BAMBI has successfully been used to move hundreds of living cells from one location to another
in the microenvironment. The downside is that the process has been slow and tedious for the
user to perform. The process of transferring cells between different environments such as from
one dish to another is very stressful on the cells and they can only be exposed to these conditions
for a short time before cell death occurs. Automation of this process or part of this process would
relive stress on the cells and the experimenter.
It is recommended that the next step to
automating this process is to close the control loop with computer vision.
Using pattern
recognition techniques, it should be possible to provide feedback as to where the end effector is
located with respect to the environment and the cells.
8.2.5 Fog-Light Warning System
BAMBI has been designed with built in safety features like the amplifier enable signal that must
be logic high to provide power to the motors or the shut down states that occur when a limit
switch is tripped. These precautions are fairly effective for most application but in the case of
long-term live cell imaging, they can also cause the unwanted loss of data from a current
unattended run. (i.e. If a motor is turned off because it encountered an unexpected resistance to
motion it remain off until the experimenter arrives the following morning and resolves the issue
and re-enables the motor.) To avoid these situations it is recommended that a "fog-light" or
"watch dog" warning system be implemented that can notify the appropriate person or persons
that a fault has occurred. The system can provide notification by any number of communication
methods such as cell phone text messaging, email, or pager.
123
124
Appendix A
Mechanical
125
A.1. Micromanipulator
The BAMBI Micromanipulator with Micropipette Attached
126
A.2. 8-Axis Control Module Assembly
BAMBI 8-Axis Front Panel
127
BAMBI 8-Axis Module Layout: Rear View
BAMBI 8-Axis Module Layout: Top Level View
128
BAMBI 8-Axis Module Layout: Bottom Level View
129
Notes: All dimensions are in mm.
Material: 1/16" Aluminum
DWG Name: 8-Axis Module Top Shelf Cut/Fold Layout
Rev. A
File Name: Shelf Assembly Top Folding View.dwg
Drawing not to scale.
Date: 04/09/06
Sheet: 1/3
Designed by: April Blaylock
130
Notes: All dimensions are in mm.
Material: 1/16" Aluminum
DWG Name: 8-Axis Module Top Shelf Cut/Fold Layout (SideView)
Rev. A
File Name: Stage Modifications.dwg
Drawing not to scale.
Date: 04/09/06
Sheet: 2/3
Designed by: April Blaylock
131
Notes: All dimensions are in mm.
Material: 1/16" Aluminum
DWG Name: 8-Axis Module Top Shelf Layout (Top View)
Rev. A
File Name: Stage Modifications.dwg
Drawing not to scale.
Date: 04/09/06
Sheet: 3/3
Designed by: April Blaylock
132
Notes: All dimensions are in mm.
Material:1/16" Aluminum
DWG Name: : 8-Axis Module Bottom Shelf Layout (Top View)
Rev. A
File Name: Stage Modifications.dwg
Drawing not to scale.
Date: 04/09/06
Sheet: 1/1
Designed by: April Blaylock
133
A.3. Axiovert 200 Stage Modifications
Notes: All dimensions are in mm.
Material: Aluminum
DWG Name: Axiovert 200 Stage Modifications
Rev. A
File Name: Stage Modifications.dwg
Drawing not to scale.
Date: 04/09/06
Sheet: 1/1
Designed by: April Blaylock
134
A.4. Cell Culture Plate
Notes: All dimensions are in mm.
Material: Aluminum
DWG Name: Cell Culture Plate
Rev. A
File Name: Cell Culture Plate Revision A.dwg
Drawing not to scale.
Date: 04/09/06
Sheet: 1/1
Designed by: April Blaylock
135
Notes: All dimensions are in mm.
Material: Aluminum
DWG Name: Cell Culture Plate
Rev. B
File Name: Cell Culture Plate Rev B.dwg
Drawing not to scale.
Date: 04/09/06
Sheet: 1/1
Designed by: April Blaylock
136
Notes: All dimensions are in mm.
Material: Aluminum
DWG Name: Cell Culture Plate
Rev. C
File Name: Cell Culture Plate Rev C.dwg
Drawing not to scale.
Date: 04/09/06
Sheet: 1/1
Designed by: April Blaylock
137
A.5. 3-Axis Stage Mounting Plate
Notes: All dimensions are in mm.
Material: 1/2"Aluminum
DWG Name: 3-Axis Stage Mounting Plate
Rev. A
File Name: 3-Axis Stage Mounting Plate.dwg
Drawing not to scale.
Date: 04/09/06
Sheet: 1/1
Designed by: April Blaylock
138
A.6. 3-Axis Stage Assembly
Notes: All dimensions are in mm.
Material: 1/4" Aluminum
DWG Name: 3-Axis Stage Assembly
Rev. A
File Name: 3-Axis Stage Part 1 Rev A.dwg
Drawing not to scale.
Date: 04/09/06
Sheet: 1/3
Designed by: April Blaylock
139
Notes: All dimensions are in mm.
Material: 1/4" Aluminum
DWG Name: 3-Axis Stage Assembly
Rev. A
File Name: 3-Axis Stage Part 2 Rev A.dwg
Drawing not to scale.
Date: 04/09/06
Sheet: 2/3
Designed by: April Blaylock
140
Notes: All dimensions are in mm.
Material: 1/4" Aluminum
DWG Name: 3-Axis Stage Assembly
Rev. A
File Name: 3-Axis Stage Part 3 Rev A.dwg
Drawing not to scale.
Date: 04/09/06
Sheet: 3/3
Designed by: April Blaylock
141
A.7. DMC-2900 Interconnect Module
Drawing taken from "Application Note #1424" by Galil Motion Control Inc.
(www.galilmc.com).
142
Appendix B
Electrical
143
B.1. DMC-2900 Interconnect Module
DMC-2900 Interconnect Module Pin I/O Table
Block (4 PIN)
Label
I/O
Description
1
MOCMDZ
O
Z axis motor command to amp input (w / respect to ground)
1
SIGNZ
O
Z axis sign output for input to stepper motor amp
1
PWMZ
O
Z axis pulse output for input to stepper motor amp
1
GND
O
Signal Ground
2
MOCMDW
O
W axis motor command to amp input (w / respect to ground)
2
SIGNW
O
W axis sign output for input to stepper motor amp
2
PWMW
O
W axis pulse output for input to stepper motor amp
2
GND
O
Signal Ground
3
MOCMDX
O
X axis motor command to amp input (w / respect to ground)
3
SIGNX
O
X axis sign output for input to stepper motor amp
3
PWMX
O
X axis pulse output for input to stepper motor amp
3
GND
O
Signal Ground
4
MOCMDY
O
Y axis motor command to amp input (w / respect to ground)
4
SIGNY
O
Y axis sign output for input to stepper motor amp
4
PWMY
O
Y axis pulse output for input to stepper motor amp
4
GND
O
Signal Ground
5
OUT PWR
I
Isolated Power In for Opto-Isolation Option
5
ERROR
O
Error output
5
CMP
O
Circular Compare Output
5
OUT GND
O
Isolated Ground for Opto-Isolation Option
6
AMPENW
O
W axis amplifier enable
6
AMPENZ
O
Z axis amplifier enable
6
AMPENY
O
Y axis amplifier enable
6
AMPENX
O
X axis amplifier enable
7
OUT5
O
General Output 5
7
OUT6
O
General Output 6
7
OUT7
O
General Output 7
7
OUT8
O
General Output 8
8
OUT1
O
General Output 1
8
OUT2
O
General Output 2
8
OUT3
O
General Output 3
8
OUT4
O
General Output 4
9
+5V
O
+ 5 Volts
144
9
HOMEZ
I
Z axis home input
9
RLSZ
I
Z axis reverse limit switch input
9
FLSZ
I
Z axis forward limit switch input
10
LSCOM
I
Limit Switch Common Input , No Connection @
10
HOMEW
I
W axis home input
10
RLSW
I
W axis reverse limit switch input
10
FLSW
I
W axis forward limit switch input
11
HOMEX
I
X axis home input
11
RLSX
I
X axis reverse limit switch input
11
FLSX
I
X axis forward limit switch input
11
GND
O
Signal Ground
12
HOMEY
I
Y axis home input
12
RLSY
I
Y axis reverse limit switch input
12
FLSY
I
Y axis forward limit switch input
12
GND
O
Signal Ground
13
IN5
I
Input 5
13
IN6
I
Input 6
13
IN7
I
Input 7
13
IN8
I
Input 8
14
XLATCH
I
Input 1 (Used for X axis latch input)
14
YLATCH
I
Input 2 (Used for Y axis latch input)
14
ZLATCH
I
Input 3 (Used for Z axis latch input)
14
WLATCH
I
Input 4 (Used for W axis latch input)
15
+5V
O
+ 5 Volts
15
+12V
O
+12 Volts
15
-12V
O
-12 Volts
15
ANA GND
O
Isolated Analog Ground for Use with Analog Inputs
16
INCOM
I
Input Common For General Use Inputs @
16
ABORT
I
Abort Input
16
RESET
I
Reset Input
16
GND
O
Signal Ground
17
ANALOG5
I
Analog Input 5 , No Connection @
17
ANALOG6
I
Analog Input 6 , No Connection @
17
ANALOG7
I
Analog Input 7 , No Connection @
17
ANALOG8
I
Analog Input 8 , No Connection @
18
ANALOG1
I
Analog Input 1 , No Connection @
18
ANALOG2
I
Analog Input 2 , No Connection @
18
ANALOG3
I
Analog Input 3 , No Connection @
145
18
ANALOG4
I
Analog Input 4 , No Connection @
19
+5V
O
+ 5Volts
19
+INX
I
X Main encoder Index +
19
-INX
I
X Main encoder Index -
19
GND
O
Signal Ground
20
+MAX
I
X Main encoder A+
20
-MAX
I
X Main encoder A-
20
+MBX
I
X Main encoder B+
20
-MBX
I
X Main encoder B-
21
+5V
O
+ 5Volts
21
+INY
I
X Main encoder Index +
21
-INY
I
X Main encoder Index -
21
GND
O
Signal Ground
22
+MAY
I
X Main encoder A+
22
-MAY
I
X Main encoder A-
22
+MBY
I
X Main encoder B+
22
-MBY
I
X Main encoder B-
23
+5V
O
+ 5Volts
23
+INZ
I
X Main encoder Index +
23
-INZ
I
X Main encoder Index -
23
GND
O
Signal Ground
24
+MAZ
I
X Main encoder A+
24
-MAZ
I
X Main encoder A-
24
+MBZ
I
X Main encoder B+
24
-MBZ
I
X Main encoder B-
25
+5V
O
+ 5Volts
25
+INW
I
X Main encoder Index +
25
-INW
I
X Main encoder Index -
25
GND
O
Signal Ground
26
+MAW
I
X Main encoder A+
26
-MAW
I
X Main encoder A-
26
+MBW
I
X Main encoder B+
26
-MBW
I
X Main encoder BThis table is adapted from the DMC-18x2 User Manual (rev. 1.0f) by Galil Motion Control Inc. (2003).
@ Connection not available for the DMC-1842 Econo Series controller card.
146
B.2. BAMBI 4-Axis Electrical Assembly
4-Axis PWM Driver Board Rev. A
Notes: This circuit was implemented on a proto-board with the traces shown in gold. A hole was
drilled at the top and bottom traces to break the circuit path for high and low voltages.
147
Parts List for 4-Axis PWM Driver Assembly
Description
Dual H-Bridge
Universal Solder Board
20 pin Terminal Block
450W Power Supply /w Fan
SATA Power Cable (5.25)
Diff Green LEDs
Wire Solid, 22 gauge, 7 color, 5ft
2.75x3.75 Universal Solder Board
Capacitor mono 0.1 uF
Diode (Fast Switching)
Spacer hex 2-56 11 mm
Strain Gromet
Nut 2-56 Hex
Lock Washer #2
Screw 2-56 1/4in Phillips
14 Pin IC Socket
Aluminum Case
LED holder and ring set 5mm
Hex Inverter
20 Pin IC Socket
Quad AND GATE
10 pin Key Female
10 pin Key Male with Ears
10 pin Key Connector
1K Resistors package of 10
Tax (15%):
Total
Name
U3
Item
L298N
C1
D1
1N4934
U1
45LS05N
U2
74ALS08
R1
148
Qty.
4
2
4
1
1
10
2
2
5
16
30
1
100
100
100
4
1
2
2
2
2
4
4
4
1
Unit
$5.40
$6.00
$7.20
$29.70
$3.59
$0.40
$3.15
$2.25
$0.18
$0.15
$0.32
$0.90
$0.03
$0.03
$0.02
$1.26
$30.00
$1.35
$0.52
$2.40
$0.45
$2.50
$2.50
$2.50
$0.90
Cost
$21.60
$12.00
$28.80
$29.70
$3.59
$3.96
$6.30
$4.50
$0.90
$2.40
$9.72
$0.90
$2.97
$2.97
$2.16
$5.04
$30.00
$2.70
$1.03
$4.80
$0.90
$10.00
$10.00
$10.00
$0.90
$31.18
$239.02
B.3. BAMBI 8-Axis Electrical Assembly
ICM-2900 Breakout I/O Electrical Connection Diagram (Page 1 of 2)
149
ICM-2900 Breakout I/O Electrical Connection Diagram (Page 2 of 2)
150
Front Panel Electrical Circuit Diagram Rev. B (Page 1 of 5)
151
Front Panel Electrical Circuit Diagram Rev. B (Page 2 of 5)
152
Front Panel Electrical Circuit Diagram Rev. B (Page 3 of 5)
153
Front Panel Electrical Circuit Diagram Rev. B (Page 4 of 5)
154
Front Panel Electrical Circuit Diagram Rev. B (Page 5 of 5)
155
Panel Board Top Trace Rev. A
156
Panel Board Bottom Trace Rev. A
157
Panel Board Component Placement Rev. A
158
Parts List for Panel Board Assembly Rev. A
Part
IC1
IC2
IC3
IC4
IC5
IC6
IC7
IC8
IC9
J1
J2
J3
J4
J5
J6
J7
J8
J9
J10
J11
J12
J13
J14
J15
J16
J17
J18
J19
J20
LED1
LED2
LED3
LED4
LED5
LED6
LED7
LED8
LED9
LED10
LED11
LED12
LED13
LED14
Value
74AC08N
74AC08N
74AC08N
74AC32N
74AC08N
74AC08N
74AC08N
74AC08N
74AC08N
LIMIT SWITCH
SERVO MOVE
STEP MOVE
AMP ENABLE
LED PWR
SERVO
ENABLE
STEP ENABLE
SWITCH 1
SWITCH 2
SWITCH 3
SWITCH 4
DO GALIL
DI GALIL
ANA GALIL
HOME GALIL
DO PANEL
ANA PANEL
DI PANEL
HOME PANEL
HOME LED
MOVEX
MOVEY
MOVEZ
G/Y
AENX
AENY
AENZ
Green
LX
LY
LZ
Red
DO1
DO2
Device
74AC08N
74AC08N
74AC08N
74AC32N
74AC08N
74AC08N
74AC08N
74AC08N
74AC08N
MTA09-100
MTA05-100
MTA05-100
MTA05-100
MTA02-156
Package
DIL14
DIL14
DIL14
DIL14
DIL14
DIL14
DIL14
DIL14
DIL14
10X09MTA
10X05MTA
10X05MTA
10X05MTA
1X2MTA
Library
74xx-eu
74xx-eu
74xx-eu
74xx-eu
74xx-eu
74xx-eu
74xx-eu
74xx-eu
74xx-eu
con-amp
con-amp
con-amp
con-amp
con-amp
MTA05-100
MTA05-100
MTA03-100
MTA03-100
MTA03-100
MTA03-100
MTA09-100
MTA09-100
MTA09-100
MTA05-100
MTA09-100
MTA09-100
MTA09-100
MTA05-100
MTA05-100
LED3MM
LED3MM
LED3MM
LED3MM
LED3MM
LED3MM
LED3MM
LED3MM
LED3MM
LED3MM
LED3MM
LED3MM
LED3MM
LED3MM
10X05MTA
10X05MTA
10X03MTA
10X03MTA
10X03MTA
10X03MTA
10X09MTA
10X09MTA
10X09MTA
10X05MTA
10X09MTA
10X09MTA
10X09MTA
10X05MTA
10X05MTA
LED3MM
LED3MM
LED3MM
LED3MM
LED3MM
LED3MM
LED3MM
LED3MM
LED3MM
LED3MM
LED3MM
LED3MM
LED3MM
LED3MM
con-amp
con-amp
con-amp
con-amp
con-amp
con-amp
con-amp
con-amp
con-amp
con-amp
con-amp
con-amp
con-amp
con-amp
con-amp
led
led
led
led
led
led
led
led
led
led
led
led
led
led
159
LED15
LED16
LED17
LED18
LED19
LED20
LED21
LED22
LED23
LED24
LED25
LED26
LED27
LED28
R1
R2
R3
R4
R5
R6
R7
R8
R9
R10
R11
R12
R13
R14
R15
R16
R17
R18
R19
R20
R21
R22
R23
R24
R25
R26
R27
R28
R29
R30
R31
R32
R33
DO3
DO4
DO5
DO6
DO7
DO8
Green
DI2
DI3
DI4
DI5
DI6
DI7
DI8
1k
1k
1k
1k
1k
1k
1k
1k
1k
1k
1k
1k
1k
1k
1k
1k
1k
1k
1k
1k
1k
1k
1k
1k
1k
1k
1k
1k
1k
1k
1k
1k
1k
LED3MM
LED3MM
LED3MM
LED3MM
LED3MM
LED3MM
LED3MM
LED3MM
LED3MM
LED3MM
LED3MM
LED3MM
LED3MM
LED3MM
R-US_0207/
R-US_0207/
R-US_0207/
R-US_0207/
R-US_0207/
R-US_0207/
R-US_0207/
R-US_0207/
R-US_0207/
R-US_0207/
R-US_0207/
R-US_0207/
R-US_0207/
R-US_0207/
R-US_0207/
R-US_0207/
R-US_0207/
R-US_0207/
R-US_0207/
R-US_0207/
R-US_0207/
R-US_0207/
R-US_0207/
R-US_0207/
R-US_0207/
R-US_0207/
R-US_0207/
R-US_0207/
R-US_0207/
R-US_0207/
R-US_0207/
R-US_0207/
R-US_0207/
LED3MM
LED3MM
LED3MM
LED3MM
LED3MM
LED3MM
LED3MM
LED3MM
LED3MM
LED3MM
LED3MM
LED3MM
LED3MM
LED3MM
30 7/10
30 7/10
30 7/10
30 7/10
30 7/10
30 7/10
30 7/10
30 7/10
30 7/10
30 7/10
30 7/10
30 7/10
30 7/10
30 7/10
30 7/10
30 7/10
30 7/10
30 7/10
30 7/10
30 7/10
30 7/10
30 7/10
30 7/10
30 7/10
30 7/10
30 7/10
30 7/10
30 7/10
30 7/10
30 7/10
30 7/10
30 7/10
30 7/10
160
led
led
led
led
led
led
led
led
led
led
led
led
led
led
rcl
rcl
rcl
rcl
rcl
rcl
rcl
rcl
rcl
rcl
rcl
rcl
rcl
rcl
rcl
rcl
rcl
rcl
rcl
rcl
rcl
rcl
rcl
rcl
rcl
rcl
rcl
rcl
rcl
rcl
rcl
rcl
rcl
R34
R35
R36
1k
1k
1k
R-US_0207/
R-US_0207/
R-US_0207/
30 7/10
30 7/10
30 7/10
161
rcl
rcl
rcl
Power Board Schematic Diagram Rev. B
162
Power Board Top Trace Rev. A
163
Power Board Bottom Trace Rev. A
164
Power Board Component Placement Rev. A
165
Parts List for Power Board Assembly Rev. A
Part
J1
J2
J3
J4
J5
J6
J7
J8
J9
J10
J11
K1
K2
K3
Value
POWER
PANEL EN
FAN2
FAN1
SERV1
SERV2
STEP1
STEP2
PANEL PWR
LED PWR
LED PWR
G5LE
G5LE
G5LE
Device
MTA06-156
MTA03-100
MTA03-100
MTA03-100
MTA04-156
MTA04-156
MTA04-156
MTA04-156
MTA05-156
MTA02-156
MTA02-156
G5LE
G5LE
G5LE
Package
1X6MTA
10X03MTA
10X03MTA
10X03MTA
1X4MTA
1X4MTA
1X4MTA
1X4MTA
1X5MTA
1X2MTA
1X2MTA
G5LE
G5LE
G5LE
166
Library
con-amp
con-amp
con-amp
con-amp
con-amp
con-amp
con-amp
con-amp
con-amp
con-amp
con-amp
relay
relay
relay
Servo Board Schematic Diagram Rev. B (Page 1 of 2)
167
Servo Board Schematic Diagram Rev. B (Page 2 of 2)
168
Servo Board Top Trace Rev. A
169
Servo Board Bottom Trace Rev. A
170
Servo Board Component Placement Rev. A
171
Servo Board Modifications From Rev. A to Rev. B
172
Parts List for Servo Board Assembly Rev. A
Part
C1
C2
C3
C4
C5
C6
C7
C8
C9
C12
C13
C14
C15
C16
C17
C18
C19
C20
C21
C22
C23
C24
C25
C26
IC1
IC2
IC3
IC4
IC5
IC6
IC7
IC8
IC9
J1
J2
J3
K1
K2
K3
K4
R1
R2
R3
Value
.22uf
.22uf
.1uf
.22uf
.22uf
.22uf
.22uf
.22uf
.1uf
.1uf
10uf
10uf
.22uf
10uf
.1uf
10uf
.1uf
10uf
.1uf
10uf
.1uf
.1uf
10uf
10uf
74AC08N
LM675T
LM675T
LM675T
LM675T
LM675T
LM675T
LM675T
LM675T
POWER
PANEL EN
LED MOVE
G5V1
G5V1
G5V1
G5V1
500k
600k
1
Device
C-US025-025X050
C-US025-025X050
C-US025-025X050
C-US025-025X050
C-US025-025X050
C-US025-025X050
C-US025-025X050
C-US025-025X050
C-US025-025X050
C-US025-025X050
CPOL-USE2.5-5
CPOL-USE2.5-5
C-US025-025X050
CPOL-USE2.5-5
C-US025-025X050
CPOL-USE2.5-5
C-US025-025X050
CPOL-USE2.5-5
C-US025-025X050
CPOL-USE2.5-5
C-US025-025X050
C-US025-025X050
CPOL-USE2.5-5
CPOL-USE2.5-5
74AC08N
LM675T
LM675T
LM675T
LM675T
LM675T
LM675T
LM675T
LM675T
MTA04-156
MTA05-100
MTA05-100
G5V1
G5V1
G5V1
G5V1
R-US_0207/10
R-US_0207/10
R-US_0207/10
Package
C025-025X050
C025-025X050
C025-025X050
C025-025X050
C025-025X050
C025-025X050
C025-025X050
C025-025X050
C025-025X050
C025-025X050
E2,5-5
E2,5-5
C025-025X050
E2,5-5
C025-025X050
E2,5-5
C025-025X050
E2,5-5
C025-025X050
E2,5-5
C025-025X050
C025-025X050
E2,5-5
E2,5-5
DIL14
CB367
CB367
CB367
CB367
CB367
CB367
CB367
CB367
1X4MTA
10X05MTA
10X05MTA
G5V1
G5V1
G5V1
G5V1
0207/10
0207/10
0207/10
173
Library
rcl
rcl
rcl
rcl
rcl
rcl
rcl
rcl
rcl
rcl
rcl
rcl
rcl
rcl
rcl
rcl
rcl
rcl
rcl
rcl
rcl
rcl
rcl
rcl
74xx-eu
linear
linear
linear
linear
linear
linear
linear
linear
con-amp
con-amp
con-amp
relay
relay
relay
relay
rcl
rcl
rcl
R4
R5
R6
R7
R8
R9
R10
R11
R12
R13
R14
R15
R16
R17
R18
R19
R20
R21
R22
R23
R24
R28
R30
R31
R32
R33
R34
R35
R36
X1
X2
X3
X4
X5
500k
600k
1
500k
600k
1
500k
600k
1
500k
600k
1
500k
600k
1
500k
600k
1
500k
600k
1
10k
10k
10k
10k
10k
10k
10k
10k
057-014-1
057-014-1
057-014-1
057-014-1
057-040-1
R-US_0207/10
R-US_0207/10
R-US_0207/10
R-US_0207/10
R-US_0207/10
R-US_0207/10
R-US_0207/10
R-US_0207/10
R-US_0207/10
R-US_0207/10
R-US_0207/10
R-US_0207/10
R-US_0207/10
R-US_0207/10
R-US_0207/10
R-US_0207/10
R-US_0207/10
R-US_0207/10
R-US_0207/10
R-US_0207/10
R-US_0207/10
R-US_0207/15
R-US_0207/15
R-US_0207/15
R-US_0207/15
R-US_0207/15
R-US_0207/15
R-US_0207/15
R-US_0207/15
057-014-1
057-014-1
057-014-1
057-014-1
057-040-1
0207/10
0207/10
0207/10
0207/10
0207/10
0207/10
0207/10
0207/10
0207/10
0207/10
0207/10
0207/10
0207/10
0207/10
0207/10
0207/10
0207/10
0207/10
0207/10
0207/10
0207/10
0207/15
0207/15
0207/15
0207/15
0207/15
0207/15
0207/15
0207/15
057-014-1
057-014-1
057-014-1
057-014-1
057-040-1
174
rcl
rcl
rcl
rcl
rcl
rcl
rcl
rcl
rcl
rcl
rcl
rcl
rcl
rcl
rcl
rcl
rcl
rcl
rcl
rcl
rcl
rcl
rcl
rcl
rcl
rcl
rcl
rcl
rcl
con-panduit
con-panduit
con-panduit
con-panduit
con-panduit
Appendix C
Software
175
C.1. BAM File Structure
// Block Count
m_iBlockCount
FOR i = 1 to m_iBlockCount
// Block ID
m_iID
// Path ID
m_iPathID
// Block Settings
m_ulStartTic
m_bAutoFocus
m_bBlockEnable
m_iHeight
m_iWidth
m_fCameraLens
m_iObjective
m_iOrigin
m_iArray
m_lStepX
m_lStepY
m_lStepZ
m_iRows
m_iCols
m_iSlices
m_lULX
m_lULY
m_lULZ
m_lURX
m_lURY
m_lURZ
m_lLRX
m_lLRY
m_lLRZ
m_lZOffset
// DIC Settings
m_ulNextDICTic
m_ulLayerCount
m_sFileName
m_sFilePath
m_sLogFileName
m_iShutter
m_lInterval
// LED Settings
FOR j = 0 to 4
m_ulNextLEDTic[j]
m_ulLEDLayerCount[j]
m_bLED[j]
m_sLEDFileName[j]
m_sLEDFilePath[j]
m_sLogLEDFileName[j]
m_iAccumulates[j]
m_iLEDGain[j]
176
m_iLEDShutter[j]
m_lLEDInterval[j]
ENDFOR
// WayPoint Count
m_iNumWayPoints
FOR k = 1 to m_iNumWayPoints
// WayPoint info
coord[0]
coord[1]
coord[2]
m_bEnable
m_iID
ENDFOR
ENDFOR
177
C.2. Mosaic Block Structure
Type
Name
Description
int
int
m_iID
m_iPathID
int
m_iOrigin
int
m_iArray
bool
bool
m_bAutoFocus
m_bLED[5]
int
int
int
int
int
m_iGain
m_iLEDGain[5]
m_iShutter
m_iLEDShutter[5]
m_iObjective
int
m_iAccumulates[5]
float
int
int
long
long
long
int
int
int
long
long
long
long
long
long
long
long
long
long
m_fCameraLens
m_iHeight
m_iWidth
m_lStepX
m_lStepY
m_lStepZ
m_iRows
m_iCols
m_iSlices
m_lULX
m_lULY
m_lULZ
m_lURX
m_lURY
m_lURZ
m_lLRX
m_lLRY
m_lLRZ
m_lZOffset
long
long
m_lInterval
m_lLEDInterval[5]
int
m_iNumWayPoints
A unique ID given to each block
The path the camera will take to collect all images in the mosaic
- default is ZigZag. (ZigZag or Linear).
Logical state of the control waypoints 0x000.
Defined UL is 0x100, UR is 0x010, and LR 0x001.
State of waypoint calculation.
0 = uncalculated waypoints 1 = calculated waypoints
0 = Autofocus Off. 1 = Autofocus On
If true, the LED channel for this block has been defined and
enabled.
Camera gain setting for DIC
Camera gain setting for LEDs
Camera shutter setting for DIC
Camera shutter setting for LEDs
Microscope objective lens power value (Usually 5, 10, 20, 40,
or 60)
The number of images to be collected and summed for the
LEDs
Camera adapter lens power value (Usually 1.0, 0.5, or 0.4)
Height in pixels of the camera image
Width in pixels of the camera image
Horizontal grid spacing in motor units
Vertical grid spacing in motor units
Rising grid spacing in motor units
The number of rows in the mosaic
The number of columns in the mosaic
The number of slices in Z direction for the mosaic block
Mosaic Block defined by upper left corner x coordinate
Mosaic Block defined by upper left corner y coordinate
Mosaic Block defined by upper left corner z coordinate
Mosaic Block defined by upper right corner x coordinate
Mosaic Block defined by upper right corner y coordinate
Mosaic Block defined by upper right corner z coordinate
Mosaic Block defined by lower right corner x coordinate
Mosaic Block defined by lower right corner y coordinate
Mosaic Block defined by lower right corner z coordinate
A z-offset value in motor units to be applied to each waypoint.
It is used to correct for focal drift and persist focal drift
corrections. Currently not used as it is easier to reset the origin
base point.
Minimum time to cycle between time slices (in seconds)
Minimum time to cycle between fluorescent time slices (in
seconds)
The number of waypoint objects (usually rows * cols)
178
CObList
m_oWayPoints
CString
CString
CFile*
CString
CString
CFile*
CString
CFile*
CString
CFile*
unsigned
long
unsigned
long
unsigned
long
unsigned
long
unsigned
long
bool
m_sFileName
m_sFilePath
m_pFile
m_sLEDFileName[5]
m_sLEDFilePath[5]
m_pLEDFile[5]
m_sLogFileName
m_pLogFile
m_sLogLEDFileName[5]
m_pLogLEDFile[5]
m_ulStartTic
This is the object list containing the pointers to all the
waypoints
This is the file name of the DIC raw file
This is the path of the DIC raw and log file
Pointer to the DIC raw file
This is the file name of the LED raw files
This is the file path of the LED raw and log files
Pointer to the LED raw files
This is the file name of the DIC log file
Pointer to the DIC log raw file
This is the file name of the LED log files
Pointer to the LED log files
This will be the tick count at the beginning of the experiment
m_ulNextDICTic
The time for the next DIC cycle to start
m_ulNextLEDTic[5]
The time for the next LED cycle to start
m_ulLayerCount
The current number of DIC layers accumulated
m_ulLEDLayerCount[5]
The current number of LED layers collected
m_bBlockEnable
Enabled = 1, Disabled = 0.
179
180
References
Anderson, J., Chiu, D., Jackman, R., Cherniavskaya, O., McDonald, J., Whitesides, S.,
Whitesides, G. (2000). Fabrication of Topologically Complex Three-Dimensional Microfluidic
Systems in PDMS by Rapid Prototyping. Analytical Chemistry, 7, 3158-3164.
Andrews, P., Harper, I., Swedlow, J. (2002). To 5D and Beyond: Quantitative Fluorescence
Microscopy in the Postgenomic Era. Traffic, 3, 29-36.
Applegate, R. Jr., Squier, J., Vestad, T., Oakey, J., Marr, D. (2004). Optical trapping,
manipulation, and sorting of cells and colloids in microfluidic systems with diode laser bars.
Optics Express, 12(19), 4390-4398.
Ashkin, A., Dziedzic, J. (1987). Optical Trapping and Manipulation of Viruses and Bacteria.
Science, 235, 1517-1520.
Astrom, K., Hagglund, T. (1995). PID controllers: Theory, design and tuning. North Carolina:
Instrument Society of America Research Triangle Park.
Casey, D. (1999). HGP Leaders Confirm Accelerated Timetable for Draft Sequence. Human
Genome News, 10, 1.
Baker, C., Ulrich, I. (2004). CMU 1394 Digital Camera Driver. Retrieved July, 14. 2007, from
http://www.cs.cmu.edu/~iwan/1394/
Barron, J., Wu, P., Ladouceur, H., Ringeisen, B. (2004). Biological Laser Printing: A Novel
Technique for Creating Heterogeneous 3-Dimensional Cell Patterns. Biomedical Microdevices,
6(2), 139-147.
Boland T., Wilson C. (2003). Cell and Organ Printing 1: Protein and Cell Printers. The
Anatomical Record, 272A, 491-496.
Boland T, Wilson C. (2003). Cell and Organ Printing 2: Fusion of Cell Aggregates in ThreeDimensional Gels. The Anatomical Record, 272A, 497-502.
Burglin, T. R. (2000). A two-channel four-dimensional image recording and viewing system with
automatic drift correction. Journal of Microscopy, 200(1), 75-80.
Carpenter, A., Ashouri, A., Belmont, A. (2004). Automated Microscopy Identifies Estrogen
Receptor Subdomains With Large-Scale Chromatin Structure Unfolding Activity. Cytometry,
58A, 157-166.
181
Chalfie, M., Tu, Y., Euskirchen, G., Ward, W. W., & Prasher, D. C. (1994). Green fluorescent
protein as a marker for gene expression. Science, 263, 802-805.
Chin, V., Taupin, P., Sanga, S., Scheel, J., Gage, F., Bhatia, S. (2004). Microfabricated Platform
for Studying Stem Cell Fates. Biotechnology and Bioengineering, 88, 399-414.
Chiu, D., Jeon, N., Huang, S., Kane, R., Wargo, C., Choi, I., Ingber, D., Whitesides, G. (2000).
Patterned deposition of cells and proteins onto surfaces by using three-dimensional microfluidic
systems. Proceedings of the National Academy of Sciences, 97, 2408-2413.
Cox, G. (2006) Optical Imaging Techniques in Cell Biology. FL: CRC Press.
Curtis, J., Koss, B., Grier, D. (2002). Dynamic holographic optical tweezers. Optics
Communications, 207, 169-175.
Dvorak, J., Stotler, W. (1971). A Controlled-Environment Culture System for High Resolution
Light Microscopy. Experimental Cell Research. 68, 144-148.
Ellson, R., Mutz, M., Browning, B., Lee, L. Jr., Miller. M., Papen, R. (2003). Transfer of Low
Nanoliter Volumes between Microplates Using Focused Acoustics—Automation Considerations.
JALA, 8, 29–34.
Firestone, L., Cook, K., Culp, K., Talsania, N., Preston, K. Jr. (1991). Comparison of Autofocus
Methods for Automated Microscopy. Cytometry, 12, 196-206.
Forsyth, D., Ponce, J. (2003). Computer Vision: A Modern Approach. NJ: Pearson Education Inc.
Geusebroek, J., Cornelissen, F., Smeulders, A., Geerts, H. (2000). Robust Autofocusing in
Microscopy. Cytometry, 39, 1-9.
Gonzales, R., Woods, R. (2002). Digital Image Processing. NJ: Prentice-hall Inc.
Groen, F., Young, I., Ligthart, G. (1985). A Comparison of Different Focus Functions for Use in
Autofocus Algorithms. Cytometry, 6, 81-91.
Gruber, L., Bradley, K., Lopes, W., Lancelot, R., Plewa, J., Grier, D. (2004). System and method
of sorting materials using holographic laser steering. United States Patent Application:
20040089798.
Ince, C., Ypey, D., Diesselhoff-Den Dulk, M., Visser, J., De Vos, D., Van Furth, R. (1983).
Micro-CO2-Incubator for Use on a Microscope. Journal of Immunological Methods, 60, 269-275.
Inoué, S. (1986). Video Microscopy. New York: Plenum Press.
182
Johnson, E. T., Goforth, L. J. (1974). Metaphase spread detection and focus using closed circuit
television. Journal of Histochemistry and Cytochemistry, 22, 536–545.
Lalan S, Pomerantseva I, Vacanti J. (2001). Tissue Engineering and Its Potential Impact on
Surgery. World Journal of Surgery. Vol. 25, 1458-1466.
LaMothe, A. (2003). Tricks of the 3D Game Programming Gurus. Advanced 3D Graphics and
rasterization. USA: Sams Publishing.
Lamprecht, M., Saatini, D., Carpenter, A. (2007). CellProfiler™: free, versatile software for
automated biological image analysis. BioTechniques, 42(1), 71-75.
Lewis, P., Yang, C. (1997). Basic Control Systems Engineering. New Jersey: Prentice-Hall Inc.
Galil Motion Control Inc. (2006). DMCWin32 Galil Windows API Tool Kit Manual Rev 2.2.
Retrieved July 23, 2007, from http://www.galilmc.com/support/manuals/dmcwin.pdf
Liu, V., Bhatia, S. (2002). Three-Dimensional Photopatterning of Hydrogels Containing Living
Cells. Biomedical Microdevices, 4(4), 257-266.
Moogk, D., Hanley, S., Ramunas, J., Blaylock, A., Skorepova, J., Rosenberg, L., Jervis, E.
(2007). Design and Analysis of a Long-Term Live-Cell Imaging Chamber for Tracking Cellular
Dynamics Within Cultured Human Islets of Langerhans. Journal of Biotechnology and
Bioengineering, Not yet in print.
Murphy, D. (2001). Fundamentals of Light Microscopy and Electronic Imaging. DE: Wiley-Liss
Inc.
Mutz, M., et al. (2002). Focused acoustic energy for ejecting cells from a fluid. United States
Patent Application: 20020064808.
Pawley, J. (1995). Handbook of Biological Confocal Microscopy. New York: Plenum Press.
Pepperkok, R., Ellenberg, J. (2006). High-throughput fluorescence microscopy for systems
biology. Nature Reviews: Molecular Cell Biology, 7, 690-696.
Price, J., Gough, D. (1994). Comparison of Phase-Contrast and Fluorescent Digital Autofocus for
Scanning Microscopy. Cytometry, 16, 283-297.
Ringeinsen, B., Kim, H., Barron, J., Krizman, D., Chrisey, D., Jackman, S., Auyeung, R., Spargo,
B. (2004). Laser Printing of Pluripotent Embryonal Carcinoma Cells. Tissue Engineering, 10,
483-491.
183
Schnelle, T., Muller, T., Hagedorn, R., Voigt, A., Fuhr, G. (1999). Single micro electrode
dielectrophoretic tweezers for manipulation of suspended cells and particles. Biochimica et
Biophysica Acta, 1429, 99-105.
Sciperio Inc. (2002). The Preventative BAT Construct-the Artificial Lymph Node (ALN).
Retrieved Dec. 2002, from http://www.sciperio.com/bio/aln.html
Tan, W., Desai, T. (2004). Layer-by-layer microfluidics for biomimetic three-dimensional
structures. Biomaterials, 25(7-8), 1355-64.
Taylor, D. L., Haskins, J. R., Giuliano, K. A. (2007). High content screening: a powerful
approach to systems cell biology and drug discovery. Totowa, NJ: Humana Press.
Teschler, L. (2005). Precision moves with pint-sized motors. Machine Design, 77(7), 96-105.
Uchida, M., Sato-Maeda, M., Tashiro, H. (1995). Whole-Cell manipulation by optical trapping.
Current Biology, 5(4), 380-382.
White, D., Scribner, K., Olafsen, E. (1999). MFC programming with Visual C++ 6 Unleashed.
USA: Sams Publishing.
White, J., Amos, W., Fordham, M. (1987). An Evaluation of Confocal Versus Conventional
Imaging of Biological Structures by Fluorescence Light Microscopy. Journal of Cell Biology,
105, 41-48.
Wolf, F., Geley, S. (2005). A simple and stable autofocusing protocol for long multidimensional
live cell microscopy. Journal of Microscopy, 221(1), 72-77.
Ziegler, J., Nichols, N. (1942). Optimum settings for automatic controllers. Transactions of the
ASME, 64, 759-768.
Zimmermann W, Melnychenko I, Eschenhagen T. (2004). Engineered heart tissue for
regeneration of diseased hearts. Biomaterials Vol. 25, 1639-1647.
184