1
Registrador PINGÜIM
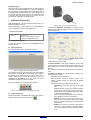
Offset: Allows fine offset corrections on the measured value.
Unit: Selects either ºC or ºF for indication of temperature in
channel 1. Channel 2 is fixed in %.
Alarm: Available only for the temperature channel. The routines
for alarms LOW and HIGH are executed every time the logger
samples the temperature, informing the occurrence of an alarm
by a blinking code in the front cover LED (see section 3 for the
blinking code meaning).
4- Acquisitions: Defines the logging interval. For instantaneous
measurements, the minimum interval is 1s for the T model and 5s for
the RHT model. When average, minimum or maximum is selected, the
minimum interval is 50s.
The Daily Repetition allows loggings to be repeated everyday, for
example, recording data from 8 AM to 5 PM day after day.
5- Start Logging: Allows selection of 5 distinct approaches for starting
the acquisitions:
Immediately: immediately after clicking on the OK button for
sending the new configuration to the logger.
Stat with Palm: The acquisitions are started by a command send
by a PDA with the LogChart PalmOS software installed.
Day: Date to start the logging.
Hour: time to start the logging
With START Button: start or stop acquisitions when the Start
button is pressed for at least 2 seconds. The front LED will blink
twice indicating the logging has started.
NOTE: the Penguin must be awaked in order to accept the
command. The logger wakes up when the Start button is pressed
momentarily.
Setpoint: The logging initiates when the value of the temperature
reading is lower or higher than the LOW or HIGH Setpoints
respectively. The LOW and HIGH Setpoint values are entered in
the Channel 1 box, taking the place of the alarms, whose functions
are disabled in this operating mode.
6- Stop Logging: The Penguin can be configured to stop acquisition in
the following ways:
At Full Memory: logging will stop when memory capacity is
reached.
Wrap around: Logging never stops. The Penguin will keep on
recording the readings and when the memory is full it will overwrite
the oldest record in a circular or wrap around manner.
After: The logging will stop after the number of readings here
defined.
Day: Date for the loggings to stop. If the memory capacity is
reached earlier than the date here defined, the logging is
interrupted.
5.2 Saving data
The offloaded data can be saved for future analysis accessing the
menu “File Save” of “File Save as”.
5.3 Visualizing the data
Three windows are provided for data visualization. The records can be
analyzed in the form of Chart or Table. A third window, called General
Information, shows the logger configuration and identification. See
Figure 7 for details. The same windows are created when the data is
read from a previously saved file.
A region of interest in the data can be selected (see item 5.3.3 Chart
Window, below). The Chart window can be printed and the
corresponding data exported as text files to other applications, such as
spread sheets.
5.3.1
General Information window
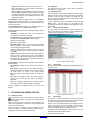
This window shows information about the logger configuration and
about the data that has been transferred. Penguin identification and
acquisition details are presented, as seen in Figure 7.
Figure 7 –General Information Window
5.3.2
Table window
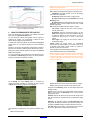
Here the data is presented in a table format, showing the date/time and
the records values.
Hour: Time for logging to stop. If the memory capacity is reached
earlier than the time here defined, the logging is interrupted.
When the configuration is completed, click on “OK” to send it to the
Penguin.
5
OFFLOADING AND VIEWING THE DATA
5.1 Transfering records
Transferring the data to a PC is accomplished by clicking on the icon
in the LogChart II software. The Penguin must be awaked and the
IR wand pointed to it.
While in offloading process, a progress bar will be displayed. The
offload time is proportional to the amount of data being transferred
(number of records in memory).
When data transfer is completed, a sound is emitted and three
windows are created: Chart, Table and General Information windows.
The logging is not stop during the data offload process.
Figure 8 – Acquisition table window
5.3.3
Chart window
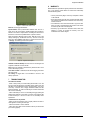
The Chart is a convenient tool for analysis. As one moves the mouse
in the chart area, the time and the value of the records of each channel
are shown in the field located in the bottom of the window.
Zooming in and out are implemented. They are available in the menu
“View” or in the tool bar as icons. It is possible to select an area by
clicking and dragging the mouse, creating this way a zoom region,
starting at the upper left position of the region of interest.
The graphs can be moved vertically by moving the mouse up or down
while keeping the mouse right button pressed.
Figure 9 shows the chart window.
NOVUS PRODUTOS ELETRÔNICOS LTDA. – WEBSITE: www.novus.com.br - FONES: RS: (51) 3323-3600 SP: (11) 3675-0366 PR: (41) 372-8476