1
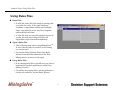
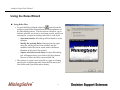
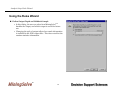
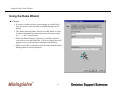
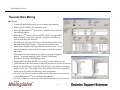
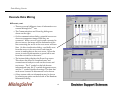
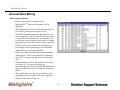
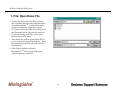
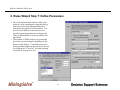
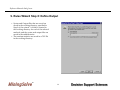
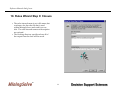
TM
Training Manual
Using the Decision Support Sciences Data Mining
Automation Engine To Automate Effective
Marketing Strategy Development
Decision Support Sciences. Better Science. Better Solutions.
Introduction: What is Data Mining?
MiningSolveTM uses many statistical techniques to optimize the predictions of specified variables.
MiningSolveTM runs thousands of runs automatically in order to find the highest performing models.
MiningSolveTM can produce and scan thousands of models in the time it takes to put together one
model with a conventional statistical package. Rather than manually setting up each analysis run, the
user can efficiently evaluate only the solutions MiningSolveTM determines are the best solutions.
Using the technology of distributed computing, MiningSolveTM can be run on many computers at once
connected by a local area network (LAN) or the internet. This leverages existing computing power to
run thousands of models per day efficiently and economically.
TM
2
Table of Contents
I. Analysis Setup
1. Using Rules Files
2. Using the Rules Wizard
II. Data Mining
III. Appendix: Dialog Boxes
TM
3
I. Analysis Setup
1. Using Rules Files
2. Using the Rules Wizard
TM
4
Analysis Setup: Using Rules Files
Using Rules Files
Rules Files
• A rules file stores all of the analysis settings that
you select for a run. If the same database,
variables, or algorithms will be used multiple
times, one rules file can be used as a template
and modified each time.
• A rules file does not store the analysis reports or
results, but with an existing rules file, the
algorithms can be executed immediately.
Open a Rules File:
• This is the first step when using MiningSolveTM.
A new rules file may be created, or an existing
one can be used.
• To start the Rules Wizard, Select Start Rules
Wizard from the Rules submenu of the Data
Mining menu, as shown at the right.
Using Rules Files
• If an existing rules file is opened and you want to
maintain the analysis preferences, select Data
Mining, Execute.
• To modify the existing file or set the preferences
for the new rules file, use the Rules Wizard.
TM
5
Analysis Setup: Rules Wizard
Using the Rules Wizard
Using Rules Files
• To start the Rules Wizard, select the
button from the
toolbar or Start Rules Wizard from the Rules submenu of
the Data Mining menu. The first screen will allow you to
indicate whether you want to start from scratch, modify an
existing file, or open an existing rules file to work from.
– Start from scratch: All settings will be blank or at the
defaults.
– Modify the existing Rules: Settings from the open
rules file will be pre-set in the wizard, and the
modified rules file can be saved under a different
filename at the end of the wizard.
– Open a rules file to work from: an Open File dialog
box will appear when you click on the Next button.
Browse to select the file to use and click OK.
• The options to create a new rules file or open an existing
one are also available manually from the File menu (the
New Rules and Open Rules menu items).
TM
6
Analysis Setup: Rules Wizard
Using the Rules Wizard
Define Goal
• MiningSolveTM is a powerful tool for determining optimum
solutions to many different business problems. In this dialog
box, the options for which problem to address and the
techniques used to solve it are listed.
• Use the mouse to select the problem to address. When any
problem is selected, the algorithms that apply to that problem
will appear in the lower text box.
• To select an algorithm, use the mouse to click on it. To open or
close branches, click on the + or - boxes on the left of the tree.
TM
7
Analysis Setup: Rules Wizard
Using the Rules Wizard
Build Mirrored Database
• A database is required to provide the input for the
data mining. The input file must be an SPSS 7.5 or
higher .sav file. SPSS should be installed on the
computer before using MiningSolveTM. Note: SPSS
should NOT be running when MiningSolveTM is
open; if SPSS is running, the MiningSolveTM server
will not connect to the root server.
• Select the Add button to open a browse dialog box to
choose a file. While the file is being loaded, a
progress indicator will tell you the database name
and fields that are being imported.
• Select the variables to use from the Source Fields box,
and move them to the Mirrored Fields box using the
arrow button in the middle.
TM
8
Analysis Setup: Rules Wizard
Using the Rules Wizard
Select Variables
• Select one variable to predict, and at least one
variable to be used in prediction. The field to
predict must be a categorical variable, with 2 or
more non-missing levels. Highlight the variable(s)
in the Mirrored Fields box, and use the arrows to
move them to the box of selected variables.
• All of the available fields are listed in the Mirrored
fields list box, categorized by type.
TM
9
–
designates a nominally encoded variable,
which means it can be stored as a binary
number. Any variable that can be asked as a
yes/no question would fit this category (i.e.
gender, have savings account, etc.) This is a
discrete variable.
–
designates an interval scaled variable, which
when asked in an interview, usually requires a
text entry answer. This is a continuous
variable, without level labels.
Analysis Setup: Rules Wizard
Using the Rules Wizard
Identify Recommended Approaches
• The data variables that were selected for the analysis may
not be appropriate for every analysis method that is used.
There are three options for dealing with data fields that
are incompatible with an analysis method.
– Use the maximum number of methods, eliminating
fields not appropriate to each specific method: This
option leaves the incompatible data field out of the
particular method for which it is inappropriate.
– Use the maximum number of methods, recoding
fields not appropriate to each specific method: The
second option attempts to use all of the selected data
fields. Data that is not compatible with a specific
method will be recoded (i.e. a continuous variable
will be transformed using exponents to be used as a
discrete variable).
– Use only appropriate methods, deleting from the
query all methods requesting unmatching types:
This option eliminates the analysis method, rather
than the data field, if there is incompatible data.
TM
10
Analysis Setup: Rules Wizard
Using the Rules Wizard
Select Cases for Inclusion
• A specific segment of respondents can be
extracted from the data for an analysis run.
These respondents can be selected either by
region or by market segment.
– The region option can only be used if
location information has been included
in the selected databases. If the region
option is checked, a map dialog will
appear. Use the zoom and arrow
controls to select the desired region.
– Market segment: Specific segments of
the market can be included or excluded
from the analysis. Use the mouse to
click on the checkmark to the left of the
segment or level. The levels for the
highlighted segment appear in the
Segment Levels box on the right.
Segments and levels with a checkmark
will be included in the analysis. Select
the Done button when you are finished
selecting segments. The total number
of cases to be used is displayed at the
bottom of the dialog at “Matching
Cases”.
TM
11
Analysis Setup: Rules Wizard
Using the Rules Wizard
Select Cases for Inclusion, cont.
• In data mining, a sample of the population is
analyzed, and the results are evaluated for how
accurately the population was characterized.
The most reliable and real-world method of
validation is to test the model on cases held back
from the analysis, and compare what the model
predicts to what we already know about the
case. This is called hold-back sample validation.
• The Sample Size reflects the number of valid
cases, taking into account any segments that
were selected. A portion of the valid cases can
be randomly selected by adjusting the working
file size slider.
• The Rules Wizard allows you to specify the
holdback sample. The holdback sample is the
portion of the data that is excluded from the
current analysis run. Note: the holdback
sample is NOT the sample of respondents being
included in the analysis.
• The percentage of the sample and number of
respondents in the holdback sample is specified
above the slider.
TM
12
Analysis Setup: Rules Wizard
Using the Rules Wizard
Define Parameters
• This dialog box displays the analysis specifications for each data
mining method.
• The parameters can be set the same for all algorithms, or uniquely for
each algorithm. Use the radio buttons under the Data mining method
box to specify your choice.
– If ‘Use the same settings for all algorithms’ is selected, All
algorithms must be selected under Data mining method in order to
move the sliders.
– To customize each algorithm individually, set the parameters for one
method, then select the next method to customize.
• Use the mouse to move the sliders to change the level for that criteria.
If an algorithm is being customized individually, the current level of
the parameter is displayed on the right side of the box.
• The combined effect of the parameter levels on the number of SPSS
scripts to be generated is displayed below the last slider, and changes
dynamically as the level of any specific parameter is modified.
• To further customize the analysis, select the “Advanced” button at
the bottom of the dialog to determine the order of the selected
methods or the transformations settings. For example, if Rao’sV is set
as the first method in the advanced dialog AND “In Order Below” is
selected, and only 1/6 methods is selected on the Define Parameters
dialog (as the settings are shown), then scripts will only be generated
for MDA using the Rao’s V method.
• The total number of scripts to be generated is shown at the bottom of
the dialog. If a cutoff number is set, MiningSolveTM will randomly
choose that number of scripts to run in the analysis.
TM
13
Analysis Setup: Rules Wizard
Using the Rules Wizard
Define Output Depth and Holdback Sample
• In this dialog, the user can select how MiningSolveTM
handles the output, and which output is saved for future
use.
• Changing the style of output affects how much information
is included in the SPSS output files. This does not affect the
runtime statistics information.
TM
14
Analysis Setup: Rules Wizard
Using the Rules Wizard
Closure
• It is best to name and save your settings as a rules file in
case you want to use the same or similar settings in the
future.
• The ‘Rules Internal Name’ field is not a file name, so does
not have standard file name restrictions; characters such
as / \ , : ; and “ are allowed.
• When the Finish button is selected, you will be asked if
you want to save the Rules file. A Save As dialog box will
appear, and you can specify a filename and directory.
• When a rules file is complete, select Execute from the Data
Mining menu to run the analysis.
TM
15
II. Data Mining
TM
16
Data Mining: Execute
Execute Data Mining
Execute
• A rules file must exist and be open to execute data mining.
• Make sure that SPSS is not currently open.
• From the MiningSolveTM Root Server, select Execute from the
Data Mining menu.
• MiningSolveTM servers will open SPSS and the .sav data files
that are linked to the open rules file, and then use SPSS as a
tool for executing the analysis.
• The dialog at the right is the Server Information portion of the
Runtime Information Center. All potential servers on the
network are displayed, along with their current status. To see
more information, select one of the options on the left side of
the dialog.
• The analysis can be paused at any time by using the Suspend
button. To resume analysis, select “Restart Unfinished
Execution” from the Data Mining menu.
• Displayed in the “Best Model” box at the top of the dialog are the
specifications of the best model in the analysis thus far, across all servers.
• Select the Details button in the Best Model box for a prediction accuracy
graph of each run. The graph shows the prediction levels in numerical
order, not in the order in which they were performed.
• Use the “Add Server” button to add a server that is not on the network,
or that MiningSolveTM does not find automatically.
• To view computers on the local area network, use the “View Network”
button.
TM
17
Data Mining: Execute
Execute Data Mining
Execute, cont.
• There are several different views of information on a
current MiningSolveTM run.
• The Communications and Event log dialogs are
shown on the right.
• On the communications dialog, potential servers are
shown as transparent images until they are
connected. When a server is active and connected to
the root server, the image will be darkened and the
line connecting the server to the root server will turn
blue. On this visualization dialog, a red ball is sent
from the server to the root server each time the
server is sending data to the root server. When the
server is receiving information, a green ball is sent
from the root server to the server.
• The bottom dialog displays the Event Log screen.
This shows the status of completed runs, and
connection and analysis events on the servers and
root server. The ‘I’ symbol on the left denotes
informational stats, the ‘E’ symbol designates errors,
and the ‘?’ symbol signifies warnings. The time that
each server connects or disconnects is also shown.
• Other screens with run information may be shown
by selecting an option on the left side of the Runtime
Information dialog.
TM
18
Data Mining: Execute
Execute Data Mining
Execute, cont.
• The picture on the right shows the Performance
dialog from the Runtime Information Center. This
dialog displays graphs and statistics for a set of
runs.
• To change the graph that is displayed, click on one
of the tabs below the graph. The graphs are
dynamically updated as the runs are completed.
• The OCCP tab shows the Overall Correct
Classification Percentages for all runs. The Lift tab
shows the lift, which is OCCP above chance alone.
Chance is calculated by taking the sum of the
squares of the number of cases in each group,
divided by the square of the total number of cases.
Lift = (100% - OCCP) / (100% - Chance)
• In the bottom half of the dialog, the run statistics are
shown. These statistics can be sorted by any column
by clicking on the column heading. Use the scroll
bar to view all of the statistics. This list of statistics
is also shown sorted by lift in the Execution
Summary dialog when the runs have been
completed.
TM
19
Data Mining: Execute
Execute Data Mining
Execute, cont.
• The picture on the right shows the Best Run dialog
from the Runtime Information Center. This dialog
displays detailed results for one run.
• The best run that is shown may change based on the
criteria used to select the best run. To change the
criteria used to select the best run, use the mouse to
click the arrow in the “Criteria for best run” box.
• Changing the criteria used to select the best run will
also change the run that is displayed in the Best
Model box at the top of the Runtime Information
Center. This change will be reflected on all dialogs
of the Runtime Information Center.
TM
20
Data Mining: Execute
Execute Data Mining
Using the MiningSolveTM Server
• To generate models using MiningSolveTM, there must
be at least one server open and connected to the root
server. If MiningSolveTM was installed to the default
location, select Start, Program Files, Decision Support
Sciences, MiningSolveTM_Distributed, MiningSolveTM
Server.
• If the MiningSolveTM server is open and connected
through a network to the computer with the
MiningSolveTM Root Server, the Root Server will
automatically locate the server and begin generating
models with it.
• Availability of the server can be customized by
selecting ‘Advanced’ from the Availability menu on the
server. In the top portion of the dialog, a specific time
can be specified to allow a connection. To set up a
schedule of availability, use the Custom option, and the
bottom section of the dialog will become available.
• Either the times to allow a connection or the times to
block a connection are shown. Select the Allow
Connection or Don’t Allow Connection options to
change which options are viewed. Select one or more
days and a range of times, then select the Add button
to add an additional set of criteria for the server
availability.
TM
21
Data Mining: Execute
Execute Data Mining
Execution Summary
• When a run has been completed, the
MiningSolveTM Execution Summary will be
displayed.
• This information is sorted in descending order of
Lift, which puts the best runs at the top.
• The Run # column shows the order that the runs
were completed. The SPS and SPO files are saved
for each run and named by the run number, so if
you want to rerun a specific syntax file, or inspect
the output later, the run number will be necessary.
• OCCP stands for Overall Correct Classification
Percentage, and the percentage of the holdback
sample that was correctly classified.
• Lift is the correct classification percentage above
chance alone. This is determined by comparing
the OCCP to the percentage achieved by chance
alone.
• Transformation refers to the power that the data
was taken to. The range and steps for
transformation can be set in the Define Parameters
step of the Rules wizard, by using the Advanced
button.
• The specifications of each run are listed, so that
algorithms that performed well can be explored
further for the current data set.
TM
22
III. Appendix - Reference Manual
TM
23
Reference Manual: dialog boxes
1. File: Open Rules File
A rules file stores all of the files, options,
and variables that have been selected while
using MiningSolveTM. A rules file must be
opened or created to begin the analysis.
To Create a rules file, select New Rules from
the File menu before you start the analysis.
To use an existing rules file, select Open
Rules from the File menu.
This dialog box will be opened that allows
you to browse through all directories. When
the desired file has been selected, click the
Open button.
• If the Cancel button is selected,
MiningSolveTM will exit this dialog box
without opening a rules file.
TM
24
Reference Manual: dialog boxes
2. Rules Wizard Step 1: Introduction
The rules file is the easiest and most efficient way to step
through all of the customizable options for the data
mining.
To begin the rules wizard, either select the
icon from
the toolbar, or “Start Rules Wizard” from the Rules
submenu of the Data Mining menu. The rules wizard
will present options on each screen that must be
determined to execute the data mining analysis. Use the
mouse to make your selection, then click on the Next
button.
• At any point beyond the second step, you can also go
back to the previous rules wizard pages to modify your
selections by using the Back button.
• If the Cancel button is selected, MiningSolveTM will exit
the wizard and cancel any changes that were made.
TM
25
Reference Manual: dialog boxes
3. Rules Wizard Step 2: Define Goal
This dialog box allows you to select the
desired business problem, and displays the
appropriate algorithms for that problem.
Use the mouse to select the desired business
problem. Algorithms will be refreshed to
show only those that would be used to
determine solutions.
• When you are satisfied with your selection,
click on the Next button.
• If the Cancel button is selected,
MiningSolveTM will exit this dialog box and
cancel any changes that were made.
TM
26
Reference Manual: dialog boxes
4. Rules Wizard Step 3: Build Mirrored Database
In this step, the database that will be used for the
analysis is selected and imported.
To open a database, select the Add button. An Open
File dialog will appear. Select a file and click on the
Open button, and it will be imported into
MiningSolveTM.
If a database name was already selected for the current
rules file, but has the wrong path or file name, use the
Remove button to delete the name and reselect it.
• To select the variables to be used from a database,
highlight the database name on the wizard screen. The
available variables will appear in the Source Fields box.
Use the mouse to highlight any number of fields from
the Source Fields box, then click on the arrow to move
the fields to the Mirrored fields box. The mirrored
fields are those that will be included in the data mining
execution. If, as in this example, N and I fields are
being used, there should be at least two I and one N
mirrored fields.
• To select fields from a different database, highlight the
database name, and select the fields to mirror.
• Select the Next box to move on to the next screen.
TM
27
Reference Manual: dialog boxes
5. Rules Wizard Step 4: Select Variables
Once the variables from all of the databases
have been selected, the fields are divided into
predictor and predicted fields.
Use the mouse to select the variables in the
Mirrored fields box, then use the arrows to
move the fields to either the “Fields to
predict” or the “Fields to be used in
prediction” boxes.
Only N or O variables should be used as
fields to predict. Any variable type can be a
predictor.
There should only be one field to predict, and
at least two predictor variables.
When the desired fields have been selected,
click on the Next button.
TM
28
Reference Manual: dialog boxes
6. Rules Wizard Step 5: Recommended Approaches
There may be some data fields that are not
compatible with an algorithm that will be used in
the analysis. This step allows the user to choose
how MiningSolveTM will handle the incompatible
fields. There are three options for handling this
data:
– The first option leaves the incompatible
data field out of the particular method for
which it is inappropriate.
– The second option attempts to use all of the
selected data fields. Data that is not
compatible with a specific method will be
recoded (i.e. a continuous variable will be
transformed using exponents to be used as a
discrete variable).
– The third option eliminates the analysis
method, rather than the data field, if there is
incompatible data.
Use the mouse to select the option by clicking on it,
then select the Next button.
TM
29
Reference Manual: dialog boxes
7. Rules Wizard Step 6: Select Cases for Inclusion
The data file can be filtered based on segment
variables. Multiple segments can be selected so
that for example, only people with a loan account
who have been with the bank for more than 10
years are included in the run.
Missing data is data that is either system missing
or marked as missing in SPSS. Select one of the
options to change how missing data is handled by
MiningSolveTM.
Missing data can be handled differently for
discrete or continuous variables.
If segments have been selected, the Working File
Size reflects the number of cases included in the
selected segments. Use the slider to change the
selected number of cases to use from the working
data file and for the holdback sample.
TM
30
Reference Manual: dialog boxes
8. Rules Wizard Step 7: Define Parameters
All of the methods and criteria used for the
analysis can be customized using this dialog.
Select one of the Data Mining Methods to
customize the options for that method. Use
the advanced button at the bottom to set
specific exponent parameters or change the
order of the methods to be used within each
algorithm.
The number of SPSS scripts to be generated
given the current settings is displayed at the
bottom of the dialog. A random selection of
these possible scripts can be selected to be run
by checking the “Cutoff at” box and entering
a number of scripts to be run.
TM
31
Reference Manual: dialog boxes
9. Rules Wizard Step 8: Define Output
Syntax and Output files that are saved are
saved in the working directory specified in
Step 9 of the wizard. A folder is created in
the working directory for each of the selected
methods, and the syntax and output files are
saved in the subdirectories.
The runtime statistics are saved in a CSV file
in the working directory.
TM
32
Reference Manual: dialog boxes
10. Rules Wizard Step 9: Closure
The rules internal name is not a file name, but
a reference for the rules file that is used
within MiningSolveTM and used for a run
title. The rules internal name and description
are optional.
The working directory specifies where all of
the output from the runs will be saved.
TM
33