1
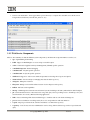
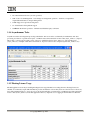
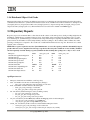
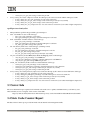
JazzMon Server Monitor
User Manual
Version 1.4.0
December 17, 2012
IBM Rational Performance Engineering Team: Dave Schlegel
1 Introduction...................................................................................................................................................................... 3
1.1 Supported Platforms ............................................................................................................................................................ 3
1.2 Download Site/Installation .................................................................................................................................................. 3
1.3 Getting Help ........................................................................................................................................................................ 3
1.4 Server Tuning References ................................................................................................................................................... 3
2 Data Collection/Processing.............................................................................................................................................. 4
2.1 Running JazzMon................................................................................................................................................................ 4
2.2 Command: Monitor ............................................................................................................................................................. 4
2.3 Command: Gather ............................................................................................................................................................... 5
2.4 Command: Analyze ............................................................................................................................................................. 5
2.4.1 Cluster Node Data Aggregation................................................................................................................................... 6
2.5 Command: Baseline............................................................................................................................................................. 7
2.6 Command: Password ........................................................................................................................................................... 7
2.7 Command: Version.............................................................................................................................................................. 7
3. Jazz Performance Data................................................................................................................................................... 8
3.1 Web Service Counter Reports ............................................................................................................................................. 8
3.1.1 What is a Web Service? ............................................................................................................................................... 8
3.1.2 Web Services ............................................................................................................................................................... 9
3.1.3 Web Service Components.......................................................................................................................................... 10
3.1.4 Asynchronous Tasks .................................................................................................................................................. 11
3.1.5 Floating License Usage.............................................................................................................................................. 11
3.1.6 Distributed Object Grid Cache .................................................................................................................................. 12
3.2 Repository Reports ............................................................................................................................................................ 12
3.3 Server Info......................................................................................................................................................................... 13
3.4 State Cache Counter Report .............................................................................................................................................. 13
4. Visualizing Data ............................................................................................................................................................ 14
4.1 Charting using the JazzMon_Visualizer ............................................................................................................................ 14
4.2 Charting Manually............................................................................................................................................................. 16
4.2.1 Reading CSV Files .................................................................................................................................................... 16
4.2.2 Basic Charting ........................................................................................................................................................... 16
4.2.3 Combining data sets (optional) .................................................................................................................................. 19
4.3 Working with Data Tables and Charts............................................................................................................................... 21
4.3.1 Basic Table Structure................................................................................................................................................. 21
4.3.2 Sorting ....................................................................................................................................................................... 22
4.3.3 Filtering ..................................................................................................................................................................... 23
4.4 Reporting Gaps during monitoring.................................................................................................................................... 23
5. Interpreting Results ...................................................................................................................................................... 25
5.1 Overall Totals (Top Level workbook) ............................................................................................................................... 25
5.2 Floating License Usage (license_flVal in jts application) ................................................................................................. 26
5.3 Component Summaries ..................................................................................................................................................... 27
© Copyright IBM Corp. 2012
1 of 32
5.4 Web Service Traffic Details .............................................................................................................................................. 28
5.4.1 Average Response Time (service_etAvg) ................................................................................................................. 28
5.4.2 Counts (service_etCnt) .............................................................................................................................................. 30
5.4.3 Total Time (service_etTot) ........................................................................................................................................ 31
5.5 Asynchronous Tasks (async_etTot)................................................................................................................................... 32
© Copyright IBM Corp. 2012
2 of 32
1 Introduction
The JazzMon server monitor package collects, gathers and analyzes Jazz Server performance data, allowing for analysis of
trends over time and comparison between separate monitor sessions/runs. For an overview, see “JazzMon - Seeing what your
server is up to” (https://jazz.net/library/article/822).
To get started using JazzMon right away, see the new JazzMonQuickStart one-page guide in the install directory and
refer back to this manual as needed.
JazzMon provides a runnable Java jar file that collects performance snapshots from one or more Jazz servers over a period of
time then post-processes the data to produce time-trend tables that can be used to investigate and visualize how well a server is
performing.
Note: JazzMon supports the use of baselines to provide a way to compare newly gathered data against an earlier time
period or a different server site to provide some context for data interpretation. They put the new data in context to
help differentiate what seems “normal” versus “interestingly different” but must be used with caution; there is no right
set of numbers that all servers will match all the time. Response times and activity vary based on many variables –
time of day, number of users, other activities, etc. Comparing performance between sites can be interesting but
misleading; comparing current performance against an earlier baseline from the same server can be much more
meaningful.
This manual describes how to install and use the JazzMon package, providing a brief overview of captured data and illustrating
how to interpret and visualize this data to gain insights into Jazz server performance.
1.1 Supported Platforms
Operating Systems: Windows Server (2008, 2003), Windows XP, Windows 7; Red Hat Enterprise Linux 5.x, Debian
Rational Products Compatible with Rational Team Concert and other Jazz based products at version 2.0.1 GA and above
1.2 Download Site/Installation
JazzMon is available as a zip archive at https://jazz.net/wiki/bin/view/Main/JazzMon.
Download and unzip the archive to a local working directory. The package includes a standalone Java jar executable,
documentation, release notes, and sample baseline data.
1.3 Getting Help
The JazzMon software is provided by the Rational Performance Engineering Team. Please ask support questions on the
Jazz.net forums (https://jazz.net/forum) , using the tag jazzmon.
1.4 Server Tuning References
JazzMon helps to visualize actual server performance but doesn’t tell you how to improve performance. For more information
on how to properly tune a Jazz server see the following articles.
•
Tuning the Rational Team Concert 4.0 server: https://jazz.net/library/article/1029
•
Collaborative Lifecycle Management 2012 Sizing Guide: https://jazz.net/library/article/814
© Copyright IBM Corp. 2012
3 of 32
2 Data Collection/Processing
To get started using JazzMon right away, see the new JazzMonQuickStart one-page guide in the install directory and
refer back to this manual as needed.
2.1 Running JazzMon
JazzMon is a runnable jar file that you run from the command line.
java –jar JazzMon.jar
You must have a version of Java already installed to launch the jar file. If needed, you can use the version of Java that is
packaged with the RTC Client under jazz\client\eclipse\jdk\jre\bin; for JazzMon for RTC 3.0 and above, use Java 1.6 or later;
for JazzMon for 2.0.0.2, use Java 1.5 or above. Use “java –version” to check your java version.
Without arguments it provides a basic help message:
java -jar JazzMon.jar <command> [file=propertyFile] [<property>=<value> …]
where command is one of the following:
monitor
gather
analyze
baseline
password
version
# Start monitoring one or more servers
# Collect copy of data into permanent location
# Analyze data to produce time-trend tables for visualization
# Create new baseline from a pair of monitor snapshots
# Prompt for password and show obfuscated equivalent
# Display JazzMon version
The basic order of operations is to run monitor for some period, analyze the data to generate trend CSV files, and then visualize
the CSV files as Excel or Symphony charts and tables. NOTE: By default, JazzMon will perform analysis-in-place, monitoring
to get the data then automatically analyzing the data when finished; if this is not enabled, you will need to run the gather
command in between monitor and analyze.
You control what the command does by providing a set of properties that identify what server(s) to monitor, provide login
information, how long to run, and so forth. These properties are provided in a property file but can also be set from the
command line when appropriate. By default, JazzMon looks in the local directory for jm.properties; other locations can be
specified using the file command line option.
A simple default version of jm.properties is provided and requires only the URL(s) of the server(s) you want to monitor and
your login information. If you need to use more advanced properties, see jmTemplate.properties and either cut and paste out
snippets you need or make a full copy to use as your jm.properties file.
So for example, let’s say you use a different property file name, jmTest1.properties and want to provide your password from
the command line to keep it separate (it’s only needed by the monitor command) then you would type this:
java –jar JazzMon.jar monitor file=jmTest1.properties SEQ_PASSWORD=myPass
java –jar JazzMon.jar gather file=jmTest1.properties
java –jar JazzMon.jar analyze file=jmTest1.properties
2.2 Command: Monitor
The monitor command collects web service counter reports and optionally repository reports from one or more server
applications or hosts (see chapter 3 for more information). The reports are collected in a run output directory under separate
© Copyright IBM Corp. 2012
4 of 32
subdirectories for each URL. The output directory defaults to c:\temp\JazzMonRuntime (Windows) or
/var/tmp/JazzMonRuntime (Linux)) but can be modified by changing the PATH_OUTPUT_DIR property. This allows you to
monitor different sets of servers simultaneously or to keep different runs separate. You will be asked for permission before
existing output is overwritten.
Unless analysis-in-place is disabled, JazzMon will automatically perform the analyze step when monitoring is complete.
This command requires the following properties to be set:
•
SERVER_URL_LIST is a comma separated list (no spaces) of one or more server URL’s to monitor. You may
monitor different server hosts or multiple application servers on the same server, i.e.
myhost:9443/ccm,myhost:9443/jts
•
SEQ_USERNAME is the user name for logging into the server(s). If the supplied user is an administrator on the
target system, it is also possible to monitor the size and growth of the repository by enabling repository reports with
the RUN_REPO_REPORTS property.
•
SEQ_PASSWORD is the user’s password. If set to <prompt> then the user will be prompted each time (default). If
provided in the properties file, the password can be provided in either clear text or obfuscated form (see Command:
Password section below). It is up to the user to maintain password security.
Other properties that can be adjusted include the following:
•
SEQ_RUN_LENGTH_ARG (default 7d) controls how long the monitor will run. Server data collected over a period
of time will provide a better idea of the ebb and flow of traffic over a week. Its values can either be the number of
iterations to run (i.e. 8 for 8 snapshots), or a time duration, such as “8h” for “8 hours” or “7d” for “7 days”.
•
PARM_COUNTER_RATE_MINS (default 60 minute) controls how often data samples are taken.
•
RUN_REPO_REPORTS (off by default) enables gathering detailed repository content reports; the login user must
been an Administrator for these reports. PARM_REPOREPORT_RATE_MINS controls how often those reports
are taken (480 minutes (8 hours) by default); in larger repositories these reports may run 30 minutes or more.
2.3 Command: Gather
This step is not needed as long as analysis-in-place is enabled.
The gather command copies the collected data from the monitoring output directory to a more permanent location which will
also contain the analysis data generated in the next step.
There are no required properties for gather. By default it will copy the data from the PATH_OUTPUT_DIR to
<temp>/JazzMonData/run0. If you want to save the data in a better location, provide the following properties:
•
•
•
ROOT_NETWORK_SHARED_DIR_LINUX is the main storage path for Linux platforms. The default is
<temp>/JazzMonData.
ROOT_NETWORK_SHARED_DIR_WINDOWS is the main storage path for Windows platforms
RUN_ID is the subdirectory within the destination area, by default “run0”.
Gathering data provides a snapshot of the data for the analyze command to produce time-trend tables from. You can run gather
at any time while monitor is running or after it is completed.
2.4 Command: Analyze
The analyze command post-processes the data to produce a series of time-trend charts focusing on individual variables in the
web service counter reports (number of operations, average response time, etc) over time. It creates comma separated text files
© Copyright IBM Corp. 2012
5 of 32
(.csv) where each report snapshot is a column in the table. These reports can then be manipulated in Microsoft Excel or Lotus
Symphony to filter and visualize the data to put the reports in context. The next chapters provide more information on how to
work with the analysis output. This step is automatically performed when monitoring is completed, unless analysis-in-place is
disabled. You can use the analyze command to see intermediate results while monitoring is still running or to reanalyze the
data if it wasn’t completed for any reason.
The analyze command properties are set to reasonable default values but can be adjusted as appropriate:
• ANALYSIS_DATADIR is baseline data location, by default the Data directory within the JazzMon installation.
• ANALYSIS_BASELINE is the name of a baseline set within ANALYSIS_DATADIR. If you don’t want any baseline
comparison, set ANALYSIS_BASELINE to nothing (ANALYSIS_BASELINE=). The baseline set has one or more
files providing baselines for one or more server types (ccm, jts, etc). The default is a weekday Jazz.net baseline.
• ANALYSIS_SAMPLE_TIME allows analyze to skip intermediate data samples if desired. For example, if you collect
hourly data for 30 days you may only want to see the data on a daily basis, set ANALYSIS_SAMPLE_TIME to 1440
minutes (24*60). NOTE: This parameter is also applied to adjusting the baseline data to the right proportions.
• ANALYSIS_AGGREGATE_LIST provides a list of application suffixes that guide how to aggregate cluster node
data together into a cluster wide report. Clusters should be monitored by monitoring each application on their
individual nodes then enabling aggregation allows true cluster-wide reports to be computed.
• ANALYSIS_AGGREGATE_ZERO_BASIS enables a mode that deducts the initial web services report counts and
totals before calculating output in order to simulate restarting the server.
• ANALYSIS_CLUSTER enables generating trend and total tables from Distributed Object Grid data when available.
• ANALYSIS_EURO_LOCALE enables reversing comma and periods from locals using commas as decimal points.
• ANALYSIS_TARGET (default “Excel”) specifies the anticipated spreadsheet application that will read in the data to
adjust formulas included in the output. For IBM Lotus Symphony, specify “Symphony” (no quotes, case insensitive).
• ANALYSIS_IN_PLACE (default true) If enabled, automatically analyze data in original monitor output directory
without need to gather
2.4.1 Cluster Node Data Aggregation
When JazzMon is used to monitor a server cluster, it needs to monitor the individual nodes separately and then aggregate
(combine) the data from the nodes to get an accurate picture of the overall cluster. Using web service reports from the load
balancer front end used for most operations will collect a random jumble of reports from the individual nodes that are not
meaningful in most situations. For example this is how you would monitor two applications on a two node cluster.
SERVER_URL_LIST=bluesws01.torolab.ibm.com:9443/jazz,bluesws01.torolab.ibm.com:9443/jts,\
bluesws02.torolab.ibm.com:9443/jazz,bluesws02.torolab.ibm.com:9443/jts
Aggregation is enabled using the ANALYSIS_AGGREGATE_LIST of application suffixes as follows:
ANALYSIS_AGGREGATE_LIST=jazz,jts
When node data is aggregated (reports from different nodes are merged to make a cluster wide report) there are some
adjustments made in order to combine the data:
• Averages are computed based on dividing total time between reports by the total counts between reports to get a
weighted average for the overall cluster.
• Standard Deviations are NOT aggregated correctly at this time, but until there is proper support for this, the maximum
of the standard deviations will be shown. This value is taken from the node which had the highest standard deviation
and that it is not suitable for statistical tests because it does not represent the standard deviation of the aggregated
population of samples.
© Copyright IBM Corp. 2012
6 of 32
2.5 Command: Baseline
Baselines provide a way to for the analyze operation to compare data against an earlier time period or a different server site to
provide some context for data interpretation. They put the new data in context to help differentiate what seems “normal” versus
“interestingly different” but must be used with caution; there is no right set of numbers that all servers will match all the time.
Response times and activity vary based on many variables – time of day, number of users, other activities, etc. But using
baselines helps to isolate where performance or traffic are dramatically different and worth further investigation. Each baseline
file identifies what server it is from (ccm, jts, etc) and includes the sampling duration in the filename to allow hourly rates to be
computed but also as a guide to what sort of period the data represents – an 8 hour stretch during the daytime, a 24 hour day
showing night activity and maintenance jobs, a full week including weekends, etc.
The baseline command creates a new set of baseline files from monitor output data using the same source data location as the
analyze command. In addition it takes two properties:
•
ANALYSIS_DATA_RANGE=<start>,<end> provides the suffix numbers of the data snapshots to use. The
baseline(s) will be the difference between these two snapshots. “10,18” compares CounterContentServer10.html to
CounterContentServer18.html and marks it as an 8 hour snapshot. The comma separated list can’t have any spaces.
•
ANALYSIS_OUTPUT_DIR=<directory> identifies where the baseline files should be written. The default is the
current ANALYSIS_DATA_DIR/NewBaseline (see Section 2.4)
Each server subdirectory under the source data will be turned into a new baseline file with the server name and a user/time
suffix in the format <name>.<app>__<N>users_<H>hrs.txt. If you know the number of users, rename this filename to reflect
that but the user count is not currently used. The <H> value is used to divide the baseline by the number of hours to get an
hourly average.
Example: In the default 8 hour baseline, “jazz.ccm__200users_8hrs.txt”, the site name is jazz (i.e. jazz.net), the application is
ccm, and then after the double underbar (__), it specifies 200 users and 8 hours.
When a new baseline is created the initial filenames contain the last part of the server URL that was being monitored as part of
the name. The <name> part can be edited but the <app> pattern is needed (i.e. jts, ccm, etc) to identify which baseline should
be used for data being compared to it. If there is a mismatch between the <app> name generated from one set of source data
and the “app” suffix in target data being analyzed later, make adjustments, i.e. if you make an RTC SCM baseline from one
server with an app suffix of “.ccm” but want to compare it to another RTC SCM server using the “.jazz” suffix, just make
another copy of the file containing “.ccm” in the name with “.jazz” instead.
To use the new baseline set, copy the new output directory to your ANALYSIS_DATADIR directory if needed and modify the
ANALYSIS_BASELINE property to use the new baseline set name for subsequent analyses.
2.6 Command: Password
The password command will prompt the user for their password then print out an obfuscated version of the password that can
be used in the properties file. Password entry masking is not supported due to current Java limitations. It is up to the user to
maintain password security.
2.7 Command: Version
The version command just displays the current JazzMon version number for reference with support issues or feature content.
© Copyright IBM Corp. 2012
7 of 32
3. Jazz Performance Data
JazzMon collects data from one or more Jazz-based servers by saving a combination of repeated snapshots of some reports
(web service counter reports, optional repository reports) and one time snapshots of others (server overview and state cache
report). This chapter provides a basic description of the information being collected.
3.1 Web Service Counter Reports
Web service reports provide a wealth of information about historical traffic and performance information for the application
server. The basic report is available to any user by visiting the following URL on the target server.
https://<yourhost>:9443/<app>/service/com.ibm.team.repository.service.internal.counters.ICounterContentService
The port (9443) may vary. There are two key tables in this report that JazzMon analyzes – web services, asynchronous tasks –
and two additional tables that it analyzes when they are available – floating license usage and distributed object grid caching
for clusters.
3.1.1 What is a Web Service?
A web service is a low level individual request sent to the Jazz server. Multiple web services are often needed to carry out an
individual user operation such as logging in, checking in a change set, updating a work item, or downloading a file. The best
way to understand what web services do and how they are used is to enable the Metronome feature on the RTC Eclipse client
which tracks and reports on what web services have been executed by the individual client. (For more information see
https://jazz.net/blog/index.php/2008/02/01/the-jazz-metronome-tool-keeps-us-honest/).
You can enable the Metronome feature by visiting the Window/Preferences user interface and selecting “Show traffic
statistics” as shown above and then use the Metronome icon at the bottom of the client to view and manage the data. The
resulting report will record the web service traffic generated by this individual client in performing whatever operation you do.
© Copyright IBM Corp. 2012
8 of 32
For example, checking in a few files produced the output above
The web service counter names are related to the names shown above, i.e. the fetchOrRefreshItems web service has a full
name of com.ibm.team.repository.common.internal.IRepositoryRemoteService.fetchOrRefreshItems. Using Metronome
you can relate which user operations call which web services. For the web browser client, using a product like Firebug will let
you see the direct traffic as well.
Keep in mind that the web service reports show how much time the server required to perform the operation; Metronome data
also includes the round-trip time between the client and server. If the server time is relatively small, the difference between the
two may represent excessive network latency, which may be the real cause of perceived performance problems.
It is also important to realize that some web services are used extensively by multiple components of the system and don’t just
support specific use cases, i.e. com.ibm.team.repository.common.service.IQueryService.queryItems is used by many
operations.
3.1.2 Web Services
Each web service provides three groups of data values covering elapsed time (“et”), bytes sent or downloaded to clients (“bs”),
and bytes received or uploaded from clients (“br”).
JazzMon produces a series of time-trends extracted from this table (shown below), computed for each server URL being
monitored.
•
•
Service trend tables – time-trend tables by individual web services for each interval:
o
service_etAvg.csv: has elapsed time averages in seconds
o
service_etCnt.csv: has the number of times (counts) that a web service is called
o
service_etTot.csv: has the total elapsed time spent per web service in seconds (etCnt * etAvg = etTot)
o
service_bsTot.csv: bytes sent totals
o
service_brTot.csv: bytes received totals
Component trends – time-trend tables aggregated by system component, based on the web service name, i.e.
com.ibm.team.build.internal.common.ITeamBuildService.getBuildEngine() is in the build component of the server.
© Copyright IBM Corp. 2012
9 of 32
•
Service totals trend tables – these appear in the top level directory to compare the total traffic across all the servers
being monitored in the run (serviceTotals_etCnt.csv, etc)
3.1.3 Web Service Components
This is a short summary of what the different system components (com.ibm.team.<component Name>.<service>) do:
•
apt - Agile Planning and Tracking
•
build - Support for Build Engines to access and process build requests
•
calm - Collaborative Application Lifecycle Management (C/ALM) specific operations
•
com.ibm.debug.team - internal debugging
•
com.ibm.teami - I-System specific operations
•
com.ibm.teamz - Z-System specific operations
•
dashboard - Support for web browser dashboard presentations showing mix of reports and queries
•
datawarehouse - Services unique to managing meta-data about the repository
•
enterprise - Enterprise extensions
•
filesystem - Manage versioned file artifacts between local workspaces and repository
•
fulltext - Full text search capabilities
•
interop - SCM integrations between Jazz and external systems, including work item synchronization with ClearQuest
•
jfs – Jazz Foundation Services - Resource based storage and query services providing access to the JFS repository and
user information, also used by JFS-based fronting applications
•
links - Access and manage links between different types of artifacts such as work items and change sets
•
process - Process definition controlling activity flow, roles, and permissions with customization
•
reports - Reports provide data about activities and artifacts over time in the repository
•
repository - User, license, and server administration services along with modeled storage services for persistent and
query
© Copyright IBM Corp. 2012
10 of 32
•
rtc – Rational Team Concert (one lone operation)
•
scm – Source Code Management - basic change set management operations – check ins, accept/deliver,
suspend/discard/resume, workspace management
•
social - Support for Open Social integration
•
vs - Visual Studio client platform support
•
workitem – Work item operations - define/create/edit/delete/query work items
3.1.4 Asynchronous Tasks
Asynchronous tasks are background processing tasks that the Jazz server carries out internally for maintenance and other
processing not related to a specific user request. JazzMon creates time-trend tables for the counts (async_etCnt.csv (“elapsed
time Count”)), average response times (async_etAvg.csv), standard deviation (async_etDev.csv), and total time spent
(async_etTot.csv). A sample of this table is shown below. Top level totals are also computed (asyncTotals_etCnt.csv, etc)
3.1.5 Floating License Usage
The JTS application server may be tracking Floating License usage information recording when new floating licenses are
checked out or when they expire. This information provides an indication of how many users are active but does not show any
users with permanent licenses so don’t rely on it as an absolute indication of current usage. JazzMon creates time-trend tables
for the counts (licence_flVal.csv) in the JTS application directory output but does not aggregate the information at this time.
© Copyright IBM Corp. 2012
11 of 32
3.1.6 Distributed Object Grid Cache
When Jazz 4.0 products are clustered, an additional report may be produced that provides information about the Object Grid
communications traffic used to synchronize information between nodes. JazzMon creates time-trend tables for attempted count
(objectgrid_atCnt.csv), elapsed (successful) count (objectgrid_etCnt.csv), elapsed average time (objectgrid_etAvg.csv) and
elapsed total time (objectgrid_etTot.csv). This information is best reviewed in consultation with IBM support.
3.2 Repository Reports
Repository reports use an internal API to collect data about the contents of the Jazz repository itself, providing insight into the
distribution of different types of artifacts in the repository, based either on the component level (repoReport.x.txt) or, in the
more detailed report, by individual types of artifacts in the component namespace (repoReport.itemized.txt). The columns of
greatest interest are the number of items (unique artifacts) and states (changes to those artifacts). Other columns show what
percentage a namespace is compared to the overall total or additional information about storage size. Shown below is a small
segment of the overall table.
NOTE: These reports require the user have Jazz Administrator access to the repository and take substantially longer to
produce than web service snapshots. In some larger repositories these may take a half hour or more and they should be
run less frequently. Consider having a separate JazzMon run that is taking these perhaps once a day or once a week.
namespace
com.ibm.team.applicationmigration
com.ibm.team.apt
com.ibm.team.apt.plansnapshot
com.ibm.team.apt.resource
com.ibm.team.apt.snapshot
com.ibm.team.build
com.ibm.team.compatibilitypack
com.ibm.team.dashboard
com.ibm.team.diagnostictests
states
0
4
0
0
0
182503
212
0
13
states_prct_total
0.0
0.0
0.0
0.0
0.0
12.0
0.0
0.0
0.0
items
0
4
0
0
0
180947
108
0
13
items_prct_total
0.0
0.0
0.0
0.0
0.0
15.7
0.0
0.0
0.0
repoReport.<n>.txt
•
•
•
•
•
•
namespace: functional area within the overall repository
states: total number of item states for this namespace (changes)
o states_prct_total: namespace states percentage of total states
items: total number of distinct items for this namespace
o items_prct_total: percentage of total items
o ave_states_per_items: average states per item
size: size taken by all this namespaces states (excluding content)
o size_prct_total: percentage of total size
o size_ave_per_state: average size per state
o size_ave_per_item: average state size per item
orm_size: size taken by all the ORM (Object Relational Mapping) tables for this namespace
o orm_size_prct_total: percentage of total ORM size
o orm_size_ave_per_item: average ORM size per item
content_size: size taken by all the content associated with this namespace's items
o content_size_prct_total: percentage of total content size
o content_size_ave_per_state: average content size per state [not very useful]
© Copyright IBM Corp. 2012
12 of 32
•
o content_size_ave_per_item: average content size per item
stored_content_size: actual compressed content size taken up by all content associated with this namespace's items
o stored_content_size_prct_total: percentage of total stored content size
o stored_content_size_ave_per_state: average stored content size per state [not very useful]
o stored_content_size_ave_per_item: average stored content size per item
o stored_content_size_ave_compression: ratio of stored content to content size (lower value = higher compression)
repoReport.<n>.itemized.txt
•
•
•
•
•
•
•
namespace#item: specific item type within a given namespace
states: total number of states of this item type
o states_prct_total: percentage of total states
o states_prct_namespace: percentage of just this namespace's total states
items: total number of distinct instances of this item type
o items_prct_total: percentage of total items
o items_prct_namespace: percentage of just this namespace's total items
o ave_states_per_items: average states per item
size: size taken by all the states of this item type (excluding content)
o size_prct_total: percentage of total size
o size_prct_namespace: percentage of just this namespace's total size
o size_ave_per_state: average size per state
o size_ave_per_item: average state size per item [not very useful]
orm_size: size taken by all the ORM (Object Relational Mapping) tables of the item type
o orm_size_prct_total: percentage of total ORM size
o orm_size_prct_namespace: percentage of just this namespace's total ORM size
o orm_size_ave_per_item: average ORM size per item
content_size: size taken by all the content associated with items of this type
o content_size_prct_total: percentage of total content size
o content_size_prct_namespace: percentage of just this namespace's total content size
o content_size_ave_per_state: average content size per state [not very useful]
o content_size_ave_per_item: average content size per item
stored_content_size: actual persisted (compressed) content size taken up by all content associated with items of this type
o stored_content_prct_total: percentage of total stored content size
o stored_content_prct_namespace: percentage of just this namespace's total stored content size
o stored_content_ave_per_state: average stored content size per state [not very useful]
o stored_content_ave_per_item: average stored content size per item
o stored_content_ave_compression: ratio of stored content to content size (lower value means higher compression)
3.3 Server Info
The server information report captures basic information about the server - uptime, maximum memory, total memory, Java
VM, Jazz build, etc. It is a snapshot of the contents of this URL:
https://<yourhost>:9443/jazz/service/com.ibm.team.repository.service.internal.IServerStatusRestService/ServerInfo
3.4 State Cache Counter Report
The State Cache Counter report provides information about internal cache management traffic.
© Copyright IBM Corp. 2012
13 of 32
4. Visualizing Data
Each time-trend file displays one variable from the web service counter reports as a series of columns as the value changes over
time.
•
To work with the data in Microsoft Excel use the JazzMon_Visualizer macro file in the installation directory.
•
To work with the data in Lotus Symphony read the comma separated CSV files as spreadsheets for filtering,
visualization, and analysis. Note: If using Lotus Symphony adjust ANALYSIS_TARGET property to avoid formula
error (ANALYSIS_TARGET=symphony).
These examples demonstrate Excel using a data set created by monitoring and analyzing the target server for four days.
4.1 Charting using the JazzMon_Visualizer
The JazzMon_Visualizer is an Excel workbook that provides macros to automatically read in most of the analyzer CSV files
and turn them in to charts automatically.
Follow the instructions on the Summary page:
1.
2.
Run Jazzmon to monitor and analyze your data. See the JazzMonQuickStart one-page.
Read in JazzMon_Visualizer.xls and enable macros. You will either be prompted for whether to enable macros or
not, or you may see a banner at the top telling you macros are disabled until you click a button to enable them. Some
sites may hide this option by default for their employees. If you have trouble talk to your local administrator.
© Copyright IBM Corp. 2012
14 of 32
3.
4.
5.
Select the location of your data. Press the Browse for FolderName button or type in the path to your analyzed data.
Select any .CSV file or the servermonitor.txt file to pick the directory.
Adjust the output properties. These allow you to adjust the titles used in charts, how many of the top N rows will be
included, select the output file name and folder locations, select a sub range of data to chart and other chart options.
Press the “Create Workbooks” button to create a series of workbooks
• The initial work book you see is the top level totals, comparing overall traffic between the different servers,
applications, or cluster nodes. This will have hyperlinks to the individual servers or application workbooks
• Each server or application will have its own workbook with links back to the top level workbook to allow
navigation across the data. The name is based on the OutputFileName and the subdirectory name.
• In each work book, the Table of Contents page provides links to the different data table tables tabs in the current
spreadsheet. The top left cell in each table provides a hyperlink back to the Table of Contents to assist in
navigation. For each data table tab, the preceding tab is the corresponding chart.
• Workbooks are output to the same folder based on the OutputDirName, allowing you to zip up all the workbooks
to facilitate sharing with other team members.
• NOTE: Pressing the Create Workbooks button will automatically close any conflicting spreadsheet files
with the same name that are already open. Make sure to save any work you want to save or to change the
OutputFileName or OutputDirName parameters to avoid overwriting work you want to keep.
Once you have the results you want, skip to section 4.3 for more information for how to interact with the data.
© Copyright IBM Corp. 2012
15 of 32
4.2 Charting Manually
4.2.1 Reading CSV Files
The best files to start with depends on what performance issues are already known but these are good starting points
•
service_etTot.csv – helps identify which web services take the most total elapsed time and represents count multiplied
by average
•
service_etCnt.csv – helps identify volume of traffic (counts) to find the most frequently called operations
•
service_etAvg.csv – isolates the average response times for web services, computed to show the average per analysis
sample time interval (totalTimePerInterval / countsPerInteral) instead of relying on the server’s original running
average. The interval average helps identify poor performance at specific times of day.
In Excel:
•
File/Open, navigate to the file (c:\temp\JazzMonData\run0\<host>\service_etAvg.csv). You will need to change “Files
of type” to select “Text Files (*.prn,*.txt,*.csv)” to see the .csv files produced by JazzMon.
•
Adjust the column widths for readability: select all (control-A) and then double click the bar between the A and B
column headings to auto size all columns
•
Split the window pane to make it easier to work with large spreadsheets
o
grab the little rectangle at the right end of the horizontal scroll bar and drag it between the B and C columns
o
grab the rectangle at the top of the vertical scroll bar and drag it between rows 1 and 2)
o
scroll the right pane to see the right end of the rows
You can optionally format formula results for better readability: select each column, click mouse-right and “Format Cells”.
• Totals works best as “Number” format, thousands separator, and no decimal places
• Max and Avg work best as “Number” format, thousands separator and 3 decimal places
• Avg/Baseline works best as “Percentage” format, 2 decimal places
4.2.2 Basic Charting
Using this sorted spreadsheet, you can create a chart using the Chart Wizard
•
•
Select the entire data set by once again clicking the corner box.
From the main menu click on the Chart Wizard (looks like a column chart)
© Copyright IBM Corp. 2012
16 of 32
•
•
Step 1: In the Chart Wizard select Chart Type “Line” and then hit Next
Step 2: Reduce the data range to the top 20 web services by changing the last number in the Data Range (i.e.
$CW$320 becomes $CS$20). Given the wide value scale later rows may not show on the chart and earlier
versions of Excel have a 255 column limit. Then select “Series in:” value of “Rows and hit Next.
o Sometimes the X-axis at the bottom shows numbers instead of dates/times. To fix this select the Series
tab in Step2. If the first row (Counter(<field>) shows up in the Series list, remove it and select the first
row to be the Category(x) axis labels as shown below
© Copyright IBM Corp. 2012
17 of 32
Step 3: Type in a Chart Title and axis labels if desired.
o In some cases the data may stack up vertically like towers. If this occurs, check the Axis tab in Step 3
and change Category(x) axis to use Category instead of Automatic.
Step 4: Set Chart Location as new sheet (worksheet in spreadsheet). Hit Finish.
•
•
Average Reponse Time
3500
filesystem.common.IFilesystemService.getFil
eTreeByVersionable3
scm.common.IScmService.getHistoryForVer
sionable
scm.common.IScmService.acceptCombined
apt.internal.service.rest.IPlanRestService.get
PlanSearchResults2
scm.common.IScmService.updateCompone
nts2
process.internal.service.web.IProcessWebUI
Service.getContributors
filesystem.common.IFilesystemService.comp
areWorkspaces
scm.common.IScmService.batchCommit
3000
2500
2000
scm.common.IScmService.suspend
1500
filesystem.common.IFilesystemService.getBl
ameWS
scm.common.IScmService.resume
1000
scm.common.IScmService.discardChangeS
ets
scm.common.IScmService.deliverCombined
500
1/
16 jaz
z
/
1/ 201 .jaz
16 2
z
/2 14
1/ 012 :46
17
/ 19
1 / 2 0 1 :4 6
17 2
1/ /20 0:4
17 1
2 6
/
1/ 201 5:4
17 2
6
1
/
1/ 201 0:4
17 2
6
/2 16
1/ 012 :46
18
/ 21
1 / 2 0 1 :4 6
18 2
1/ /20 2:4
18 1
2 6
/
1/ 201 7:4
18 2
6
1
/
1/ 201 2:4
18 2
6
/2 17
1/ 012 :46
19
/ 22
1 / 2 0 1 :4 6
19 2
1/ /20 3:4
19 1
2 6
/
1/ 201 8:4
19 2
6
1
/
1/ 201 3:4
19 2
6
/2 18
1/ 012 :46
20
/ 23
1 / 2 0 1 :4 6
20 2
/2 4:
01 46
2
9:
46
0
scm.common.IScmService.updateCompone
nts
scm.common.IScmService.createWorkspac
e
filesystem.common.IFilesystemService.getFil
eTreeByVersionable4
reports.service.rest.internal.service.IReporta
bleService.GET
scm.common.IScmService.accept
This produces a chart of the average response time over the 4 day period that looks like the chart above. By hovering over
individual lines you can query which web service and what time slice you are looking at.
© Copyright IBM Corp. 2012
18 of 32
4.2.3 Combining data sets (optional)
Sometimes you may want to combine the data from different tables, perhaps looking at average response times sorted by
counts so you can look at the average times of those operations called most frequently. One way to do this is to cut and paste
the average counts column from service_etCnt.csv and paste it into the average response time spreadsheet.
•
Unhide all the rows in both spreadsheets and sort both by the Counter(<field>) so the rows are exactly in the same
order (control-A to select all, then Data/Sort by the first column in ascending order)
•
Select the first column (counter name) and then control-click on the Avg column from the service_etCnt.csv file
•
Go past the last column of service_etAvg.csv and paste the two columns past the Avg/Baseline column. You may
need to use mouse-right “Paste Special” and select “Values” to paste in the results of the formula based column from
service_etCnt.csv.
© Copyright IBM Corp. 2012
19 of 32
•
Scroll down and spot check that the rows are using the same names to make sure the data is aligned correctly, then
you can delete the Counter(etCnt) column and rename the service_etCnt.csv “Avg” field as “Avg Counts”
•
Sort in descending order by the new sort column
The resulting data table may have too wide a data range to chart easily but it will highlight the average times of the most
frequently used operations. This particular table shows some unusually slow operations in the most frequently used operations.
© Copyright IBM Corp. 2012
20 of 32
4.3 Working with Data Tables and Charts
The charts produced using the JazzMon_Visualizer focus on the top N operations as sorted by the “Totals” column. You may
want to focus on other web services by sorting by other values such as averages or actual numbers in a particular time slot, etc.
By resorting or filtering a table you can investigate other web services - the associated chart will be updated as soon as the
table changes.
4.3.1 Basic Table Structure
This provides a spreadsheet showing counter names and average response times (above).
• Column 1 is the “counter” being measured (with the leading “com.ibm.team.” leader trimmed off)
• Column 2 is the optional “baseline” that the collected data is being compared to (based on ANALYSIS_BASELINE).
• Intermediate columns are the data snapshots. If there are too many columns to read in the full spreadsheet, use the
ANALYSIS_SAMPLE_TIME property to reduce the sampling rate and run analyze again.
• The last 4 columns provide built in formulas to compute information about the data columns that provide sort keys to
highlight the more interesting data. NOTE: If you get an error in the Avg/Baseline column see more information on
ANALYSIS_TARGET to adjust the data for the spreadsheet application you are using.
o Totals, Max, Avg - sum / maximum / average of all data columns in the row respectively
o Avg/Baseline - compares Average to the Baseline value for the current row as a percentage
• NOTE: The *_etAvg data tables now have two additional columns
o TotalTime column is added to show the total time spent on each web service
o TotalCounts column shows counts for the run and can be used to filter out or hide low count web services
o Average of the averages is computed as TotalTime/TotalCounts to provide a weighted average for the run
© Copyright IBM Corp. 2012
21 of 32
4.3.2 Sorting
Time- trend tables often have over 500 rows, one for each of the available Jazz web services. To make sense out of this wealth
of information, we must extract the most important items by sorting and filtering.
In Excel, select the entire table by selecting the upper left corner of the table use (ctrl-A), then select Data/Sort from the menu
bar. For working with averages, select “Avg” and sort in descending order to bring the longest response times to the top of the
table. (To return to the original alphabetic order, select “Counter (etAvg),” Ascending.)
© Copyright IBM Corp. 2012
22 of 32
4.3.3 Filtering
Filtering can be done by manually “hiding” data rows or columns (select rows or columns and mouse-right “hide”) or using the
Filter/AutoFilter feature of Excel under the Data menu. Either approach will immediately affects any charts based on that data
table.
• Select all the data (control-A) then select Data, Filter, AutoFilter.
• This will add pull down menus under every column that allow you to select “Top 10” (or any “Top N”) to
automatically hide rows not selected by the filter selection
• To undo a given selection, use the filter pull down menu to select (All) again.
• The autofilter “Custom…” option will allow you use AND/OR logic to specify ranges and additional filtering of
strings with SQL-like “contains” and “equals” expressions.
NOTE: Since the *_etAvg data tables include the TotalTime and TotalCounts you may want to first sort the table in
descending order by TotalCounts and hide or filter out the low frequency calls, i.e. hide anything below 10 calls per hour, in
order to ignore slow response web services that are not called often enough to be interesting.
4.4 Reporting Gaps during monitoring
When the server fails to respond to a request for a web service report, JazzMon will make a copy of the previous report as a
place holder and leave a file (CounterContentServerX.ERROR.txt) that contains the exception. This may result when the server
has gone down or is being rebooted or a communications error occurs temporarily. JazzMon will continue to make requests for
subsequent reports for the remainder of the run. Placeholders are used to ensure that data samples across multiple servers or
nodes all have the same number of samples to avoid data skew because of gaps.
The corresponding data column is highlighted with (?) to indicate it is not valid data and the data columns may be hidden if
desired. The placeholder data is a copy of the previous sample which in this simulated communication error causes an
apparent jump in the data between 17:11 and 17:12 is identical so the computed delta count drops to zero but then jumps
dramatically. Rebooting the server will reset all counters to zero so a server restart may cause a similar spike in some reports
before settling down again and in some cases may become a negative value. Hiding the placeholder column and following
column will provide a more meaningful representation.
NOTE: Aggregated node data makes some basic assumptions in order to merge data from multiple nodes. See the section
“2.4.1 Cluster Node Data Aggregation” for more details.
© Copyright IBM Corp. 2012
23 of 32
Counts showing error
30000
25000
scm.common.IVersionedContentService.GE
T
repository.common.internal.IRepositoryRem
oteService.fetchOrRefreshItems
build.internal.common.ITeamBuildService.sa
ve
repository.common.service.IQueryService.qu
eryItems
build.internal.common.ITeamBuildService.ge
tBuildEngine
build.internal.common.ITeamBuildRequestS
ervice.getNextRequest
jfs.users.service.IContributorService.GET
20000
repository.common.internal.IRepositoryRest
Service.GET
repository.common.jauth.IIssueAuthToken.P
OST
build.internal.common.ITeamBuildService.se
tLastContactTime
repository.service.IVersionCompatibilityRest
Service.GET
repository.common.internal.IRepositoryRem
oteService.describe
repository.common.internal.IFeedService.GE
T
repository.service.IItemRenderService.GET
15000
10000
5000
0
Feb_28_2012
17:10
Feb_28_2012
17:11
(?)Feb_28_2012
17:12
Feb_28_2012
17:13
Feb_28_2012
17:14
workitem.common.internal.IWorkItemReposi
toryService.fetchNewer
build.internal.common.ITeamBuildService.st
artBuildActivity
workitem.common.internal.IQueryRepository
Service.count
build.internal.common.ITeamBuildService.ad
dBuildResultContributions
NOTE: One thing that stands out in many charts is the sudden dip in the second column for all web services. This is an artifact
of data computing data values in time intervals. In order to get the relative number of counts or time, the analyzer compares
each time slice to the slice before it to get a delta count, so the counts for the first time slice are 0’s, for the second slice is
Time2 – Time1, etc. This first column dip artifact can be eliminated by hiding that first time column in Excel by selecting the
first data column and using mouse-right Hide as shown below.
© Copyright IBM Corp. 2012
24 of 32
5. Interpreting Results
5.1 Overall Totals (Top Level workbook)
JazzMon produces a set of CSV files in the top level folder that provide data on overall totals across the set of application or
server URLs you are tracking. The initial workbook that the JazzMon Visualizer produces looks at this information to provide
a “50,000 foot” view of the traffic across these servers. Note: The examples in this chapter are based on a week’s worth of data
collected from the main jazzdev production server.
Reviewing the data in this workbook provides an overview of the comparative traffic across your applications or servers.
Typically the JTS application experiences low volumes of traffic since it is usually providing user authentication and services
in support of the primary applications like ccm (or “jazz”) or qm. These charts often highlight major patterns.
© Copyright IBM Corp. 2012
25 of 32
5.2 Floating License Usage (license_flVal in jts application)
To find out the primary usage cycles, click on the “*.jts” subdirectory workbook link. The Floating License data tab will
provide a clear indication of user activity, highlighting the types of user licenses checked out and active during the main work
period for your users. Matching user cycles to other charts, like average response times, will usually highlight which operations
are under performing during the periods of greatest interest.
© Copyright IBM Corp. 2012
26 of 32
5.3 Component Summaries
The CCM (or jazz) application is generally where most of the traffic occurs. If you are still looking at the *.jts workbook
follow the hyperlink back to the top level work book and then select the *.jazz subdirectory workbook from there. The first two
charts provide an intermediate scale summary of the traffic frequency and time by totaling web service traffic by the major
server subsystem components. This gives you a break down by the different functional areas of the server. In an SCM site it is
typical for the scm component to show significant traffic because it involves file downloads. The build and repository
components often display a regular pattern of activity in support of the build engines checking for and processing build
requests. A list of component names is included in the table of contents for each workbook.
© Copyright IBM Corp. 2012
27 of 32
5.4 Web Service Traffic Details
5.4.1 Average Response Time (service_etAvg)
Average Response Time is an important indicator of end user experience. The patterns you are usually looking for are changes
in response time or unexpectedly long response times.
NOTE: If you find the default Y scale is hiding the details you need, mouse-right over the values in the left hand Y axis and
adjust the scale to a specific volume as shown below. You may also “hide” rows containing specific web services in the data
table to filter them out (the chart will reflect the change immediately).
The resulting chart will scale up the smaller values of primary interest. From the adjust chart shown below, we can see that
compared to the baseline file average times, a number of operations spike dramatically mid day under load. Keep in mind that
baseline data just provides an average reference point for an alternate server or point in time. But unusually long response
times that correspond to user reported performance problems usually provide a starting point in identifying what web services
are involved in performance issues. Looking at the average response times is interesting but without some additional context
can be misleading.
• Average response times are calculated based on total time and counts during that interval for the service. This
naturally makes the graph somewhat “spiky” because the values return to 0 when there is no traffic in a given period.
• Some operations normally take a substantial amount of time, especially reports and integration operations.
• Discard, Suspend, and Resume can take significant time depending on size of the end users suspended queue.
© Copyright IBM Corp. 2012
28 of 32
© Copyright IBM Corp. 2012
29 of 32
5.4.2 Counts (service_etCnt)
The Service Counts chart provides insight into what the most frequently called operations are. Be aware that web services
called many times may not consume the most processing time if their average response times are small. See the next section for
total time, a better indicator of load.
Here are a few highlights:
• scm.common.IVersionedContentService.GET downloads a single file. This is usually the most frequent call made
in a conventional SCM environment and performance issues here can have a major impact on overall performance.
The file size for this call does impact response time so look at the Bytes Sent data (service_bsTot.csv) to see how your
average size compares to the baseline size before drawing overall conclusions.
• build.internal.common.ITeamBuildService.getBuildEngine and *.ITeamBuildRequestService.getNextRequest
are two calls that are made frequently in support of the build engines waiting for build requests.
• repository.common.internal.IRepositoryRemoteService.fetchOrRefreshItems is used to obtain many individual
elements of data used in work items and other RTC artifacts.
• repository.common.internal.IFeedService.GET performs a feed query for a specific project area such as Build
events, Team information, or workitem changes. In the RTC Eclipse client go to the Team Dashboard view, go to the
Event Log and click on the down facing triangle to get to the Configure menu for feeds. This will list the feeds a given
client is watching using this web service; if you edit an individual Feed source you can see how often that feed calls
this web service to get updated information.
© Copyright IBM Corp. 2012
30 of 32
5.4.3 Total Time (service_etTot)
The actual elapsed time spent processing the web services is a better indication of where the server is spending more effort than
the raw service counts. It helps put average times and counts in context showing by showing the product of the two. Slow
response times for operations that are called frequently can be a better indication of where problems may lie.
© Copyright IBM Corp. 2012
31 of 32
5.5 Asynchronous Tasks (async_etTot)
The total time table for asynchronous tasks is also interesting to check to see how much time is being spent on background
tasks for maintenance and supporting operations. These operations can be long running so just because an operation finished
in a given interval it doesn’t mean it was only running during that interval. But if you find that long operations are completing
during or shortly after a period when performance problems have been identified, it may indicate that some maintenance
operations are taking longer than expected and not finishing in the off-hours period.
These operations are used for things like
• Cleaning up obsolete data results (BuildResultPrunerTask)
• Notifying users and processes of completed operations (BuildNotificationTask, notification.mail,
workitem.service.save.postnotification
• Supporting build engine operations (BuildSchedulerTask, BuildAgentLoop)
• Taking snapshots for data warehouse operations (ScmSnapshotTask, CommonSnapshotTask)
NOTE: Some web services like reports are not run very often and can have very long response times. Baseline data
comparisons are also vulnerable to large spikes in response times which may be skewing averages. Sometimes data points that
suggest a serious response time regression can be attributed to a single large sample (i.e. a user running a huge report). Using
counts, median, max, and standard deviation metrics can help identify when these issues affect average response time accuracy.
© Copyright IBM Corp. 2012
32 of 32