1
TABLE OF CONTENTS
INTRODUCTION ......................................................................................................... 6
How this Manual is Organized ..............................................................................................................6
Types of User ..........................................................................................................................................7
CONCEPTS................................................................................................................. 8
What is Map Intelligence?......................................................................................................................8
What is a Layer? ............................................................................................................................8
Layer Types ....................................................................................................................................8
THE MAPPING VIEWER........................................................................................... 12
What is a Mapping Viewer? .................................................................................................................12
Accessing the Mapping Viewer from the Dashboard Client ............................................................12
Accessing Selections from Dashboard Client...................................................................................14
CONFIGURATION OVERVIEW ................................................................................ 16
Overview ................................................................................................................................................16
Prerequisites ................................................................................................................................16
Configuration Process .........................................................................................................................17
Client Administrator ...................................................................................................................17
Layer Designer ...........................................................................................................................17
ADMINISTRATOR CONFIGURATION ..................................................................... 19
Overview ................................................................................................................................................19
Step by Step Configuration .................................................................................................................19
Merge Component to Blank BQY .................................................................................................19
Configure Component Server Settings ........................................................................................20
Revert BQY to a Component .......................................................................................................23
DASHBOARD CONFIGURATION ............................................................................ 25
Overview ................................................................................................................................................25
Merge Component to Dashboard ........................................................................................................26
Configure Map Intelligence Buttons ...................................................................................................27
Embedding the Mapping Viewer in a dashboard frame. ..................................................................31
Upgrading existing Map Intelligence enabled dashboards ..........................................................33
MAP INTELLIGENCE CONFIGURATION ................................................................ 35
Manual
Configure Map Settings .......................................................................................................................35
Configure iServer Settings ..................................................................................................................41
LAYER CONFIGURATION ....................................................................................... 42
Layer Overview .....................................................................................................................................42
Configure Point Layers ........................................................................................................................43
Configure Database Point Layers .......................................................................................................54
Configure Server Point Layers ............................................................................................................61
Configure Relationship Layers ...........................................................................................................68
Configure Area Group Layers .............................................................................................................73
Aggregation Options ............................................................................................................................79
Numeric Aggregation....................................................................................................................79
String Aggregation........................................................................................................................86
Configure Layers for Selections .........................................................................................................90
Configure Layer Association ..............................................................................................................95
ADVANCED TOPICS ................................................................................................ 98
APPENDIX A – SUPPORTED ENCODINGS ............................................................ 99
GLOSSARY ............................................................................................................ 104
INDEX ..................................................................................................................... 109
Manual
INTRODUCTION
HOW THIS MANUAL IS ORGANIZED
The Map Intelligence Dashboard Client User Manual has been written for the End User and contains the following
Sections:
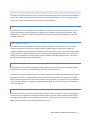
Introduction and Concepts – Introduces key Map Intelligence concepts and introduces the different
user groups involved.
Configuration Overview – Describes prerequisites and outlines the configuration tasks of the Client
Administrator and the Layer Designer.
Administrator Configuration – Describes the Client Administrator’s configuration tasks
Dashboard Configuration – Describes the steps required in adding the Map Intelligence component to
an existing Hyperion Intelligence Dashboard Builder dashboard.
Map Intelligence Configuration – Describes how to configure the settings for your Map Intelligence
Server and the properties of the underlying map to be used for your analysis.
Layer Configuration - Describes how to configure the Map Intelligence Layer configuration screens.
Advanced Topics – Describes how to configure Map Intelligence for Auto-Pilot Mode.
This manual also includes a Glossary and Index sections which can be found at the end of the manual.
HYPERION PRODUCTS
This manual uses the following names to describe Hyperion products.
Hyperion Intelligence Designer means Hyperion Intelligence Designer or Hyperion System 9 BI+
Interactive Reporting Studio.
Hyperion Intelligence Dashboard Builder means Hyperion Intelligence Dashboard Builder or Hyperion
System 9 BI+ Dashboard Studio.
Hyperion iServer means Hyperion Performance Suite iServer, System 9 BI+ Workspace.
Map Intelligence Dashboard Client Manual
6
TYPES OF USER
The effective use of Map Intelligence involves a number of separate processes which can be performed by different
types of user. The following section describes these users and the Map Intelligence manuals and guides available.
This manual has been written for Client Administrators and Layer Designers.
SERVER ADMINISTRATORS
Server Administrators are responsible for the installation and management of the Map Intelligence Server. These
users should be familiar with the organization’s mapping server (hereinafter referred to as GIS Provider). Server
Administrators are advised to read the separate Server Installation and Administration Guide found on the Map
Intelligence Server CD.
CLIENT ADMINISTRATOR
Client Administrators are responsible for configuring the Map Intelligence component before it can be used to
configure analysis layers. This group is involved in merging the Map Intelligence component into Hyperion®
Intelligence Dashboard Builder templates and dashboards, as well as providing a way to access the Mapping Viewer
from the dashboards. Client Administrators are also responsible for determining which maps, colors and icons are
available for the configuration of analysis layers. These are available on the Map Intelligence Server. This manual
should be read by Dashboard Client Layer Designers.
LAYER DESIGNERS
Layer Designers are responsible for configuring the Map Intelligence layers to be displayed in the Mapping Viewer.
This type of user should have a firm understanding of the spatial analysis required.
Layer Designers using the Dashboard Client are most likely responsible for creating the dashboards that present key
information and metrics. The dashboards then become the basis for spatial analysis. The designers are normally
Business Analysts who are familiar with the data available in the organization. The process for creating a dashboard
is documented in the Hyperion Intelligence Dashboard Builder manual. This manual should be read by Dashboard
Client Layer Designers.
END USERS
End Users are users who want to view configured Map Intelligence layers on a map. Their roles may include slicing
and dicing data on the dashboard, launching the Mapping Viewer to generate spatial representations of the data
and using the Map Intelligence tools and features to analyze the map. End Users should Read the Map Intelligence
Mapping Viewer Manual found on the Map Intelligence Server CD.
Map Intelligence Dashboard Client Manual
7
CONCEPTS
WHAT IS MAP INTELLIGENCE?
Map Intelligence creates interactive mapping applications in real time based on information sent from business
dashboards. It tracks the current state of charts, pivots and data result-sets and keeps the mapping display and the
dashboard synchronized. Any data manipulation such as limits, filtering or chart slicing that are applied in the
dashboard are automatically reflected in the mapping application. Even the dashboard look and feel are
automatically transferred to the map display.
Spatial data can be selected from the map display and returned to the dashboard as limits to give a sharper focus to
your analysis. This round trip cycle can be repeated as often as required. Your spatial and non-spatial analysis is a
seamless cycle where your state of analysis in either representation is maintained in the other.
WHAT IS A LAYER?
Maps are built with layers. Each layer holds characteristics that may be of interest to End Users. Layers contain
features of the map such as streets, parks, postal districts, cities, radio towers, rivers and so on. Each map layer sits
on top of another layer, e.g. a country layer may sit all the way at the bottom with street layers sitting right at the
top.
Layers can also be created dynamically from data found in external sources. Map Intelligence is capable of
generating a variety of layer types to aid analysis.
In this manual, layers that reside as part of the mapping environment are referred to as built-in layers. Layers
created dynamically from external data sources including your dashboard data are known as Map Intelligence
layers.
LAYER TYPES
The following layers can be created and configured using Map Intelligence:
POINT LAYERS
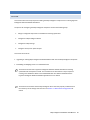
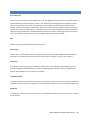
Point layers are map layers where data is represented on the map as discrete point images or symbols. For
example: a particular layer might represent the location of stores as push-pin icons and another layer could
represent accidents as colored dots, where the color (theme) represents the severity of the accident. Typically, the
rows in a table of data belong to a business concept such as people or address details, where each column is an
attribute of that concept. Thus each row in your business data can be represented as an individual point in a point
layer. In Map Intelligence, point layers form the foundation for relationship layers.
Map Intelligence Dashboard Client Manual
8
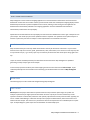
Fig 1. The Mapping Viewer displaying a Point layer.
RELATIONSHIP LAYERS
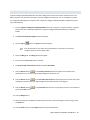
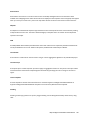
Radius relationship layers are circular regions with themes around certain points of interest that show information
about other points which fall within that circular region. These layers are generated by Map Intelligence. They are
based on calculations made by Map Intelligence on the specified data values as defined by the layer designer. For
example: different colored circles indicate the average house price within half a kilometer of a proposed waste
plant. Another example is where different colored circles indicate the number of burglaries that have occurred
within a five-mile distance of houses belonging to known burglars. In the current version of Map Intelligence, the
circle center points (eg: houses belonging to known burglars) and the data being analyzed (burglaries), must be
point layers.
Map Intelligence Dashboard Client Manual
9
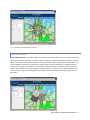
Fig 2. The Mapping Viewer displaying a Radius Relationship layer.
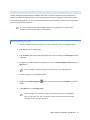
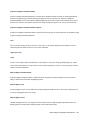
A Region Relationship layer corresponds to a map area of any shape that is solely geographical in its definition,
and is not generated by Map Intelligence. Examples would be suburbs, zip / postal codes, local government areas,
or police precincts. Region Relationship layers can be given themes according to specified data rules associated
with the points that fall within that region. An example of such a theme could be color-coding precincts according
to the number of crimes that have taken place within their boundaries, or applying different hatches to suburbs
based on the total value of house sales that have occurred in each one. Map Intelligence works out in which region
a point (eg: a sale or an accident) physically belongs to by doing a spatial calculation.
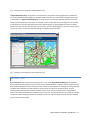
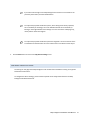
Fig 3. The Mapping Viewer displaying a Region Relationship layer.
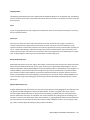
AREA GROUP LAYER
Area Group layers also correspond to existing areas on a map. As for Region Relationship layers, the displayed
theme is based on data attribute values, but in this case no spatial calculation is required. Instead, a column in your
business data is designated to have values that match a column in the map data. For example, an existing map layer
of suburbs may correspond to a data column for suburbs where the values are the suburb names. Then, for
transaction data that represents customer complaints and that also contains a suburb column, it is possible to
make a cross-reference between the transaction and the map area using the suburb name. An example that would
use this correlation is displaying a theme on a suburb’s area on the map that reflects the most common complaint
type received from that suburb.
Map Intelligence Dashboard Client Manual
10
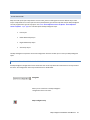
Fig 4. The Mapping Viewer displaying an Area Group layer.
Like built-in map layers, Map Intelligence layers also have a specific order in which they are placed on the map.
Point layers are placed on top of Radius Relationship layers, which in turn sit on top of the built-in map layers.
Region Relationship and Area Group layers shade existing built-in layers.
Map Intelligence Dashboard Client Manual
11
THE MAPPING VIEWER
WHAT IS A MAPPING VIEWER?
The Mapping Viewer is launched in a web browser after a request has been made to the Map Intelligence server. It
displays the configured Map Intelligence layers overlaid on a map specified by the Layer Designer.
Note: The Mapping Viewer may have been configured to display in an embedded browser on
a dashboard frame.
The Mapping Viewer also provides a number of controls and features that allow you to navigate around the map or
to change the theme displayed on the map. A number of tools are also available from the Mapping Viewer that
allow you to perform high-level analysis.
ACCESSING THE MAPPING VIEWER FROM THE DASHBOARD CLIENT
Map Intelligence allows you to view a set of results from a dashboard and project them onto a geographical map
for spatial analysis.
Map Intelligence launches a Mapping Viewer from within the dashboard that displays points and relationships on a
map based on layers configured by the Layer Designer. You can slice and dice data on the dashboard and project
the desired results onto the Mapping Viewer. When viewing the map, you can analyze your data further using the
controls available from the Mapping Viewer.
The Mapping Viewer can be accessed using a button found on the top panel of the dashboard – provided that one
was configured by the Layer Designer.
The Layer Designer or Client Administrator may choose to configure alternative ways to access the
Mapping Viewer.
Map Intelligence does not verify that the layer properties set in the dashboard are valid when a
new request is made. Instead, it will report errors as it finds them. E.g. if an invalid built-in layer has
been specified for an Area Group Layer, and the layer has not been made visible, the Mapping
Viewer will not report the error when you click the Map Intelligence button. The problem will only
be reported when the map is made visible.
Map Intelligence Dashboard Client Manual
12
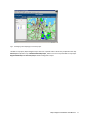
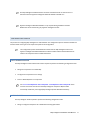
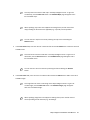
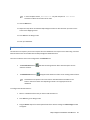
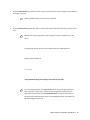
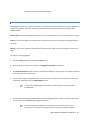
1.
Click the Map Intelligence
Designer).
button from the Top Panel (or any other image configured by the Layer
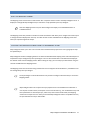
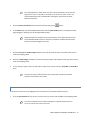
Fig 5. Sample Map Intelligence dashboard.
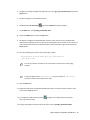
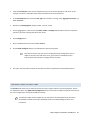
2.
A browser will be launched with a map showing the Map Intelligence layers configured by the Layer Designer.
For best results when displaying the Mapping Viewer, it is recommended that you have Internet
Explorer (IE) Version 6.0 or later installed.
Note: Integeo will only support IE Version 6.0 or later.
This version of Map Intelligence can run with FireFox 1.5 or later, however there are several
anomalies in the performance that will not be apparent in versions of IE. There are also some
FireFox‘skins’ that may be incompatible with Map Intelligence.
Map Intelligence Dashboard Client Manual
13
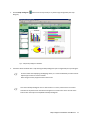
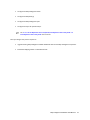
Fig 6. The Mapping Viewer.
The Mapping Viewer User Manual found on the Map Intelligence Server CD, contains further
information on the Analytical Tools and features of the Mapping Viewer, alternatively the
Mapping Viewer Help can be accessed by clicking on the Help button
of the Mapping Viewer and selecting Help from the drop-down list.
on the Top Panel
ACCESSING SELECTIONS FROM DASHBOARD CLIENT
The Selection tool is a feature of the Mapping Viewer that allows you to select points or regions of built-in maps.
These selections are saved on the Map Intelligence Server and can be accessed from the dashboard. The data
contained in these selections will be set as filters in the dashboard.
The Selection toolkit must be installed on your machine for the selected data to be returned to
the dashboard. Please refer to the Client Installation Guide found on the Map Intelligence
Dashboard Client CD for more information.
Map Intelligence Dashboard Client Manual
14
Further information on how to create selections in the Mapping Viewer can be found in the Mapping Viewer User
Manual, found on the Map Intelligence Server CD.
The following instructions explain how to access the selections from the Dashboard Client.
1.
From the dashboard click either the Get Selections
client’s Top Panel.
or Add Selections
button in the dashboard
The Get Selections button will clear all existing selection filters and will acquire the
enabled selections as filters.
The Add Selections button will attach the enabled selections as filters to the ones it
already has.
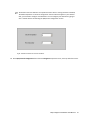
2.
A drop-down list will appear where you can choose to get/add all the selections, or only the selections for a
particular layer.
The layers available for selection are determined by the layers configured in the QIQ
Retrieval Configuration frame. See the Section8, Configure Layers for.
3.
Filters will be applied to the dashboard based on the selection.
4.
To remove these filters, press the Clear Filter button
in the dashboard.
Map Intelligence Dashboard Client Manual
15
CONFIGURATION OVERVIEW
OVERVIEW
PREREQUISITES
This section looks at the steps required in configuring your analysis layers and displaying them in the Mapping
Viewer. In order to configure Map Intelligence, the following components must be installed:
Windows System (NT, 2000, XP)
Map Intelligence Server - Version 2.2 or higher
Map Intelligence Dashboard Client - Version 2.2 or higher
Hyperion Intelligence Dashboard Builder - Version 8.2 (or higher) or Hyperion System 9 BI+ Dashboard
Studio
Hyperion Intelligence Designer - Version 8.2 (or higher), Brio 6.6 or Hyperion System 9 BI+ Interactive
Reporting Studio
Internet Explorer 6.0 or higher.
The Map Intelligence Server needs to be installed and configured in order to make the relevant maps, colors and
images available for your analysis. The Map Intelligence Server requires that a suitable mapping server be installed.
The installation of the Map Intelligence Server and mapping server are beyond the scope of this manual.
For instructions on how to install and configure the Map Server see the Map Intelligence
Server Installation and Administration Guide found on the Map Intelligence Server CD.
Map Intelligence requires that Hyperion Intelligence Dashboard Builder be installed on the
machine that will be used in configuring the analysis layers. Hyperion Intelligence Dashboard
Builder is used to create the dashboards that contain the data necessary for configuring the
Map Intelligence layers. The installation of Hyperion Intelligence Dashboard Builder and the
creation of a dashboard are beyond the scope of this manual.
Map Intelligence Dashboard Client Manual
16
The Map Intelligence Dashboard Client cannot be installed if it does not have access to a
machine which has Hyperion Intelligence Dashboard Builder installed on it.
Hyperion Intelligence Dashboard Builder is only required during dashboard creation.
Dashboards can be viewed using any Hyperion Intelligence viewer.
CONFIGURATION PROCESS
The process for configuring Map Intelligence is outlined below. The configuration process has been divided into
sections based on the type of user required to perform the configuration.
The configuration process outlined below assumes that the Map Intelligence Server and
Hyperion Intelligence Dashboard Builder have been installed and that the dashboard to be
used for the analysis has been created beforehand.
CLIENT ADMINISTRATOR
The Map Intelligence Client Administrator will be required to perform the following configuration tasks:
Merge the component into a blank BQY
Configure the component server settings
Revert a blank BQY back to a component
See Section Error! Reference source not found. - Error! Reference source not found. of this
manual. This section assumes that the Map Intelligence component BQY has been
successfully installed in your Integeo/Map Intelligence/Client Dashboard directory.
LAYER DESIGNER
The Layer Designer will be required to perform the following configuration tasks:
Merge a configured component to a dashboard containing spatial data
Map Intelligence Dashboard Client Manual
17
Configure the Map Intelligence button
Configure the Map Settings
Configure the Map Intelligence layers
Configure the layers for spatial analysis.
See Sections Error! Reference source not found.,Error! Reference source not found. and
Error! Reference source not found. of this manual.
The Layer Designer may also be required to
Upgrade existing Map Intelligence enabled dashboards with the new Map Intelligence component.
Embed the Mapping Viewer in a dashboard frame.
Map Intelligence Dashboard Client Manual
18
ADMINISTRATOR CONFIGURATION
OVERVIEW
Map Intelligence Client Administrators are responsible for configuring the Map Intelligence component before it
can be used to configure analysis layers.
Client Administrators are required to perform the following configuration tasks:
Merge a component into a blank ESM (Editable Source Master) document
Configure the component server settings
Revert a blank ESM back to a component
STEP BY STEP CONFIGURATION
MERGE COMPONENT TO BLANK BQY
The Map Intelligence component comes in the form of a Hyperion Intelligence document (BQY). The component
BQY contains a code section and a number of configuration frames. This component needs to be merged into a
blank Editable Source Master (ESM) so the server settings can be configured. An ESM is a form of dashboard that
can be manipulated by the Hyperion Intelligence Dashboard Builder to create a presentation layer for your data.
The Hyperion Intelligence Dashboard Builder comes with a Merge feature that can be used to combine two or more
BQYs to produce new documents that offer a variety of capabilities and features. You can use Merge to combine
the Map Intelligence component with a blank ESM using the steps outlined below.
1.
Start the Hyperion Intelligence Dashboard Builder from Start > Programs > Hyperion Solutions > Hyperion
Performance Suite > Developer Applications > Hyperion Intelligence Dashboard Builder > Dashboard Builder.
2.
The Select a Framework Template window will appear.
3.
You will need to create a blank ESM to merge the Map Intelligence component into. Double click on Express
Template.bqy (or a custom template of your choice) from the Create a Document From Template window.
4.
A blank ESM will open. Using Hyperion Intelligence Designer, save the document as Blank esm.bqy in your Map
Intelligence folder.
5.
Close the document. Click the Start button to move back to the Select a Framework Template window of the
Hyperion Intelligence Dashboard Builder.
Map Intelligence Dashboard Client Manual
19
6.
Click the Import
button. The Import window will appear.
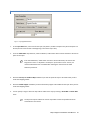
7.
Select the Merge tab. The Merge window will appear.
8.
Ensure that the Two to One radio button is selected.
9.
The Select and Re-order Sections checkbox should be deselected.
10. Click the Browse button
esm.bqy.
on the Primary Document field and navigate to the location of the Blank
11. Click the Browse button
on the Secondary Document field and navigate to the location of Map
Intelligence Component.bqy found in C:\Program Files\Integeo\Map Intelligence\Dashboard Client). This
contains the sections necessary when configuring the layers for your analysis.
12. Click the Browse button
Save button.
on the Save Path field and give the component a unique name and click the
It is important to give the component a unique name so that you do not overwrite
the original Map Intelligence component.
13. Click the Merge button.
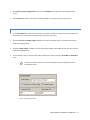
14. When the merge has completed, you will be presented with a report detailing the sections merged. Click the
OK button.
15. Click the View button from the Import window to open the merged document.
CONFIGURE COMPONENT SERVER SETTINGS
Before you can create your Map Intelligence layers, you must ensure that the necessary maps, colors and images
are made available to the component. Note that you can only specify files that are available from the nominated
Map Intelligence Server.
The QIQ Server Settings frame determines the maps, colors and images available for your analysis. It is
recommended that you configure the map settings before distributing the Map Intelligence component to your
Layer Designers.
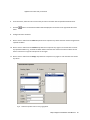
1.
From the merged ESM, select the QIQ Server Settings frame from the Section/Catalog.
Map Intelligence Dashboard Client Manual
20
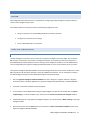
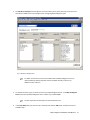
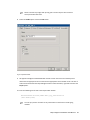
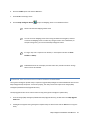
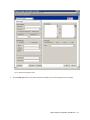
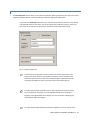
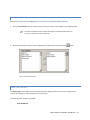
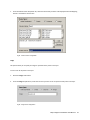
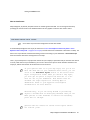
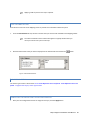
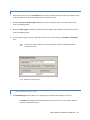
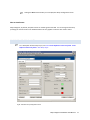
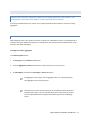
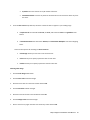
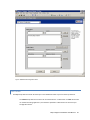
2.
The QIQ Server Settings frame will appear. This frame allows you to specify the maps, colors and icons
that will be available to the Layer Designer when configuring Map Intelligence layers.
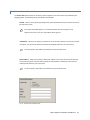
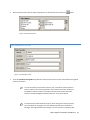
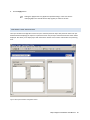
Fig 7. QIQ Server Settings frame.
A number of colors and icons that are included with the Map Intelligence server are
made available by default. Maps will need to be added manually as well as any
additional colors and icons.
3.
To add the necessary maps, you must connect to your Map Intelligence Server. In the Map Intelligence
Server field, enter the Map Intelligence server and port. E.g. localhost:8080.
You will only be able to add maps from the nominated server.
4.
In the Enter Map field, enter the name of a valid map and click the Add button to add it to the list of
available maps.
Map Intelligence Dashboard Client Manual
21
This map name must match a valid map in the Map Intelligence Server. To get a list
of valid maps, click the Show List button. The Available Maps page will appear with a
list of available maps.
When specifying map names in the QIQ Server Settings frame, the full name of the
map (including the file extension if applicable) e.g. map.mdf, must be specified.
You can remove a map from the list by selecting the map name and clicking the
Remove button.
5.
In the Enter Colors field, enter the name of a valid color file and click the Add button to add it to the list of
available colors
This color file must match a valid color in the Map Intelligence Server. To get a list of
valid colors, click the Show List button. The Available Colors page will appear with a
list of available colors.
You can remove a color from the list by selecting the file and clicking the Remove
button.
6.
In the Enter Icons field, enter the name of a valid icon file and click the Add button to add it to the list of
available images.
This image file must match a valid image in the Map Intelligence Server. To get a list
of valid images, click the Show List button. The Available Images page will appear
with a list of available images.
When specifying image files in the QIQ Server Settings frame, enter the full name of
the file (including the file extension) e.g. whitedot.gif.
Map Intelligence Dashboard Client Manual
22
You can remove an icon from the list by selecting the file and clicking the Remove
button.
7.
Save the document and give it a unique name. E.g. Configured Component.bqy.
REVERT BQY TO A COMPONENT
We have looked at how you can merge the Map Intelligence component into a Blank ESM and configure the
necessary server settings.
Once you have configured your server settings, you need to revert the configured BQY back into its component
state so Layer Designers can merge it into their dashboards.
1.
From your configured BQY, go to View > Unhide Section.
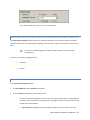
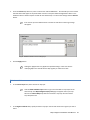
2.
The Unhide Sections window will appear. Select Qiq_GIS and click the OK button.
3.
From the Qiq_GIS frame, click the Component
button. This button deletes all user sections
from the ESM, reverting it back into its component form.
4.
A dialog box will appear confirming that you want to revert the BQY back to a component. Click the
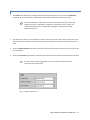
Yes button.
5.
Your BQY will now only have the following component sections:
Qiq_GIS
QIQ Map Settings
QIQ Point Configuration
QIQ Area Group Configuration
QIQ Server Settings
Component Banner
QIQ Relationship Configuration
Map Intelligence Dashboard Client Manual
23
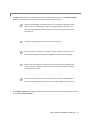
6.
Qiq_ActionLimits
QIQ Retrieval Configuration
Qiq_roundTripCommunicator
QIQ Comms Configuration
QIQ iServer Configuration
QIQ Database Point Configuration
QIQ Layer Association Configuration
QIQ Server Point Configuration
Save your component and give it a unique name. This is now ready to be merged into a Hyperion
Intelligence Dashboard Builder dashboard.
Map Intelligence Dashboard Client Manual
24
DASHBOARD CONFIGURATION
OVERVIEW
This section looks at the steps required in adding the Map Intelligence component to an existing Hyperion
Intelligence Dashboard Builder dashboard.
The process for configuring the Map Intelligence component involves the following steps:
Merge a configured component to a dashboard containing spatial data
Configure the Map Intelligence button
Configure the Map settings
Configure the layers for spatial analysis
This section also looks at:
Upgrading an existing Map Intelligence enabled dashboard with the new Map Intelligence component.
Embedding the Mapping Viewer in a dashboard frame.
This Section assumes that a Hyperion Intelligence Dashboard Builder dashboard containing
spatial data has already been created. This manual does not document the steps required in
creating a new dashboard. Refer to the Dashboard Builder User Manual installed with the
Hyperion Intelligence Dashboard Builder application for more details.
This Section also assumes that the Map Intelligence Server has been properly installed and all
the necessary server settings have been set. See Section 5 - Administrator Configuration for
details.
Map Intelligence Dashboard Client Manual
25
MERGE COMPONENT TO DASHBOARD
Hyperion Intelligence Dashboard Builder comes with a Merge feature that can be used to combine two or more
BQYs to produce new documents that offer a variety of capabilities and features. You can use Merge to combine
the configured Map Intelligence component with a Hyperion Intelligence Dashboard Builder dashboard using the
steps outlined below.
1.
Start the Hyperion Intelligence Dashboard Builder from Start > Programs > Hyperion Solutions > Hyperion
Performance Suite > Developer Applications > Hyperion Intelligence Dashboard Builder > Dashboard
Builder.
2.
The Select a Framework Template window will appear.
3.
Click the Import
button. The Import window will appear.
If the Import button is not visible, click the Start button on the Select a Framework
Template window and it should be visible.
4.
Select the Merge tab. The Merge window will appear.
5.
Ensure that the Two to One option is selected.
6.
The Select and Re-order Sections checkbox should be deselected.
7.
Click the Browse button
on the Primary Document field and navigate to the location of the
dashboard that you want to merge the Map Intelligence component into.
8.
Click the Browse button
on the Secondary Document field and navigate to the location of the Map
Intelligence component that your Map Intelligence Client Administrator has configured.
9.
Click the Browse button
and click the Save button.
on the Save Path field and enter an appropriate name for your dashboard
10. Click the Merge button.
11. When the merge has completed, you will be presented with a report detailing the sections merged. Click
the OK button.
12. Click the View button from the Import window to open the dashboard.
Map Intelligence Dashboard Client Manual
26
CONFIGURE MAP INTELLIGENCE BUTTONS
The Map Intelligence Dashboard Client installation comes with a number of images that can be configured to
provide various Map Intelligence functions. This section outlines the steps for configuring a button that provides
access to the Mapping Viewer. There are two additional buttons that are required in order to return selected data
from the map back to the dashboard.
It is recommended that the Map Intelligence button be configured for every frame of the
dashboard. The two Selection buttons are optional.
MAP INTELLIGENCE BUTTON
1.
Move to a dashboard frame through which you want to provide access to the Mapping Viewer.
2.
Press Ctrl D to go into Design mode.
3.
Drag the Picture object from the Graphics folder of the Section Catalog. The Select Image window
will appear.
4.
Navigate to your Map Intelligence\Images directory, select the Map Intelligence.bmp and click the
Open button.
You can configure alternative images to provide access to the Mapping Viewer.
5.
Position the graphic on the dashboard frame.
6.
Double click the Map Intelligence
appear.
7.
In the Name field, enter pic^Qiq_GIS^1.
button (or alternative image). The Properties window will
You can configure more than one image on a frame to have access to the Mapping
Viewer. If this is the case, you must specify a unique character for the last character
of the object name. E.g. pic^Qiq_GIS^2.
Map Intelligence Dashboard Client Manual
27
Please note that only images with pic^Qiq_GIS^1 as their object name will have a
tool tip associated with them.
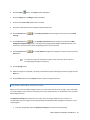
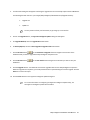
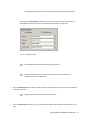
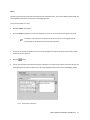
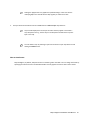
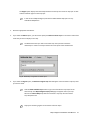
8.
Select the Visible option and click the OK button.
Fig 8. Properties window.
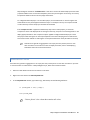
9.
All Hyperion Intelligence Dashboard Builder controls contain the same line of JavaScript that
determines the appropriate action to take and the appropriate control handler to call. This line of
code must be entered for the Map Intelligence button. Select the button, right click and select the
Scripts option.
10. Enter the following line of code in the Scripts Editor window:
ActiveDocument.Sections[txlMe.Text].Qiq_onControlClick
(this.Parent,this)
You can copy this line of code from any other button on the frame to avoid typing
mistakes.
Map Intelligence Dashboard Client Manual
28
In some template versions, ActiveSection may take the place of this.Parent.
This does not affect the execution of the code.
11. Click the OK button.
12. Repeat the steps above and add the Map Intelligence button to all frames that you want to have
access to the Mapping Viewer.
13. Press Ctrl D to exit Design mode.
14. Save your dashboard.
SELECTION BUTTONS
The Selections tool requires you to make a request from the dashboard. This request can be made using one of the
Selection buttons that are available with the Map Intelligence Dashboard Client.
There are two buttons that can be configured for the Selection tool.
The Get Selections button
selections as filters.
will clear all existing selection filters and will acquire the new
The Add Selections button
will append new selections as filters to the existing selection filters.
These buttons are optional. You can choose to make both buttons available on the
frame or select from either one depending on what is most appropriate for the
dashboard.
To configure the Selection buttons:
1.
Move to a dashboard frame that you want to add the button to.
2.
Press Ctrl D to go into Design mode.
3.
Drag the Picture object from the Graphics folder of the Section Catalog. The Select Image window
will appear.
Map Intelligence Dashboard Client Manual
29
4.
Navigate to your Map Intelligence\Images directory, select get_map_selections.bmp and click the
Open button.
5.
Position the graphic on the dashboard frame.
6.
Double click the Get Selections
7.
In the Name field, enter pic^Qiq_ActionLimits^Clear.
8.
Select the Visible option and click the OK button.
9.
All Hyperion Intelligence Dashboard Builder controls contain the same line of JavaScript that
determines the appropriate action to take and the appropriate control handler to call. This line of
code must be entered for the Get Selections button. Select the button, right click and select the
Scripts option.
button The Properties window will appear.
10. Enter the following line of code in the Scripts Editor window:
ActiveDocument.Sections[txlMe.Text].Qiq_onControlClick
(this.Parent,this)
You can copy this line of code from any other button on the frame to avoid typing
mistakes.
In some template versions, ActiveSection may take the place of this.Parent.
This does not affect the execution of the code.
11. Click the OK button.
12. Repeat the steps above and add the Add Selections button to all frames that you want to have
access to the Mapping Viewer.
13. To configure the Add Selections button
add_map_selections.bmp.
, navigate to the Images directory and select
14. Bring up the Properties window and set the object name to pic^Qiq_ActionLimits^Add.
Map Intelligence Dashboard Client Manual
30
15. Set the Visible option.
16. Bring up the Scripts window and add the line of code.
17. Position the buttons as needed.
An example template MapIntelligence_Template.bqy with the configured Map
Intelligence and Selection buttons can be found in the Map Intelligence/Dashboard
Client directory.
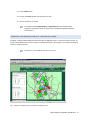
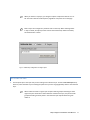
EMBEDDING THE MAPPING VIEWER IN A DASHBOARD FRAME.
By default, clicking the Map Intelligence button will open the Mapping Viewer in a separate browser window. By
using the Embedded Browser control in Hyperion Intelligence Designer, Layer Designers can embed the Mapping
Viewer in a dashboard frame.
This feature is not available for Brio version 6.6 users.
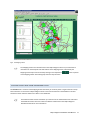
Fig 9. Example of the Mapping Viewer embedded in a dashboard frame.
Map Intelligence Dashboard Client Manual
31
1.
Using the Hyperion Dashboard Builder, create a new frame in your dashboard in which to embed
the Mapping Viewer.
As the Mapping Viewer uses a large screen area, it is advisable to use a frame
template with horizontal navigation.
The process for creating a dashboard frames is documented in the Hyperion
Intelligence Dashboard Builder manual.
To embed the Mapping Viewer in the dashboard:
1.
From your BQY, move to the new dashboard frame that you want to embed the Mapping Viewer in.
2.
Press Ctrl D to go into Design mode.
3.
Drag the Embed Browser object from the Controls folder of the Section Catalog to the new frame. Resize the
Embedded Browser to make full use of the frame.
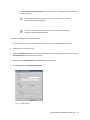
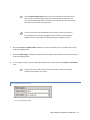
4.
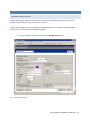
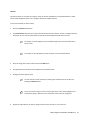
Double click the Embedded Browser. The Properties window will appear.
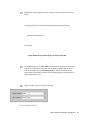
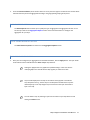
5.
In the Name field, enter IntegeoInternalBrowser
Fig 10. Properties window.
Map Intelligence Dashboard Client Manual
32
6.
Select the Visible option and click the OK button.
7.
Press Ctrl D to exit Design mode.
8.
Click the Map Intelligence Button
to open the Mapping Viewer in the dashboard frame.
Please wait while the Mapping Viewer loads.
You can access the Mapping Viewer frame using the dashboard navigation, however
to refresh the Mapping Viewer to reflect any changes made to in the dashboard, for
example setting limits, you must click the Map Intelligence button.
If a larger map area is required in the browser, in the Properties window set Show
Scrollbar to Always.
Embedded browsers do not display a browser status bar, therefore the Show Timings
feature will not be available.
UPGRADING EXISTING MAP INTELLIGENCE ENABLED DASHBOARDS
The Hyperion Intelligence Update utility is required to upgrade Map Intelligence enabled dashboards with the new
Map Intelligence BQY component. To function properly, this utility needs to be copied to the Integeo/Map
Intelligence/Dashboard Client/Upgrade directory.
The BQY Upgrade Finder can be used to locate and copy the Hyperion Intelligence Update utility.
1.
From the Integeo/Map Intelligence/Dashboard Client/Upgrade directory, double click on the BQY Upgrade
Finder.exe.
2.
A dialog box will appear stating the Hyperion Update utility has been found. Click the OK button to copy the
utility.
Map Intelligence Dashboard Client Manual
33
3.
A confirmation dialog box will appear confirming the Upgrade.exe was successfully copied. Click the OK button.
The following files will now be in your Integeo/Map Intelligence/Dashboard Client/Upgrade directory
Upgrade.exe
UpdtStr.ini
You may need to refresh your file browser, by pressing F5, to see the files.
4.
Click on the Upgrade.exe file, the Hyperion Intelligence Update dialog box will appear.
5.
For Upgrade Method, select the Upgrade One radio button.
6.
For Backup Options, select the Place Upgrade in Upgrade Folder radio button.
7.
Click the Browse button
on the Document to Upgrade field and navigate to the location of the
dashboard that you want to upgrade the Map Intelligence component into.
8.
Click the Browse button
dashboard.
9.
Click the Upgrade button. Your dashboard will now be upgraded with the new Map Intelligence component.
When the upgrade has completed, you will be presented with a report detailing the sections upgrade. Click the
OK button to close the report.
on the Save Path field and navigate to the location you wish to save your
10. Click the Close button on the Hyperion Intelligence Update dialog box.
For a more information on configuring the Hyperion Intelligence Update utility, see
the Hyperion Intelligence Update documentation.
Map Intelligence Dashboard Client Manual
34
MAP INTELLIGENCE CONFIGURATION
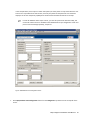
CONFIGURE MAP SETTINGS
The Map Settings frame allows you to configure the settings for your Map Intelligence Server as well as the
properties of the underlying map to be used for your analysis.
You will need to configure the map settings for your dashboard before you can configure the Map Intelligence
layers that you wish to be displayed in the Mapping Viewer.
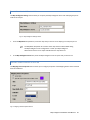
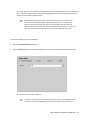
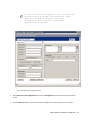
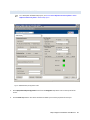
1.
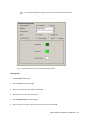
Open your Hyperion dashboard and move to the QIQ Map Settings frame.
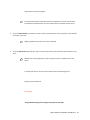
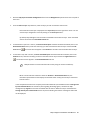
Fig 11. QIQ Map Settings frame.
Map Intelligence Dashboard Client Manual
35
MAP INTELLIGENCE SETTINGS SECTION
The Map Intelligence Settings section allows you to specify the Map Intelligence Server and underlying map to be
used for the analysis.
Fig 12. Map Intelligence Settings section.
1.
From the Map Name drop-down list, select the map that you want to use to display your analysis layers on.
The Map Name drop-down list contains all the maps that have been added during
the Map Intelligence server configuration. Consult your Map Intelligence
Administrator if there are no maps available from the drop-down list.
2.
In the Map Intelligence Server field, enter the Map Intelligence server and port that you wish to use.
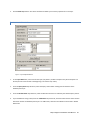
MAPPING VIEWER PROPERTIES SECTION
The Mapping Viewer Properties section allows you to configure properties of the Mapping Viewer that is launched
from the dashboard.
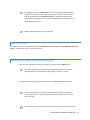
Fig 13. Mapping Viewer Properties section.
Map Intelligence Dashboard Client Manual
36
1.
Select the Send Style checkbox if you want the Mapping Viewer to reflect the style sheet applied to the
dashboard.
2.
To change the color of the Top Panel menu buttons, select the Specific Top Panel menu button color checkbox
and select a new color from the color picker.
3.
In the Title field, enter the title that you want to appear in the Top Panel of the Mapping Viewer (See Figure
below).
This field is optional.
4.
In the Logo field, enter the file name of the image that you want to appear in the Top Panel of the Mapping
Viewer (see Figure below).
This field is optional.
The specified file must be located in the Images folder of the Map Intelligence
directory on the server machine.
The recommended size for the image is 70 x 70 pixels. Larger images may cover some
elements or change the format of the Mapping Viewer.
Fig 14. Example of the Top Panel in the Mapping Viewer Showing Title and Logo.
Map Intelligence Dashboard Client Manual
37
If you are embedding the Mapping Viewer in a dashboard frame, it is recommended
you leave the Title and Logo fields blank to maximize the screen area.
5.
In the Map Width field, specify the map width that you would initially like to display in the Mapping Viewer.
This field is optional. If you do not specify a map width, Map Intelligence will apply a
default width that will display all your points. In this case, it is recommended that
you select Default as your Center Point option.
6.
From the Delimiter drop-down list, select a character to act as a separator for your data as it is sent to the Map
Intelligence Server.
The delimiter character acts as a separator for your data as it is sent to the Map
Intelligence Server. You must select a character that does not exist within your data
to avoid errors. The default character is ÿ.
7.
From the Locale drop-down list, select the locale to use for your analysis. The labels that appear in the layer
configuration frames and Mapping Viewer may vary depending on the locale set.
Setting a locale will automatically set the Units option to the default option for that
locale. E.g. Setting the USA locale will automatically result in the Imperial units option
to be selected.
8.
From the Units drop-down, select the unit of measurement that you would like to use for your analysis.
Imperial units = miles, feet
Metric units = kilometers, meters
Map Intelligence Dashboard Client Manual
38
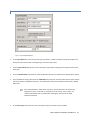
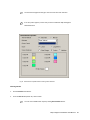
CENTER POINT PROPERTIES SECTION
The Center Point option allows you to specify a point to appear as the center of the map launched by the
Mapping Viewer. The following center point options are available.
Default – selects a center point by plotting all the points specified by the layers and takes the center
point of all the points.
If you select the Default option, it is recommended that you do not specify a map
width for your map. If you set a map width it will be ignored.
Coordinates – allows you to specify a coordinate to set as the center point for the map. If you select
this option, you will need to specify the latitude and longitude values for your center point.
You must specify a map width or the default center point will be used.
Street Address – allows you to specify a valid street address to set as the center point for the map.
If you select this option, you will need to specify the street/address, suburb/city, state and post
code/zip code values for your center point.
You must specify a map width or the default center point will be used.
Fig 15. Center Point Properties section.
Map Intelligence Dashboard Client Manual
39
1.
Select the desired Center Point radio button.
If you selected the Coordinates option, a Latitude and Longitude field will appear.
Enter valid values in these fields
If you selected the Street Address option, Street/Address, Suburb/City, State and
Post Code/Zip Code fields will appear. Enter valid values in these fields. Note that the
labels may vary depending on the locale set.
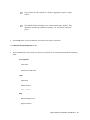
EMBEDDED BROWSER SETTINGS
1.
If you wish the map to reflect points selected using the Selection Tool, click the Synchronize the
Embedded Browser with Selection checkbox.
CHARACTER ENCODING
1.
In the Character Encoding field enter the character encoding that you are using in your bqy, an
example would be, for the Thai language TIS-620.
This field can be left blank if you are using the default character encoding ISO-8859-1 (Latin
Alphabet No.1)
A list of supported encodings can be found in Appendix A – Supported Encodings.
APPLYING YOUR SETTINGS
1.
Click the Apply button to save your map settings.
Clicking the Apply button only applies the specified settings. It does not save the
underlying BQY. Users should save the BQY regularly to avoid loss of data.
Map Intelligence Dashboard Client Manual
40
If you have made changes to the Map Settings frame and want to revert back to the
previously saved values, click the Refresh button.
For maps with projected coordinate systems, when setting Center Point properties,
the Y coordinate (or Northing) is set in the latitude field and the X coordinate (or
Easting) in the longitude field. These settings are in the units of the underlying map,
usually meters rather than degrees.
For maps with projected coordinate systems the longitude is set to the column of the
X coordinate and the latitude is set to the column of the Y coordinate in Point layers.
2.
Click the Next button to move to the QIQ iServer Settings frame.
CONFIGURE ISERVER SETTINGS
The settings on this page allow Map Intelligence to be invoked from a dashboard running in a Hyperion
Performance Suite iServer.
To configure the iServer Settings, please read the separate iServer Usage Guide found on the Map
Intelligence Dashboard Client CD.
Map Intelligence Dashboard Client Manual
41
LAYER CONFIGURATION
LAYER OVERVIEW
Maps are made up of layers. Map features such as roads, parks or traffic lights are held on different layers. Each
map is composed of one or more layers that are superimposed to give the final map look and feel. Map Intelligence
currently supports four types of map layers. See Section Error! Reference source not found. - Error! Reference
source not found. - Layer Types for a full description of Map Intelligence layers.
Point layers
Radius Relationship layers
Region Relationship layers
Area Group layers
The Map Intelligence component comes with configuration frames that allow you to create your Map Intelligence
layers.
CONFIGURATION FRAME TOP PANEL FEATURES
All Map Intelligence configuration frames contain the same set of drop-down lists and buttons on the Top Panel of
the frame. The Configuration Frame Top Panel features are listed below.
Navigation
Allows you to move from one Map Intelligence
configuration frame to another.
Map Intelligence Help
Map Intelligence Dashboard Client Manual
42
Opens the Map Intelligence Dashboard Client Help.
Language
Allows you to select the language that the operational
text and tool tips will appear in.
Dashboard Tool Tips
Activates tool tips and annotations that describe the
major navigational and functional elements of the
dashboard.
CONFIGURE POINT LAYERS
For a description of Point layers, see Section Section Error! Reference source not found. Error! Reference source not found. - Point Layers
1.
Select QIQ Point Configuration frame from the Navigation drop-down menu at the top left of the screen.
Map Intelligence Dashboard Client Manual
43
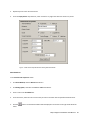
Fig 16. QIQ Point Configuration frame.
2.
Click the New Layer button. This clears the fields and allows you to set the properties for a new layer.
Map Intelligence Dashboard Client Manual
44
LAYER PROPERTIES SECTION
Fig 17. Layer properties section.
1.
In the Layer Name field, enter a title for the layer (only letters, numbers and spaces may be used. Spaces can
be used, but must not be used at the beginning or end of the layer name).
2.
From the Table Name drop-down list, select the Results / Table section which contains the data to be used as
points for this layer.
If the selected Results / Table section contains a column called Item, this column will
be ignored as ‘Item’ is a keyword in JavaScript. If you do have an ‘Item’ column, it is
recommended that this be renamed before selecting the section from the Table
Name drop-down list.
3.
Select the Set Layer as Visible in Map checkbox if you wish this particular layer to be visible when you first
access the Mapping Viewer.
4.
Select the Enable Popups checkbox if you wish information popups to be enabled for the layer when you first
access the Mapping Viewer.
5.
You can specify a range in which the layer will be visible on the map by entering a Zoom Min and Zoom Max
value.
The layer will only be visible if the current map width is within the specified minimum
and maximum zoom values.
Map Intelligence Dashboard Client Manual
45
POINT PROPERTIES SECTION
1.
The Point Properties section allows you to select the method for plotting the points on the map. Points can be
mapped using coordinates or valid street addresses. Select the appropriate radio button.
If you select the Coordinates radio button, you must specify the columns that contain the Latitude
and Longitude values for each point. You can also specify the coordinate systems to use for the
layer if you do not intend to use the inherent coordinate system of the selected map.
Fig 18. Latitude/Longitude option.
A coordinate system provides a frame of reference for measuring locations on the
surface of the earth. A full list of acceptable coordinate systems is available in the
Coordinate Systems document found on the Map Intelligence Dashboard Client CD,
an example for MapInfo is shown in the picture above. This field is optional.
For maps with projected coordinate systems, when setting Center Point properties,
the Y coordinate (or Northing) is set in the latitude field and the X coordinate (or
Easting) in the longitude field. These settings are in the units of the underlying map,
usually meters rather than degrees.
For maps with projected coordinate systems the longitude is set to the column of the
Map Intelligence Dashboard Client Manual
46
X coordinate and the latitude is set to the column of the Y coordinate in Point layers.
If you select the Street Address radio button, you must specify the columns that contain the
Street/Address, Suburb/City, State and Post Code/Zip Code values for each point.
Fig 19. Street Address option.
The drop-down labels will vary depending on the locale set.
The Street Address option will only work if a geocoder has been installed or in
ArcIMS if the map layer is geocoded.
2.
From the Label Column drop-down list, select a column that contains the values to appear on the labels for
each point in the layer.
Applying a label for each point in the layer is optional.
3.
From the URL Column drop-down list, select a column that contains URLs associated with the points in the
layer.
Map Intelligence Dashboard Client Manual
47
Multiple URLs can be assigned to a point using semi-colons to separate names and
values.
In the bqy URL column; enter the name and the URL in the following format
Name;Url;<space>Name;Url
For example:
“Integeo Web Site;http://www.integeo.com; Report;report.pdf”
From Mapping Viewer, the Active Points tool can be used for points that have been
assigned to a single URL. If a point has been assigned to multiple URLs, the active
links can be viewed from the Information Panel. For further information on the
Active Points and Information sections see the Mapping Viewer User Manual on the
Map Intelligence Server CD.
Applying a URL for points in the layer is optional.
Fig 20. Label and URL Columns
Map Intelligence Dashboard Client Manual
48
DATA COLUMNS SECTION
Data columns can be sent to the Mapping Viewer to provide more information about each point.
1.
From the Data Columns list box, select the columns that you want to make available to the Mapping Viewer.
The values contained in these columns will appear in a popup window when you
move your mouse over a point in the map.
2.
Select the data columns that you want to display from the left hand list box and click the
button.
Fig 21. Data Columns sections.
THEME TYPES SECTION
The Theme Types section allows you to select the method for applying a theme for your layer. Setting a theme
involves color-coding or assigning images to points in the layer.
The following theme options are available:
Active Dashboard
Map Intelligence Dashboard Client Manual
49
This option generates themes based on the legend items of charts embedded on the current dashboard
frame. The list of available themes available in the Mapping Viewer will vary depending on the frame
used to access the Map Intelligence Server.
The dashboard frame that the map is launched from must contain a chart whose
columns exist in the Results/Table section that the Point layer is created from. If
there is no chart on the frame or if there is no chart column from that particular
table section, points from that layer will not be displayed on the map. As a result, any
other layer that makes use of that Point layer will not be displayed on the map.
To set a theme based on the active dashboard:
1.
Select the Active Dashboard radio button.
2.
From the Shape drop-down list, select the shape that you want to use to represent each point in the layer.
Fig 22. Active Dashboard theme configuration.
This option only requires you to specify a shape for the theme, as the legend items of
the charts on the current dashboard frame will determine the color of each point.
Map Intelligence Dashboard Client Manual
50
Charts
This option generates themes based on the legend items of specified charts. The list of available themes will be the
same regardless of the frame used to access the Mapping Viewer.
To set a theme based on a chart:
1.
Select the Charts radio button.
2.
From the Shape drop-down list, select the shape that you want to use to represent each point in the layer.
This option only requires you to specify a shape for the theme, as the legend items of
the specified charts will determine the color of each point.
3.
The list box on the left hand side contains a list of all available charts. Select the charts that you want to base
the themes of your points on.
4.
Click the
5.
You can sort the order of the selected charts by clicking the up or down arrow buttons next to the list box. The
theme generated from the first chart on the list will be displayed when you first access the Mapping Viewer.
button.
Fig 23. Charts theme configuration.
Map Intelligence Dashboard Client Manual
51
Columns
This option allows you to specify an image for values in columns available from the specified Results or Table
section. Map Intelligence allows you to configure themes for multiple columns
To set a theme based on column values:
1.
Select the Columns radio button.
2.
The Column Name drop-down list contains all selected data columns. Select a column to configure from the
drop-down list. The two list boxes below the drop-down will be populated with relevant values.
The list box on the left displays a list of available images that can be associated with a
column value.
The list box on the right displays a list of all values from the selected column.
3.
Select an image and a column value and click the Add button.
4.
The specified theme condition will be displayed at the bottom list box.
5.
Configure all other desired values.
You can remove a theme condition by selecting the condition from the list box and
clicking the Remove button.
You do not need to assign an icon for every single column value. Map Intelligence will
automatically assign a default icon for all values that have not been configured.
6.
Repeat the steps above if you want to assign themes to other columns in your results set.
Map Intelligence Dashboard Client Manual
52
7.
From the Default Theme drop-down list, select the theme that you want to be displayed when the Mapping
Viewer is accessed for the first time.
Fig 24. Columns theme configuration.
Image
This option allows you to specify an image to represent all the points in the layer.
To set an icon for all points in the layer:
1.
Select the Image radio button.
2.
From the Image drop-down list, select the icon that you want to use to represent each point in the layer.
Fig 25. Image theme configuration.
Map Intelligence Dashboard Client Manual
53
3.
After you have configured the themes or images for the layer, click the Apply button.
Clicking the Apply button only applies the specified settings. It does not save the
underlying BQY. Users should save the BQY regularly to avoid loss of data.
4.
The layer will be saved and will now be available from the Select a Layer drop-down list.
Layers will be displayed on the map in the order that they appear in the Select a
Layer drop-down list. E.g. the first layer in the drop-down list will be the top-most
layer in the map.
You can delete a layer by selecting a layer from the Select a Layer drop-down list and
clicking the Delete button.
Note on data format
Map Intelligence, by default, will place commas in numbers greater than 999. You can change the format by
specifying the column format in the dashboard table. This only applies to columns with numeric values.
CONFIGURE DATABASE POINT LAYERS
Database Point Layers have been designed to be used with MapXtreme.
When large amounts of data are sent to the server, the response time will decline as the amount of point
data increases. For example, access to 2 million sales points across the whole USA maybe required, if you
have no idea where the end user will navigate or zoom to.
Database point layers have been designed for when large numbers of points need to be available on the
map. When using Database Point layers, only the metadata describing how to access the point data from a
database and how to theme the points is sent to the server. The server loads the points as they are
required to give a faster response time.
Map Intelligence Dashboard Client Manual
54
In the example above, there may be 2 million sales points, but if the points are only visible when the user
zooms into a map width of less than 10 miles, then only the points for that particular area need to be
displayed. In this case maybe only 20,000 points would need to be loaded and shown on the map.
In order for Database Point Layers to work, you must first process the data in the BQY, this
ensures all column names are available to the Database Point Layer configuration screen and
points can be themed appropriately, if required.
Fig 26. QIQ Database Point Configuration frame.
1.
Select QIQ Database Point Configuration frame from the Navigation drop-down menu at the top left of the
screen.
Map Intelligence Dashboard Client Manual
55
2.
Click the New Layer button. This clears the fields and allows you to set the properties for a new layer.
LAYER PROPERTIES SECTION
Fig 27. Layer Properties Section.
1.
In the Layer Name field, enter a title for the layer (only letters, numbers and spaces may be used. Spaces can
be used, but must not be used at the beginning or end of the layer name).
2.
From the Query Name drop-down list, select the Query section which is being used for the basis of the
database point layer.
3.
From the Results Name drop-down list, select the Results section that is created by the selected Query section.
4.
If your dashboard is using a table, from the Table Name drop-down list, select the Table section which contains
data to be used for the database point layer. If no table exists, select the same Results section used in Results
Name field.
Map Intelligence Dashboard Client Manual
56
If the selected Results / Table section contains a column called Item, this column will
be ignored as ‘Item’ is a function in JavaScript. If you do have an ‘Item’ column, it is
recommended that this be renamed before selecting the section from the Table
Name drop-down list.
5.
Select all Primary Key Columns from the left hand list box and click the
button.
6.
In the Profile field, enter the Database Profile Name. Click the Show Profiles button, the Database Profiles
page will appear, displaying a list of existing Database Profiles.
Database Profiles are created by Server Administrators. Server Administrators should
see the Database Profiles section in the Server Installation and Administration Guide
found on the Map Intelligence Server CD.
7.
Select the Set Layer as Visible in Map checkbox if you wish this particular layer to be visible when you first
access the Mapping Viewer.
8.
Select the Enable Popups checkbox if you wish information popups to be enabled for the layer when you first
access the Mapping Viewer.
9.
You can specify a range in which the layer will be visible on the map by entering a Zoom Min and Zoom Max
value.
The layer will only be visible when the current map width is within the specified
minimum and maximum zoom values.
DATA COLUMNS SECTION
Data columns can be sent to the Mapping Viewer to provide more information about each point.
1.
From the Data Columns list box, select the columns that you want to make available to the Mapping Viewer.
The values contained in these columns will appear in a popup window when you
move your mouse over a point in the map.
Map Intelligence Dashboard Client Manual
57
2.
Select the data columns that you want to display from the left hand list box and click the
button.
Fig 28. Data Columns sections.
POINT PROPERTIES SECTION
Fig 29. Point Properties section.
1.
From the Latitude and Longitude drop-down lists select the columns that contain the Latitude and Longitude
values for each point.
You can also specify the coordinate system to use. A coordinate system provides a
frame of reference for measuring locations on the surface of the earth. A full list of
acceptable coordinate systems is available in the Coordinate Systems document
found on the Map Intelligence Dashboard Client CD. This field is optional.
For maps with projected coordinate systems, when setting Center Point properties,
the Y coordinate (or Northing) is set in the latitude field and the X coordinate (or
Easting) in the longitude field. These settings are in the units of the underlying map,
Map Intelligence Dashboard Client Manual
58
usually meters rather than degrees.
For maps with projected coordinate systems the longitude is set to the column of the
X coordinate and the latitude is set to the column of the Y coordinate in Point layers.
2.
From the Label Column drop-down list, select a column that contains the values to appear on the labels for
each point in the layer.
Applying a label for each point in the layer is optional.
3.
From the URL Column drop-down list, select a column that contains URLs associated with the points in the
layer.
Multiple URLs can be assigned to a point using semi-colons to separate names and
values.
In the bqy URL column; enter the name and the URL in the following format
Name;Url;<space>Name;Url
For example:
“Integeo Web Site;http://www.integeo.com; Report;report.pdf”
Map Intelligence Dashboard Client Manual
59
From Mapping Viewer, the Active Points tool can be used for points that have been
assigned to a single URL. If a point has been assigned to multiple URLs, the active
links can be viewed from the Information Panel. For further information on the
Active Points and Information sections see the Mapping Viewer User Manual on the
Map Intelligence Server CD.
Applying a URL for points in the layer is optional.
THEME TYPES SECTION
The Theme Types section is discussed in Section Error! Reference source not found. - Error! Reference source not
found. - Configure Point Layers, Theme Types Section.
COMPLETING THE DATABASE POINT LAYER CONFIGURATION
1.
After you have configured the themes or images for the layer, click the Apply button.
Clicking the Apply button only applies the specified settings. It does not save the
underlying BQY. Users should save the BQY regularly to avoid loss of data.
2.
The layer will be saved and will now be available from the Select a Layer drop-down list.
Layers will be displayed on the map in the order that they appear in the Select a
Layer drop-down list. E.g. the first layer in the drop-down list will be the top-most
layer in the map.
You can delete a layer by selecting a layer from the Select a Layer drop-down list and
Map Intelligence Dashboard Client Manual
60
clicking the Delete button.
Note on data format
Map Intelligence, by default, will place commas in numbers greater than 999. You can change the format by
specifying the column format in the dashboard table. This only applies to columns with numeric values.
CONFIGURE SERVER POINT LAYERS
Server Point Layers have been designed to be used with ArcIMS.
A standard Map Intelligence Point Layer (as discussed in Section Error! Reference source not found. - Error!
Reference source not found. - Configure Point Layers) transfers data from a Dashboard or document to a Map. The
data on the map is filtered and themed according to filters and settings in your Dashboard. A Server Point Layer
filters and themes data that is already present in the map.
That is, if you already have a map layer that contains all your company’s spatial data and you have the same data in
a results / table section of your dashboard, you can use a Server Point Layer to theme and filter that data in the
map layer, without the need for all the data to be sent to the server.
If your spatial data is in your map layer, but you do not
have the same data in your dashboard data source, you can
click on the Available Layers button on the Server Point
Layer configuration frame. When you choose a map layer,
you will get an option to export the data set to a csv
file for use in your dashboard. This manual does not
document the steps required in creating BQYs or
dashboards. Refer to your Hyperion Intelligence
documentation for more details.
Alternatively, if you are using ArcSDE to provide map
layers to ArcIMS with an underlying database then you can
make queries to that database to extract the necessary
point data to the BQY.
Queries used as a basis for Server Point Layers should
not contain joins.
Map Intelligence Dashboard Client Manual
61
In order for Server Point Layers to work, you must first
process the data in the BQY, this ensures all column
names are available to the Server Point Layer
configuration screen and points can be themed
appropriately, if required.
Fig 30. QIQ Server Point Configuration frame.
1.
Select QIQ Server Point Configuration frame from the Navigation drop-down menu at the top left of the
screen.
2.
Click the New Layer button. This clears the fields and allows you to set the properties for a new layer.
Map Intelligence Dashboard Client Manual
62
LAYER PROPERTIES SECTION
Fig 31. Layer Properties Section
1.
In the Layer Name field, enter a title for the layer (only letters, numbers and spaces may be used. Spaces can
be used, but must not be used at the beginning or end of the layer name).
2.
From the Query Name drop-down list, select the Query section which is being used for the basis of the Server
Point layer.
3.
From the Results Name drop-down list, select the Results section that is created by the selected Query section.
4.
If your dashboard is using a table, from the Table Name drop-down list, select the Table section which contains
data to be used for the database point layer. If no table exists, select the same Results section used in Results
Name field.
If the selected Results / Table section contains a column called Item, this column will
be ignored as ‘Item’ is a function in JavaScript. If you do have an ‘Item’ column, it is
recommended that this be renamed before selecting the section from the Table
Name drop-down list.
5.
In the Server Layer field, enter the name of the built-in layer that contains your point data.
Map Intelligence Dashboard Client Manual
63
Click the Show Available Layers button to get a list of the built-in map layers for the
selected map. The Map Intelligence Query Tool page will appear. Select your map
from the Choose Map drop-down list and select the map layer from the Choose Layer
drop-down list that contains your point data.
In the current version of the Dashboard Client, selecting a layer from the Choose
Layer drop-down list in the Map Intelligence Query tool, does not automatically
populate the Server Layer field in the Relationship Layer configuration screen.
6.
Select the Set Layer as Visible in Map checkbox if you wish this particular layer to be visible when you first
access the Mapping Viewer.
7.
Select the Enable Popups checkbox if you wish information popups to be enabled for the layer when you first
access the Mapping Viewer.
8.
You can specify a range in which the layer will be visible on the map by entering a Zoom Min and Zoom Max
value.
The layer will only be visible when the current map width is within the specified
minimum and maximum zoom values.
POINT PROPERTIES SECTION
Fig 32. Point Properties section.
Map Intelligence Dashboard Client Manual
64
1.
From the Label Column drop-down list, select a column that contains the values to appear on the labels for
each point in the layer.
Applying a label for each point in the layer is optional.
2.
From the URL Column drop-down list, select a column that contains URLs associated with the points in the
layer.
Multiple URLs can be assigned to a point using semi-colons to separate names and
values.
In the bqy URL column; enter the name and the URL in the following format
Name;Url;<space>Name;Url
For example:
“Integeo Web Site;http://www.integeo.com; Report;report.pdf”
From the Mapping Viewer, the Active Points tool can be used for points that have
been assigned to a single URL. If a point has been assigned to multiple URLs, the
active links can be viewed from the Information Panel. For further information on
the Active Points and Information sections see the Mapping Viewer User Manual on
the Map Intelligence Server CD.
Map Intelligence Dashboard Client Manual
65
Applying a URL for points in the layer is optional.
DATA COLUMNS SECTION
Data columns can be sent to the Mapping Viewer to provide more information about each point.
1.
From the Data Columns list box, select the columns that you want to make available to the Mapping Viewer.
The values contained in these columns will appear in a popup window when you
move your mouse over a point in the map.
2.
Select the data columns that you want to display from the left hand list box and click the
button.
Fig 33. Data Columns sections.
THEME TYPES SECTION
The Theme Types section is discussed in Section Error! Reference source not found. - Error! Reference source not
found. - Configure Point Layers, Theme Types Section.
COMPLETING THE SERVER POINT LAYER CONFIGURATION
1.
After you have configured the themes or images for the layer, click the Apply button.
Map Intelligence Dashboard Client Manual
66
Clicking the Apply button only applies the specified settings. It does not save the
underlying BQY. Users should save the BQY regularly to avoid loss of data.
2.
The layer will be saved and will now be available from the Select a Layer drop-down list.
Layers will be displayed on the map in the order that they appear in the Select a
Layer drop-down list. E.g. the first layer in the drop-down list will be the top-most
layer in the map.
You can delete a layer by selecting a layer from the Select a Layer drop-down list and
clicking the Delete button.
Note on data format
Map Intelligence, by default, will place commas in numbers greater than 999. You can change the format by
specifying the column format in the dashboard table. This only applies to columns with numeric values.
Map Intelligence Dashboard Client Manual
67
CONFIGURE RELATIONSHIP LAYERS
For a description of Relationship Layers, see Section Error! Reference source not found. - Error!
Reference source not found. - Relationship Layers
Fig 34. QIQ Relationship Configuration screen.
3.
Select QIQ Relationship Configuration frame from the Navigation drop-down menu at the top left of the
screen.
4.
Click the New Layer button. This clears the fields and allows you to set the properties for the layer.
Map Intelligence Dashboard Client Manual
68
RELATIONSHIP PROPERTIES SECTION
1.
Enter a title for the layer in the Layer Name field (only letters, numbers and spaces may be used. Spaces can be
used, but should not be used at the beginning or end of the layer name).
2.
Select the Set Layer as Visible in Map checkbox if you wish this particular layer to be visible when you first
access the Mapping Viewer.
3.
Select the Enable Popups checkbox if you wish information popups to be enabled for the layer when you first
access the Mapping Viewer.
4.
You can specify a range in which the layer will be visible on the map by entering a Zoom Min and Zoom Max
value.
The layer will only be visible if the current map width is within the specified minimum
and maximum value.
Fig 35. Relationship Properties section
RELATIONSHIP TYPE SECTION
1.
The Relationship Type section allows you to specify the type of relationship to display on the map.
The Radius option displays the relationship between two Point layers as color-coded or hatched
circles around a particular point.
Map Intelligence Dashboard Client Manual
69
The Region option displays the relationship between a Point layer and a built-in map layer as colorcoded or hatched regions on the map layer.
In this version of Map Intelligence, hatches for Radius Relationship layers are only
available for MapXtreme.
2.
Select the appropriate radio button.
3.
If you select the Radius option, you will need to specify the Reference Point Layer to use and the radius of the
circle that you want to display on the map.
The Reference Point Layer refers to the Point layer that you want to base the
relationship on. Points in this layer become the center point of the shaded circles.
Fig 36. Relationship configuration for Radius option.
4.
If you select the Region option, the Reference Region Layer field will appear. Enter the built-in map layer that
you want to shade.
Click the Show Available Layers button to get a list of the built-in map layers for the
selected map. The Map Intelligence Query Tool page will appear. Select your map
file from the Choose Map drop-down list and select a map layer from the Choose
Layer drop-down list.
Only layers containing regions can be used as reference layers.
Map Intelligence Dashboard Client Manual
70
When you choose a map layer, you will get an option to export the data set to a csv
file. The entire data set will be exported, regardless of any limits set on the page.
Built-in layers are arranged in a particular order on the map. When selecting a builtin layer to shade, all map layers that sit under the selected layer will be covered by
the selected color or hatch.
Fig 37. Relationship configuration for Region option.
FACT POINTS SECTION
1.
The fact point layer is the layer that you are relating to the reference layer. From the Fact Point Layer dropdown list, select the Point Layer containing the points that you want to geographically relate to the reference
layer.
When related to a built-in region layer the points will be grouped according to which
regions they are contained in. When related to another Point Layer, the points will be
grouped according to which points in the reference layer they fall within the given
radius of.
Map Intelligence Dashboard Client Manual
71
2.
From the Fact Point Column, select the fact column to use to paint the regions. The data for this column will be
extracted from the points and aggregated according to the geographical grouping of the points.
DATA PROPERTIES SECTION
The Data Properties section allows you to specify the type of aggregation and aggregation function to use
for the layer. Refer to the Aggregation Options section at the end of this Section to configure the
aggregation for your layer.
VISUAL THEME PROPERTIES SECTION
The Visual Theme Properties are discussed in the Aggregation Options section.
SAVING YOUR CONFIGURATION
3.
After you have configured your aggregation and threshold conditions, click the Apply button. The layer will be
saved and will now be available from the Select a Layer drop-down list.
Clicking the Apply button only applies the specified settings. It does not save the
underlying BQY. Users should save the BQY regularly to avoid loss of data.
Layers will be displayed on the map in the order that they appear in the Select a
Layer drop-down list. E.g. the first layer in the drop-down list will be the top-most
relationship layer in the map. Region layers will remain at the layer of the built-in
layer in the map.
You can delete a layer by selecting a layer from the Select a Layer drop-down list and
clicking the Delete button.
Map Intelligence Dashboard Client Manual
72
Clicking the Next button will take you to the QIQ Area Group Configuration Screen.
Note on data format
Map Intelligence, by default, will place commas in numbers greater than 999. You can change the format by
specifying the column format in the dashboard table. This only applies to columns with numeric values.
CONFIGURE AREA GROUP LAYERS
For a description of Area Group Layers, see Section Error! Reference source not found. - Error!
Reference source not found. - Area Group Layer.
Fig 38. QIQ Area Group Configuration Frame
Map Intelligence Dashboard Client Manual
73
1.
Select QIQ Area Group Configuration frame from the Navigation drop-down menu at the top left of the
screen.
2.
Click the New Layer button. This clears the fields and allows you to set the properties for the layer.
AREA PROPERTIES SECTION
1.
In the Layer Name field, enter a title for the layer (only letters, numbers and spaces may be used. Spaces can
be used, but must not be used at the beginning or end of the layer name).
2.
Select the Set Layer as Visible in Map checkbox if you wish this particular layer to be visible when you first
access the Mapping Viewer.
3.
Select the Enable Popups checkbox if you wish information popups to be enabled for the layer when you first
access the Mapping Viewer.
4.
You can specify a range in which the layer will be visible on the map by entering a Zoom Min and Zoom Max
value.
The layer will only be visible if the current map width is within the specified minimum
and maximum value.
Fig 39. Area Properties section.
Map Intelligence Dashboard Client Manual
74
TABLE SECTION
1.
The Table section allows you to configure the necessary table settings for the layer. From the Table Name
drop-down list, select the Results / Table section which contains the data to be used for this layer.
If the selected Results / Table section contains a column called Item, this column will
be ignored as ‘Item’ is a keyword in JavaScript. If you do have an ‘Item’ column, it is
recommended that this be renamed before selecting the section from the Table
Name drop-down list.
2.
Area Group layers require a union between a column in your Results section and a column in the built-in map
layer that you want to shade. You need matching values from these two columns for the Area Group layer to
work.
3.
From the Table ID Column drop-down list, select the column from your Results section to use as a basis for the
Area Group layer.
4.
From the Fact Column drop-down list, select the column that contains the values to be measured for this layer.
If you are doing a numeric aggregation, you do not need to specify a fact column
when using the Count function.
Fig 40. Configured Table section.
Map Intelligence Dashboard Client Manual
75
MAP SECTION
1.
The Map section allows you to configure the necessary map settings for the layer. In the Reference Region
Layer field, enter the built-in map layer that you want to shade or apply a color to.
Click the Show Available Layers button to get a list of the built-in map layers for the
selected map. The Map Intelligence Query Tool page will appear. Select your map
from the Choose Map drop-down list and select a map layer from the Choose Layer
drop-down list.
Only layers containing regions can be used as reference layers.
When you choose a map layer, you will get an option to export the data set to a csv
file. The entire data set will be exported, regardless of any limits set on the page.
Built-in layers are arranged in a particular order on the map. When selecting a builtin layer to shade, all map layers that sit under the selected layer will be covered by
the selected color or hatch.
If you select a map layer from the Choose Layer drop-down list, a table will appear
with the columns available for that layer and the values available from that column.
2.
In the Region ID Column field, specify the built-in map layer column that contains values that match the ones
in the specified Table ID Column.
Map Intelligence Dashboard Client Manual
76
Fig 41. Configured Map section.
DATA PROPERTIES SECTION
The Data Properties section allows you to specify the type of aggregation and aggregation function to use for the
layer. Refer to the Aggregation Options section at the end of this Section to configure the aggregation for your
layer.
VISUAL THEME PROPERTIES
The Visual Theme Properties are discussed in the Aggregation Options section.
Map Intelligence Dashboard Client Manual
77
SAVING YOUR CONFIGURATION
3.
After you have configured your aggregation and threshold conditions, click the Apply button. The layer will be
saved and will now be available from the Select a Layer drop-down list.
Clicking the Apply button only applies the specified settings. It does not save the
underlying BQY. Users should save the BQY regularly to avoid loss of data.
You can delete a layer by selecting a layer from the Select a Layer drop-down list and
clicking the Delete button.
Note on data format
Map Intelligence, by default, will place commas in numbers greater than 999. You can change the format by
specifying the column format in the dashboard table. This only applies to columns with numeric values.
Map Intelligence Dashboard Client Manual
78
AGGREGATION OPTIONS
CONFIGURING THE DATA PROPERTIES AND VISUAL THEME PROPERTIES SECTIONS OF THE
RELATIONSHIP LAYER AND AREA GROUP LAYER CONFIGURATION SCREENS
Area Group and Relationship Layers require you to specify threshold conditions based on a Numeric or String
aggregation.
NUMERIC AGGREGATION
Map Intelligence allows you to perform a function on values from a specified fact column. The specified built-in
map layer will then be shaded according to the resulting values. The numeric functions available include: Count,
Sum, Min, Max, Mean and Median.
To configure a numeric aggregation
In the Data Properties Section
1.
For Data Type, click the Numeric radio button.
2.
From the Aggregation Function drop-down list, select the function to use for the layer.
3.
For Value Option, click either the Percentage or Value radio button.
The aggregates can be used as the raw aggregate value or as a percentage of the
total aggregate over the Fact Point layer.
Note that only one color and one hatch layer can be displayed simultaneously for a
particular built-in layer. If you have multiple layers that use the same built-in layer,
you can switch between these using the Theme Select option from the Mapping
Viewer.
Map Intelligence Dashboard Client Manual
79
Fig 42. Data Properties Section showing the numeric option selected
CONFIGURING THE VISUAL THEME PROPERTIES SECTION BASED ON A NUMERIC AGGREGATION
The Visual Theme Properties section allows you to specify the shading to use for the layer based on thresholds
applied to the data. You can shade a region by applying a color or hatch to a built-in map layer or a circle around a
point.
In this version of Map Intelligence, hatches for Relationship layers are only available
for MapXtreme.
There are two methods for applying themes:
Automatic
Manual
AUTOMATIC METHOD
In the Visual Theme Properties section
1.
For Theme Method, click the Automatic radio button.
2.
From the Scheme drop-down list, select a color scheme.
You can use a standard classification scheme if you want to group similar values to look for patterns
in the data. You can choose from three schemes for grouping data values into classes based on how
the data values are distributed.
Equal Interval: The difference between the high and low values is the same for every class.
Map Intelligence Dashboard Client Manual
80
3.
Quantile: Each class contains an equal number of features.
Standard Deviation: Features are placed in classes based on how much their values vary from
the mean.
From the Class Count drop-down list, select the number of colors to appear in your shading range.
3.
If Equal Interval was selected for Scheme, for Scale, click either the Linear or Logarithmic radio
button.
4.
If Standard Deviation was selected for Scheme, for Std Deviation Multiplier enter the multiplying
factor.
There are three options for selecting the Visual Features:
Color Range: Allows you to choose a start and end color.
Colors: Allows you to specify a particular color for each class.
Hatches. Allows you to specify a particular hatch for each class.
Selecting Color Range
1.
Click the Color Range radio button.
2.
Click the Start Color colored rectangle.
3.
Select the start color from the color window and click OK.
4.
Click the End Color colored rectangle.
5.
Select the end color from the color window and click OK.
6.
Click the Empty Values colored rectangle.
7.
Select a color for any region that does not contain any values and click OK.
Map Intelligence Dashboard Client Manual
81
The colored rectangles will change to the new color chosen after each selection.
Fig 43. Visual Theme Properties Section showing Color Range Selected.
Selecting Colors
1.
Click the Colors radio button.
2.
Click the Class #1 colored rectangle.
3.
Select a color from the color window and click OK.
4.
Repeat Steps 2 and 3 for each class listed.
5.
Click the Empty Values colored rectangle.
6.
Select a color for any region that does not contain any values and click OK.
Map Intelligence Dashboard Client Manual
82
The colored rectangles will change to the new color after each selection.
If no color picker appears, ensure that you have installed the Map Intelligence
Dashboard Client.
Fig 44. Visual Theme Properties Section showing Colors Selected.
Selecting Hatches
1.
Click the Hatches radio button.
2.
From the Class #1 drop-down list, select a hatch.
You can view available hatch styles by clicking Show Hatches button.
Map Intelligence Dashboard Client Manual
83
3.
Repeat Steps 2 and 3 for each class listed.
4.
From the Empty Values drop-down list, select a hatch for any region that does not contain any values.
Fig 45. Visual Theme Properties Section showing Hatches Selected.
Manual Method
In the Visual Theme Properties section
1.
For Theme Method, click the Manual radio button.
2.
For Shading Option, click either the Color or Hatch radio button.
3.
Enter a value in the Threshold field.
4.
From the list box, select the color or hatch that you want to associate with the specified threshold value.
5.
Click the
frame.
button. The threshold condition will be displayed in the list box on the right hand side of the
Map Intelligence Dashboard Client Manual
84
6.
Configure all other threshold conditions.
7.
Select a color or hatch from the Values Outside Threshold drop-down list to represent any values that may be
outside the specified threshold values.
Fig 46. Threshold Properties section: Manual Theme Method.
Map Intelligence includes an 'unshaded color'. If this color is chosen for Relationship layers with radius
properties hidden circles are removed completely so that they do not appear on the map, nor can they
be exported. Hidden circles do not have popup information.
For a Region Relationship layer or an Area Group layer, the 'unshaded color' is used for regions that
should be left as they would appear without that layer. For example a country on a map that should
not be colored by an Area Group layer would be left unshaded.
If the 'transparent color' is applied to a Relationship layer with a radius property, it causes the
'transparent' circles to be displayed as see-through on the map, except for a surrounding border. It will
display popup information. The 'transparent option' applied to a Region Relationship layer or Area
Group layer makes the regions on the map transparent so that the underlying areas can still be seen.
This can be used for suburbs or small regions of a map which would not usually be visible on the map.
Null values are ignored on aggregations so an empty area may contain points or rows
with null values. For instructions on how to display null values, refer to the Displaying
Map Intelligence Dashboard Client Manual
85
Null Values section at the end of this Section.
STRING AGGREGATION
Map Intelligence allows you to perform a function on string values from a specified fact column. String aggregations
require you to specify a color/hatch condition for a specific value instead of a threshold. The string functions
available include:
Most Common – this function applies the condition if the nominated value is the most common value in the region.
Uniform – this function applies the condition if the nominated value is the only value from the specified column in
the region.
Majority – this function applies the condition if the nominated value makes up more than half of the values in the
region.
To configure a string aggregation:
1.
Select the String radio button from the Data Type section.
2.
Select the function to use for the layer from the Aggregation Function drop-down list.
3.
The Threshold Properties section allows you to specify the shading to use for the layer and configure threshold
values and images to use for the layer.
4.
You can shade a region by applying a color or hatch to a built-in map layer or circle around a point. Select the
appropriate radio button from the Shading Option section.
In this version of Map Intelligence, hatches for Relationship layers are only available
for MapXtreme.
5.
The top list box will display all available values from the specified fact column. Select a value from the list box
or enter a value from the Value field to apply a condition to.
The Value field takes precedence over the selection made from the list box. If you
have entered a value and made a selection from the list box, the color/hatch will be
Map Intelligence Dashboard Client Manual
86
applied to the value that you entered.
6.
From the list box, select the color or hatch that you want to associate with the specified threshold value.
7.
Click the
frame.
8.
Configure all other conditions.
9.
Select a color or hatch from the Other drop-down list to represent any values that have not been assigned with
a specific condition.
button. The threshold condition will be displayed in the list box on the right hand side of the
10. Select a color or hatch from the Conflict drop-down list to represent any region or circle that does not meet
any specified condition. E.g. A Conflict condition will be returned if the ‘Uniform’ function has been set and
there is more than one type of value present in the region.
11. Select a color or hatch from the Empty drop-down list to represent any region or circle that does not contain
any values.
Fig 47. Threshold Properties section for string aggregations.
Map Intelligence Dashboard Client Manual
87
Map Intelligence includes an 'unshaded color'. If this color is chosen for Relationship layers with radius
properties hidden circles are removed completely so that they do not appear on the map, nor can they
be exported. Hidden circles do not have popup information.
For a Region Relationship layer or an Area Group layer, the 'unshaded color' is used for regions that
should be left as they would appear without that layer. For example a country on a map that should
not be colored by an Area Group layer would be left unshaded.
If the 'transparent color' is applied to a Relationship layer with a radius property, it causes the
'transparent' circles to be displayed as see-through on the map, except for a surrounding border. It will
display popup information. The 'transparent option' applied to a Region Relationship layer or Area
Group layer makes the regions on the map transparent so that the underlying areas can still be seen.
This can be used for suburbs or small regions of a map which would not usually be visible on the map.
Null values are ignored on aggregations so an empty area may contain points or rows
with null values. For instructions on how to display null values, refer to the Displaying
Null Values section at the end of this Section.
DISPLAYING NULL VALUES
Null values are ignored on aggregations so an empty area may contain points or rows with null values. If you want
to view null values or include them in a Map Intelligence layer, follow the instructions below:
1.
Move to a Table Results section that contains the null values.
2.
Right mouse click and choose Add Computed Item.
3.
In the Computed Item window, type a Name (e.g. Null Values) and the following definition:
if (Column_Name == null) {“Empty”}
else {Column_Name}
‘Column_Name’ is the column that contains null values.
Map Intelligence Dashboard Client Manual
88
If you want to use this column for a numeric aggregation, replace ‘empty’
with ‘0’.
Note that the format of numbers in a column must be pure numbers. They
should not include any symbols for example, ‘%’, but can have decimal
places.
4.
Click the OK button to save the definition and to add a new column to the table.
In the QIQ Area Group Configuration screen:
1.
Select a Relationship or Area Group Layer from the drop-down list. This should automatically fill in following
fields:
Area Properties
Layer Name
Min Zoom and Max Zoom
Table
Table Name
Table ID Column
Fact Column
Map
Reference Region Layer
Region ID Column
Map Intelligence Dashboard Client Manual
89
2.
Under the Fact Column, select the new computed item you just created to identify the null values. In this
example, the column is called Null Values. Select Null Values from the drop-down list.
3.
In the Data Properties box, choose the Data Type, either Numeric or String, and an Aggregation Function, e.g.
MOST COMMON.
4.
Decide on the Shading Option, display as either a color or a hatch.
5.
For string aggregation, make sure that the Other, Conflict and Empty fields are filled in from the drop-down
selections, otherwise a prompt will ask for their values.
6.
Click the Apply button.
7.
Select a dashboard frame from the available Sections.
8.
Click the Map Intelligence button in the dashboard to open the map viewer.
Note: Ensure that the layer you chose in the QIQ Area Group Configuration screen is
visible on the map in the map viewer. If not, go to Controls > Relationship Layers.
Click the Show Controls button and apply the layer as visible.
9.
The map in the map viewer will show the data with null values as specified from the dashboard frame.\
CONFIGURE LAYERS FOR SELECTIONS
The Selection tool allows users to select points from the map or regions of built in maps and bring them back to
the dashboard as filters. The QIQ Retrieval Configuration frame can be used to configure the specific columns from
the Point or Region layer that will be available for selection.
The Selection toolkit must be installed on your machine for the selected data to be returned to
the dashboard. Please see the Client Installation Guide on the Map Intelligence CD for more
information.
Map Intelligence Dashboard Client Manual
90
The Selection tool uses delimiters to separate characters when it is being sent back to the BQY.
The default separators are shown in the fig below. If these characters appear in your selected
data, you will need to configure new delimiters. You can configure your delimiters by going to
View > Unhide Section and selecting the QIQ Comms Configuration section.
Fig 48. Delimiter characters for Columns and Rows.
10. Select QIQ Retrieval Configuration frame from the Navigation drop-down menu, at the top left of the screen.
Map Intelligence Dashboard Client Manual
91
Fig 49. QIQ Retrieval Configuration frame.
POINT LAYERS
1.
The Layer drop-down list will list all Point layers in the dashboard. Select a layer from the drop-down list.
The Column drop-down list contains a list of all valid columns. A valid column is a limit column with
no number formatting applied to it, that has been specified as a Data Column in the Point Layer
Configuration Screen.
Map Intelligence Dashboard Client Manual
92
2.
From the Column drop-down list, select a column then click the Set button. The selected layer name and the
selected column will appear in the panel below. Columns in this panel will be brought back as filters in the
dashboard when a selection request is made for the selected layer. To remove the settings click the Remove
button.
If the column you have added contains a number or date format a warning message
will appear.
Fig 50. Selected columns for House Listings layer.
3.
Click the Apply button.
Clicking the Apply button only applies the specified settings. It does not save the
underlying BQY. Users should save the BQY regularly to avoid loss of data.
REGION LAYERS
1.
In the Internal Layer field, enter the built-in map layer.
Click the Show Available Layers button to get a list of the built-in map layers for the
selected map. The Map Intelligence Query Tool page will appear. Select your map
file from the Choose Map drop-down list and select a map layer from the Choose
Layer drop-down list.
2.
In the Region ID Column field, specify the built in map layer column that contains the regions you wish to
select.
Map Intelligence Dashboard Client Manual
93
3.
From the Table Name drop-down list select the Results / Table section that contains the column you wish to
filter.
4.
From the Reference Column drop-down list select the column you wish to filter. The values in this column
should match the values in the Region ID Column.
The Reference Column drop-down list contains a list of all valid columns. A valid column is a limit
column with no number formatting applied to it. Data from the Region ID column is used to set
limits in the Reference column, therefore the data must match exactly, including the case and white
spaces.
Internal layers and the Region ID column are case sensitive. You can check the case by clicking the
Show Available Layers button and viewing the layer.
Valid limit columns can be set in the QIQFilter properties section of the dashboard –
please refer to the Hyperion Dashboard Builder User Manual for full information.
The panel below the drop-down lists will show the region selection configuration in
the following order:
Internal Layer: Region ID Column: Table Name: Reference Column
5.
Click the Add button, the settings will appear in the panel below. To remove the settings, click the Remove
button.
Fig 51. Selected columns for House Listings layer.
Map Intelligence Dashboard Client Manual
94
6.
Click the Apply button.
Clicking the Apply button only applies the specified settings. It does not save the
underlying BQY. Users should save the BQY regularly to avoid loss of data.
CONFIGURE LAYER ASSOCIATION
The Layer Association Configuration screen lets you to associate particular layers with particular sections of your
dashboard. When displaying the map from a particular section only the layers associated with that section will be
displayed. This allows you to display layers with information relevant to that section and will take less processing
time.
Fig 52. QIQ Layer Association Configuration Frame
Map Intelligence Dashboard Client Manual
95
1.
Select the QIQ Layer Association Configuration frame from the Navigation drop-down menu at the top left of
the screen.
2.
From the Select a Layer drop-down list, select the layer you wish to associate sections with.
Information about the layer is displayed in the Layer Info panel to the right of the screen. You can
view the layer configuration screen by clicking on the Go to layer button.
By default, Map Intelligence auto associates all available sections with the layer. These associated
sections are listed in the Associated Sections list.
3.
To disassociate a layer from a section, the Auto associate layers check box should be unchecked, then in the
Associated Sections list box, select the sections(s) you wish to disassociate with the layer and click the left
arrow button
4.
. The section will now appear in the Sections list and will not be associated with the layer.
To associate a layer with a section, the Auto associated layers check box should be unchecked, then in the
Sections list box, select the section(s) you wish to associate with the layer and click the right arrow button
. The section will now appear in the Associated Sections list box.
Multiple selections can be made from either list by using the Control or Shift keys.
When a section has been selected in either the Sections or Associated Sections lists, the
information panel below the lists displays the selected section name(s) and the layers associated
with the section.
In the example below taken from a Property House Sales dashboard, the dashboard section Average Price
by Year and Postcode did not include any data regarding the Selling Agents, therefore the Map
Intelligence layer Agents has not been associated with this section. When the map is viewed from the
Average Price by Year and Postcode section the points indicating the location of the Agents offices will
not be displayed.
Map Intelligence Dashboard Client Manual
96
Fig 53. QIQ Layer Association Configuration Frame showing associated layers.
ADVANCED TOPICS
See separate appendix document.
Map Intelligence Dashboard Client Manual
98
APPENDIX A – SUPPORTED ENCODINGS
Basic Encoding Set (contained in lib/rt.jar) Supported by java.nio, java.io and java.lang APIs
Canonical Name for Canonical Name for java.io
java.nio API
and java.lang API
Description
US-ASCII
ASCII
American Standard Code for Information
Interchange
windows-1250
Cp1250
Windows Eastern European
windows-1251
Cp1251
Windows Cyrillic
windows-1252
Cp1252
Windows Latin-1
windows-1253
Cp1253
Windows Greek
windows-1254
Cp1254
Windows Turkish
windows-1257
Cp1257
Windows Baltic
ISO-8859-1
ISO8859_1
ISO 8859-1, Latin Alphabet No. 1
ISO-8859-2
ISO8859_2
Latin Alphabet No. 2
ISO-8859-4
ISO8859_4
Latin Alphabet No. 4
ISO-8859-5
ISO8859_5
Latin/Cyrillic Alphabet
ISO-8859-7
ISO8859_7
Latin/Greek Alphabet
ISO-8859-9
ISO8859_9
Latin Alphabet No. 5
ISO-8859-13
ISO8859_13
Latin Alphabet No. 7
ISO-8859-15
ISO8859_15
Latin Alphabet No. 9
KOI8-R
KOI8_R
KOI8-R, Russian
UTF-8
UTF8
Eight-bit UCS Transformation Format
UTF-16
UTF-16
Sixteen-bit UCS Transformation
Format,byte order identified by an optional
byte order mark
UTF-16BE
UnicodeBigUnmarked
Sixteen-bit Unicode Transformation
Format, big-endian byte order
UTF-16LE
UnicodeLittleUnmarked
Sixteen-bit Unicode Transformation
Format, little-endian byte order
Not Available
UnicodeBig
Sixteen-bit Unicode Transformation
Format, big-endian byte order, with byteorder mark.
Not available
UnicodeLittle
Sixteen-bit Unicode Transformation
Format, little-endian byte order, with byte
order mark.
Map Intelligence Dashboard Client Manual
99
Extended Encoding Set (contained in lib/charsets.jar)
Supported by java.nio, java.io and java.lang APIs
Canonical Name for Canonical Name for java.io
java.nio API
and java.lang API
Description
windows-1255
Cp1255
Windows Hebrew
windows-1256
Cp1256
Windows Arabic
windows-1258
Cp1258
Windows Vietnamese
ISO-8859-3
ISO8859_3
Latin Alphabet No. 3
ISO-8859-6
ISO8859_6
Latin/Arabic Alphabet
ISO-8859-8
ISO8859_8
Latin/Hebrew Alphabet
windows-31j
MS932
Windows Japanese
EUC-JP
EUC_JP
JISX 0201, 0208 and 0212, EUC encoding
Japanese
x-EUC-JP-LINUX
EUC_JP_LINUX
JISX 0201, 0208 , EUC encoding
Japanese
Shift_JIS
SJIS
Shift-JIS, Japanese
ISO-2022-JP
ISO2022JP
JIS X 0201, 0208, in ISO 2022 form,
Japanese
x-mswin-936
MS936
Windows Simplified Chinese
GB18030
GB18030
Simplified Chinese, PRC standard
x-EUC-CN
EUC_CN
GB2312, EUC encoding, Simplified
Chinese
GBK
GBK
GBK, Simplified Chinese
ISCII91
ISCII91
ISCII91 encoding of Indic scripts
x-windows-949
MS949
Windows Korean
EUC-KR
EUC_KR
KS C 5601, EUC encoding, Korean
ISO-2022-KR
ISO2022KR
ISO 2022 KR, Korean
x-windows-950
MS950
Windows Traditional Chinese
x-MS950-HKSCS
MS950_HKSCS
Windows Traditional Chinese with Hong
Kong extensions
x-EUC-TW
EUC_TW
CNS11643 (Plane 1-3), EUC encoding,
Traditional Chinese
Big5
Big5
Big5, Traditional Chinese
Big5-HKSCS
Big5_HKSCS
Big5 with Hong Kong extensions,
Traditional Chinese
TIS-620
TIS620
TIS620, Thai
Map Intelligence Dashboard Client Manual
100
Extended Encoding Set (contained in lib/charsets.jar)
Supported by java.io and java.lang APIs
Canonical Name
Description
Big5_Solaris
Big5 with seven additional Hanzi ideograph character mappings for
the Solaris zh_TW.BIG5 locale
Cp037
USA, Canada (Bilingual, French), Netherlands, Portugal, Brazil,
Australia
Cp273
IBM Austria, Germany
Cp277
IBM Denmark, Norway
Cp278
IBM Finland, Sweden
Cp280
IBM Italy
Cp284
IBM Catalan/Spain, Spanish Latin America
Cp285
IBM United Kingdom, Ireland
Cp297
IBM France
Cp420
IBM Arabic
Cp424
IBM Hebrew
Cp437
MS-DOS United States, Australia, New Zealand, South Africa
Cp500
EBCDIC 500V1
Cp737
PC Greek
Cp775
PC Baltic
Cp838
IBM Thailand extended SBCS
Cp850
MS-DOS Latin-1
Cp852
MS-DOS Latin-2
Cp855
IBM Cyrillic
Cp856
IBM Hebrew
Cp857
IBM Turkish
Cp858
Variant of Cp850 with Euro character
Cp860
MS-DOS Portuguese
Cp861
MS-DOS Icelandic
Cp862
PC Hebrew
Cp863
MS-DOS Canadian French
Cp864
PC Arabic
Cp865
MS-DOS Nordic
Cp866
MS-DOS Russian
Cp868
MS-DOS Pakistan
Cp869
IBM Modern Greek
Cp870
IBM Multilingual Latin-2
Map Intelligence Dashboard Client Manual
101
Canonical Name
Description
Cp871
IBM Iceland
Cp874
IBM Thai
Cp875
IBM Greek
Cp918
IBM Pakistan (Urdu)
Cp921
IBM Latvia, Lithuania (AIX, DOS)
Cp922
IBM Estonia (AIX, DOS)
Cp930
Japanese Katakana-Kanji mixed with 4370 UDC, superset of 5026
Cp933
Korean Mixed with 1880 UDC, superset of 5029
Cp935
Simplified Chinese Host mixed with 1880 UDC, superset of 5031
Cp937
Traditional Chinese Host miexed with 6204 UDC, superset of 5033
Cp939
Japanese Latin Kanji mixed with 4370 UDC, superset of 5035
Cp942
IBM OS/2 Japanese, superset of Cp932
Cp942C
Variant of Cp942
Cp943
IBM OS/2 Japanese, superset of Cp932 and Shift-JIS
Cp943C
Variant of Cp943
Cp948
OS/2 Chinese (Taiwan) superset of 938
Cp949
PC Korean
Cp949C
Variant of Cp949
Cp950
PC Chinese (Hong Kong, Taiwan)
Cp964
AIX Chinese (Taiwan)
Cp970
AIX Korean
Cp1006
IBM AIX Pakistan (Urdu)
Cp1025
IBM Multilingual Cyrillic: Bulgaria, Bosnia, Herzegovinia, Macedonia
(FYR)
Cp1026
IBM Latin-5, Turkey
Cp1046
IBM Arabic - Windows
Cp1047
Latin-1 character set for EBCDIC hosts
Cp1097
IBM Iran (Farsi)/Persian
Cp1098
IBM Iran (Farsi)/Persian (PC)
Cp1112
IBM Latvia, Lithuania
Cp1122
IBM Estonia
Cp1123
IBM Ukraine
Cp1124
IBM AIX Ukraine
Cp1140
Variant of Cp037 with Euro character
Cp1141
Variant of Cp273 with Euro character
Cp1142
Variant of Cp277 with Euro character
Map Intelligence Dashboard Client Manual
102
Canonical Name
Description
Cp1143
Variant of Cp278 with Euro character
Cp1144
Variant of Cp280 with Euro character
Cp1145
Variant of Cp284 with Euro character
Cp1146
Variant of Cp285 with Euro character
Cp1147
Variant of Cp297 with Euro character
Cp1148
Variant of Cp500 with Euro character
Cp1149
Variant of Cp871 with Euro character
Cp1381
IBM OS/2, DOS People's Republic of China (PRC)
Cp1383
IBM AIX People's Republic of China (PRC)
Cp33722
IBM-eucJP - Japanese (superset of 5050)
ISO2022_CN_CNS
CNS11643 in ISO 2022 CN form, Traditional Chinese (conversion
from Unicode only)
ISO2022_CN_GB
GB2312 in ISO 2022 CN form, Simplified Chinese (conversion from
Unicode only)
JISAutoDetect
Detects and converts from Shift-JIS, EUC-JP, ISO 2022 JP
(conversion to Unicode only)
MS874
Windows Thai
MacArabic
Macintosh Arabic
MacCentralEurope
Macintosh Latin-2
MacCroatian
Macintosh Croatian
MacCyrillic
Macintosh Cyrillic
MacDingbat
Macintosh Dingbat
MacGreek
Macintosh Greek
MacHebrew
Macintosh Hebrew
MacIceland
Macintosh Iceland
MacRoman
Macintosh Roman
MacRomania
Macintosh Romania
MacSymbol
Macintosh Symbol
MacThai
Macintosh Thai
MacTurkish
Macintosh Turkish
MacUkraine
Macintosh Ukraine
Map Intelligence Dashboard Client Manual
103
GLOSSARY
Area Group Layer
Area Group layers correspond to existing areas on a map. The displayed theme is based on data attribute values, no
spatial calculation is required. Instead, a column in your business data is designated to have values that match a
column in the map data. For example, an existing map layer of suburbs may correspond to a data column for
suburbs where the values are the suburb names. Then, for transaction data that represents customer complaints
and that also contains a suburb column, it is possible to make a cross-reference between the transaction and the
map area using the suburb name. An example that would use this correlation is displaying a theme on a suburb's
area on the map that reflects the most common complaint type received from that suburb.
BQY
A BQY is a Hyperion Intelligence (formerly Brio) document.
Built-in Layer
A built-in layer is defined by the map on the mapping server rather than the Map Intelligence Dashboard Client.
These layers may contain all types of feature such as lines, points and regions e.g. cities, rivers and parks.
Component
A component is one or more Hyperion Intelligence sections that can be combined using the Merge feature of
Hyperion Intelligence Dashboard Builder to produce reusable templates that offer a variety of capabilities and
features. Map Intelligence is an example of a component.
Coordinate Systems
A coordinate system provides a frame of reference for measuring locations on the surface of the earth. A full list of
acceptable coordinate systems is available in the Coordinate Systems document found on the Map Intelligence CD.
Dashboard
A dashboard is a collection of metrics and indicators, which together provide an interactive overview or a snapshot
of your business.
Map Intelligence Dashboard Client Manual
104
Data Columns
Data Columns are columns in a result set that are sent to the Map Intelligence Server and have their values
available in the Mapping Viewer. Data column values are displayed in the map data screen and popups that appear
when you move your mouse over a point in the map. Data columns can also be used as fact or theme columns.
Ellipsoid
An ellipsoid is a mathematical shape that approximates the size and shape of the earth and is created by rotating
an ellipse about its minor axis. The earth is flattened slightly at the poles due to its rotation and an ellipse best
represents this shape.
ESM
An ESM (Editable Source Master) dashboard has all the code and structures required by the Wizard at build time
and by the dashboard at run time. ESMs can be opened, modified and enhanced by the Wizard.
Fact Columns
A fact column is a data column that can have a string or numeric aggregation applied to it by a Relationship layer.
Fact Point Layer
A fact point layer is a Point layer that you wish to apply an aggregation function to. The points in this layer will be
measured and the result will be compared against the threshold, specifying the color to assign to the circle or
region.
Frame Templates
A frame template is the basis from which frames are created in Hyperion Intelligence Dashboard Builder. A
Hyperion Intelligence Dashboard Builder Template can contain many different frame templates.
Hatching
Hatching is overlaying a pattern on top of a polygon allowing it to be distinguished visually rather than by using
color.
Map Intelligence Dashboard Client Manual
105
Hyperion Intelligence Dashboard Builder
Hyperion Intelligence Dashboard Builder is a wizard-driven application builder that lets you develop dashboards
without any programming, drastically reducing development and maintenance time. Hyperion Intelligence
Dashboard Builder lets you create dynamic digital dashboards that provide real time and scheduled access to key
performance indicators, operational analysis, and strategic management reports in an easy-to-use web format.
Hyperion Intelligence Dashboard Builder Template
A Hyperion Intelligence Dashboard Builder Template is the starting point for the development of a dashboard using
Hyperion Intelligence Dashboard Builder.
Icons
Icons are used to visually represent points on a map. Icons can be symbols (image files) selected by the user or
colored shapes that reflect the bars of a chart in the dashboard.
Images (See Icons)
Layers
A layer is a set of spatial features displayed on a map. Objects in a layer are usually grouped logically e.g. capital
cities or parks. Each feature in a layer has the same set of data attributes, so a layer is in many ways like a relation
(table) in a relational database.
Map Intelligence Dashboard Client
A Map Intelligence Dashboard Client is a BQY that allows configuration of Map Intelligence layers and has the
ability to launch and interact with the Mapping Viewer.
Map Intelligence Layer
A Map Intelligence Layer is a layer defined in the Map Intelligence Dashboard Client. These layers display data in a
result set as geographic features on a map.
Map Intelligence Server
The Map Intelligence Server is the engine that takes requests from the Map Intelligence Dashboard Client and
Mapping Viewer and responds by displaying maps and associated information.
Map Intelligence Dashboard Client Manual
106
Mapping Viewer
The Mapping Viewer displays the layers configured by the Dashboard Designer on the specified map. The Mapping
Viewer is launched in a browser and provides controls that allow the end user to manipulate the map to return the
desired analysis.
Point
A point is a geographic feature with a single pair of coordinates. These are used to represent objects or events e.g.
house or accident locations.
Point Layer
Point layers are map layers where data is represented on the map as discrete point images or symbols. For
example: a particular layer might represent the location of stores as push-pin icons and another layer could
represent accidents as colored dots, where the color (theme) represents the severity of the accident. Typically, the
rows in a table of data belong to a business concept such as people or address details, where each column is an
attribute of that concept. Thus each row in your business data can be represented as an individual point in a point
layer. In Map Intelligence, point layers form the foundation for relationship layers.
Radius Relationship Layer
Radius relationship layers are circular regions with themes around certain points of interest that show information
about other points that fall within that circular region. These layers are generated by Map Intelligence. They are
based on calculations made by Map Intelligence on the specified data values as specified by the layer designer. For
example: different colored circles indicate the average house price within half a kilometer of a proposed waste
plant. Another example is where different colored circles indicate the number of burglaries that have occurred
within a five-mile distance of houses belonging to known burglars. In the current version of Map Intelligence, the
circle center points (eg: houses belonging to known burglars) and the data being analyzed (burglaries), must be
point layers.
Regional Relationship Layer
A Region Relationship layer corresponds to a map area of any shape that is solely geographical in its definition and
not generated by Map Intelligence. Examples would be suburbs, zip codes, local government areas or police
precincts. Region Relationship layers can be given themes according to specified data rules associated with the
points that fall within that region. An example of such a theme could be color-coding precincts according to the
number of crimes that have taken place within their boundaries, or applying different hatches to suburbs based on
the total value of house sales that have occurred in each one. Map Intelligence works out in which region a point
(eg: a sale or accident) physically belongs by doing a spatial calculation.
Map Intelligence Dashboard Client Manual
107
Relationship Layer
For further information see: Radius Relationship Layers and Regional Relationship Layers
Results Set
A Results Set is a Results or Table section in a BQY that contains data available to a Map Intelligence layer.
Theme
A theme can be described as a representation of map features according to different associated values.
Map Intelligence Dashboard Client Manual
108
INDEX
Advanced Topics
Auto Pilot Mode, 79
Aggregation Options, 62
Relationship Layer, 54
Retrieval Configuration, 72
Server Point Layer, 49
Server Settings, 17
Displaying Null Values, 70
Numeric, 62
String, 68
Visual Theme Properties, 62, 66
Area Group Layer
Configure, 58
Delete, 61
Description, 11
Auto Pilot Mode, 79
BQY, 97
Coordinate System, 97
Dashboard, 97
Configuration, 21
Configure Map Intelligence Buttons, 22
Embedding the Mapping Viewer, 25
Merge to Dashboard, 21
Upgrading, 27
Data Columns
Configure, 38, 46, 53
Description, 97
Built-in-Layer, 97
Client Administrators, 6
Component, 97
Configuration
Aggregation Options, 62
Client Administrator, 15, 16
Database Point Layer
Configuration, 44
Editable Source Master (ESM)
Description, 98
Ellipsoid, 98
ESM, 98
Layer Designer, 15, 21
Prerequisites, 14
Process, 15
Configuration Frames
Area Group Layer, 58
Fact Columns
Configure, 59
Description, 98
Fact Point Layer, 98
Comms Configuration, 72
Frame Templates, 98
Database Point Layer, 44
Hatching, 98
iServer Settings, 33
Hyperion Intelligence Dashboard Builder, 98
Layer Association, 76
Layer for Selections, 72
Hyperion Intelligence Dashboard Builder
Template, 98
Map Settings, 29
Point Layer, 35
Icons, 99
Map Intelligence Dashboard Client Manual
109
iServer Settings, 33
Map Intelligence Server, 99
Layer
Map Settings, 29
Designers, 6
Layer Association
Configure, 76
Layer Designers, 6
Layers, 99
Area Group, 58, 97
Mapping Viewer, 99
Accessing
From Dashboard Client, 12
Definition, 11
Point, 99
Point Layer
Configure for Selections, 72
Configuration, 35
Database Point Layers, 44
Delete, 43, 48, 53
Definition, 7
Description, 8
Layer Association, 76
Layer Types, 8
Area Group Layers, 11
Point Layers, 8
Radius Relationship Layers, 9
Region Relationship Layers, 10
Relationship Layers, 9
Relationship Layers
Configure, 54
Delete, 57
Description, 9
Radius Relationship Description, 9
Region Relationship Description, 10
Results Set, 100
Overview, 34
Point, 35, 99
Radius Relationship, 100
Relationship, 54, 100
Server Point Layer, 49
Map Intelligence Component
Server Administrators, 6
Server Point Layer
Configuration, 49
Server Settings, 17
Themes, 100
BQY to Component, 19
Configure Settings, 16
Merge, 16, 21
Map Intelligence Dashboard Client, 99
Types of User
Client Administrators, 6
End Users, 6
Layer Designers, 6
Map Intelligence Layer, 99
Server Administrators, 6
Map Intelligence Dashboard Client Manual
110