1
EFESCONS
Anadolu Efes Financial Consolidation and
Reporting Project
User Manual
2013
Last Update
26 November 2013
Table of Contents
Introduction ............................................................................................................................................................. 3
Prepare your computer ........................................................................................................................................... 4
About working environment ................................................................................................................................... 5
Web interface...................................................................................................................................................... 5
Login Page ....................................................................................................................................................... 5
Home Page ...................................................................................................................................................... 6
Home Page Menu Items ................................................................................................................................. 7
HFM Application – Document Window .......................................................................................................... 8
HFM Application Menu Items ......................................................................................................................... 9
HFM Application – Data Entry Form ............................................................................................................. 10
HFM Application – Data Entry Form – Right Click Menu .............................................................................. 11
HFM Application – Data Entry Form – Member Selection Dialog................................................................. 13
HFM Application – Process Control .............................................................................................................. 14
Financial Reporting – Report Explorer .......................................................................................................... 15
Financial Reporting – Menu Items ................................................................................................................ 16
Excel Interface ................................................................................................................................................... 17
How to Use Oracle Hyperion Products .................................................................................................................. 18
WEB Interface ................................................................................................................................................... 18
Oracle HFM Basic Actions ............................................................................................................................. 18
Oracle HFM – Run Consolidation .................................................................................................................. 27
Oracle HFM – Manage Ownership ................................................................................................................ 30
Excel Interface / Smartview .............................................................................................................................. 40
Excel Interface – Basic Actions...................................................................................................................... 40
Excel Interface – Report Import .................................................................................................................... 44
Excel Interface – Ad-Hoc Analysis ................................................................................................................. 49
Excel Interface – Smartview Excel Formulas................................................................................................. 53
Excel Interface - Smartview in MS Word and PowerPoint ............................................................................ 57
Excel Interface – Smartview VBA Script ........................................................................................................ 58
Process flows ......................................................................................................................................................... 59
IFRS consolidation and reporting process ......................................................................................................... 59
Management consolidation and reporting process .......................................................................................... 59
Introduction
This document is the main reference guide for EFESCONS (Anadolu EFES Financial Consolidation and Reporting Project)
users. It contains all information to use HFM (Oracle Hyperion Financial Management) tool which is selected as a main
consolidation tool. The content is written considering all type of users, so you may see some sections in this document
actually you do not authorized to use them.
If you want to get more information about the Oracle’s consolidation tool, you can download Oracle’s user documents
with the links below.
Oracle Hyperion Financial Management User Guide
https://efescons.anadoluefes.com/docs/hfm_user.pdf
Oracle Smartview (Microsoft Office Add-in) User Guide
https://efescons.anadoluefes.com/docs/smart_view_user.pdf
Prepare your computer
The link below contains the instructions to prepare your computer to use HFM.
https://efescons.anadoluefes.com/docs/Anadolu_EFES_Financial_Consolidation_and_Reporting_Project__Guide_for_pre
paring_a_user_computer.pdf
About working environment
As a user, you will use two kinds of environment. The first one is web interface. You need to use Internet Explorer or
Firefox to use this web interface. Oracle calls it as “Oracle Enterprise Performance Management System Workspace” or
“Oracle Hyperion Workspace”. The second one is Microsoft Excel interface. You need to install a small Add-In to use
Microsoft Interface.
All users should do some settings on their computer to use these environments. You can find information about these
settings at the “Prepare your computer” section of this document.
Web interface
Login Page
1
2
1
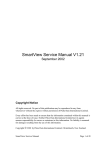
Login Dialog:
HFM asks username and password to protect your financial data. You need to use login dialog to enter your
username and password
2
Internet Explorer Zoom Level:
Internet Explorer zoom level should always be 100%.
Home Page
5
4
6
7
1
3
2
1
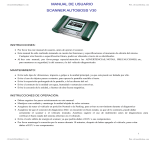
Recently opened documents:
This section dynamically changes for each user. This section displays applications and reports which are used
by you recently.
2
Workspace pages:
We do not have any content in this section. This section displays special designed Oracle EPM Workspace
pages. They should be designed using Oracle EPM Workspace API.
3
3
4
3
5
3
6
3
7
3
Quick links:
This section contains your Oracle EPM Applications. In our environment, it only contains EFESCONS HFM
application.
Menu bar:
This menu bar contains commands you need to use Oracle EPM products. Content of these menus will be
explained in next sections of this document. The menu items are dynamic and they changes depending on the
active application in Oracle EPM Workspace.
Information bar:
This section contains information of logged in user. In addition to that, there is a Log Off link which provides
user to exit from system properly.
Search box:
You can search reports using this box
Tool bar:
This section contains shortcut buttons of specific menu item commands. Content of the menu bar changes
according to active application in Oracle EPM Workspace. The functions of the tool bar icons as follows;
Open Home Page,
repository window.
Create new workspace document,
Open report,
Open report
Home Page Menu Items
Navigate Menu
Applications:
You can start Oracle EPM Applications with the help of this menu item.
Explorer:
This item opens report repository which you can open reports by selecting from it.
File Menu
Preferences:
You can change your user specific settings with this option. For example; decimal separator
character in the HFM.
Log Off:
This option is used to exit all system properly.
Exit:
You can close active application in the Oracle EPM by selecting this option.
Favorites Menu
Add to Favorites:
You can add the active content to your favorite list. Your favorites will be listed in “Quick
Links” section of “Home Page”
Manage Favorites:
This option is used to change your favorite items.
HomePage:
This option opens your home page in the workspace.
Tools Menu
Install:
You can download Oracle EPM client tools with this option but we recommend you to use
the instructions in the user manual always.
Help Menu
This menu contains hyper-links to Oracle Product Documentation
Portal.
HFM Application – Document Window
1
4
2
3
1
2
3
3
4
3
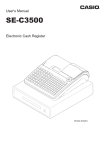
Application tasks:
This section contains shortcuts to data input screens and HFM process management screens. These screens
are grouped in “task lists”. A task list contains all necessary screens for a specific reporting period.
Favorites:
You can add frequently used HFM forms in this area by right click and add to favorite command.
Documents:
This section contains all HFM data entry forms in folder structure. These screens are the same screens listed
under task lists. The content of this section may change depending on user rights.
Filters:
This section contains filter options which controls “Documents” section. Document section lists contents
according to filter settings in this area.
HFM Application Menu Items
Documents:
This option opens HFM “Documents” dialog.
Journals:
This item contains options to manage and create journal entries. These options
are necessary for consolidation users, so they may not be seen by other type of
users.
Data:
This section contains functions to manage financial data directly. You can bulk
copy or delete your data with these options. These options may cause data lost.
Load:
You can load your financial data to a specific formatted text file with this option.
Extract:
You can extract your financial data to a specific formatted text file with this option.
HFM Application – Data Entry Form
1
2
3
4
1
Tool bar:
This toolbar contains options to use HFM data entry form. Purposes of these options as follows;
This options contains a menu which has the same options in the toolbar,
(this option is only available for admin users),
Create a new data entry form
Save data input form design changes (this option is
available when an admin user changes the screen design),
Save data input form design changes as a
different form (this option is available when an admin user changes the screen design),
Execute the
screen design and show end-user view of the form (this option is available for admin users and it is activated
when the admin switch to design view),
for admin users),
Switch to visual design view of the form (this option is available
Switch to script design view of the form (this option is available for admin users),
Save data changes to HFM server,
Refresh financial data from HFM server,
Calculate data form (this
option executes HFM rules on the server, these calculations are necessary to create BS and PL tables and
check validations. Calculate command runs intelligent calculation. It means if you did not any change any data
from the last calculation and click on calculate button. HFM automatically understand nothing has changed
on server and the results should be same and does not run calculation twice),
Force calculate (This
option does not take into account the intelligent calculation. It always runs calculations whether data has
changed or not. Intelligent calculation always checks current year, period, entity and value members for data
changes. If previous period’s data has changed, you may need to recalculate this period values because of
movement tables. In this case intelligent calculation does not understand “previous period has changed and
there is a movement effect this period so I need to calculate this period also”. You need to use Force calculate
in such cases),
open row suppression options,
and column suppression options,
dialog,
print data form,
open column suppression options,
open cell text (comment) entry dialog,
open this data form in Excel as Smartview screen,
open both row
open data form instructions
you can copy URL of
the current data form to create link to this data form in HFM,
enable/disable one click data entry (in
normal settings, you need to click twice on data cells for data entry. You can change this setting as one click
data entry with this option.)
2
3
3
3
4
3
POV (Point of View):
This section contains point of view selection links. HFM stores financial data in multi-dimensional format. But
HFM data forms have two dimensions; rows and columns. HFM creates virtual data pages to display multidimensional data on two dimension data forms. POV section helps user switch between different data pages.
Number of dimensions listed on POV section depends on form design. If you click on a dimension name on
the POV section, A member selection dialog will be open.
Data Form Grid:
This section contains data cell grids. You can input and view financial data here. Color of the data cells has a
special meaning. You can learn this meaning from legend section.
Legend:
This section contains color code meanings of the data cells.
HFM Application – Data Entry Form – Right Click Menu
Content of this menu changes according to selected Entity and Value dimension members.
Cell Information:
Gives detailed information about selected data cell.
Cell Text:
Opens cell text / comment entry dialog.
Force Calculate
This option is the same option on the tool bar.
Lock
Lock data cell for further data entry. This option may prevent some calculation so only
specific type of users can lock data cells.
Unlock
Unlock locked data
Manage Process
Opens manage process dialog.
Entity Details
Gives detailed information about selected entity.
Cell History
Gives detailed log about data changes on current data cell.
Consolidate
Run consolidation for parent entities. This option runs intelligent calculation during
consolidation. If no data changes, this option does not run consolidation (This option is
only available for consolidation users)
Consolidate All With Data
Run consolidation only for entities which has data. (This option is only available for
consolidation users)
Consolidate All
Run consolidation for all entities. (This option is only available for consolidation users)
Translate
Run currency translation.
HFM Application – Data Entry Form – Member Selection Dialog
1
2
3
4
1
2
3
3
3
4
3
Dimension Selection:
If HFM data form has more than one dimension on POV section, you can change selected dimension from this
option to change selected member for it.
Dimension Content:
You can view all member content of the selected dimension and select any member to add “Member
Selection” section.
Member Selection:
This section lists all selected members for all POV dimensions.
Selection Buttons:
In order to select a member for a POV, you need to find a member from the “Dimension Content” section and
select it. After that, you need to click on right-blue-arrow to add this member to “Member Selection” section.
You can use left-blue-arrow to remove selected member.
HFM Application – Process Control
1
2
3
4
1
Tool bar:
This section contains function shortcuts for process control window. The function of the buttons as follows;
opens detailed process control menu,
system),
this option opens “Ownership Management” screen which is used by consolidation admin.
refreshes process management grid,
submit, approve, publish, sign off, reject),
run calculations,
2
3
3
3
4
3
opens currency rate form (this is unavailable in this
displays the options to change process status (start, promote,
displays options to run consolidation,
display options to run translations.
POV:
You should select the POV section which you want to manage process status.
Process Control Grid:
This section lists all selected members for all POV dimensions.
Display Options:
These sections has options to change view of the process control grid.
displays options to
Financial Reporting – Report Explorer
2
1
1
2
3
Report Folders:
This section contains Financial Reporting folder structure. These folders contains Oracle Financial Reporting
Reports such as IFRS notes.
Report Folder Content:
This section displays the content of the reporting folders.
Financial Reporting – Menu Items
New:
Creates new Hyperion Workspace content.
Open:
Open Oracle Hyperion Application or Report.
Open In
Open selected report in selected format.
Close
Close opened content.
Export
Export selected report to special formatted file
Import
Import exported files into Financial Reporting.
Properties
Displays selected report’s properties.
Excel Interface
1
2
1
2
3
Smart View ribbon:
This section contains buttons to manage Smart View functions.
Connection Panel:
You can connect to Hyperion server with this panel. In addition to that you can open HFM Forms or Reports
into Excel with the help of this window.
How to Use Oracle Hyperion Products
WEB Interface
Oracle HFM Basic Actions
Open the URL http://efescons.anadoluefes.com/workspace/ on Internet Explorer and ligin to system by entering
your HFM username and password.
Click on “EFESCONS” under the “Quick Links > Applications > Consolidation” section in order to start HFM
application.
On the left side of the windows there is a small box tiled as “Task Lists”. This section contains all options you
need to use HFM. In this section currently, there are three task list “ICP Matching process” , “IFRS reporting
process” and “Management reporting process”. These task lists contains options you need to use during ICP
matching, IFRS reporting and Management reporting steps.
If you click on the plus sign left of the task lists. Different type of HFM items will be listed under it. Each type of
HFM item has different icon image.
is for folders and folders contains other folders or HFM items. icon is
for data input screens, in other words, HFM Data Forms. All other kind of HFM items have their unique icons.
You can open a data input screen (HFM Data Form) by double click or right click and select Open.
Data input screen will be opened at right side of the page. Data input screens has different sections; toolbar
section, point of view section and grid section. Grid section has different colored cells. You can input data to light
yellow cells. Greens cells are calculated values and you cannot change them. Orange colored cells mean invalid
cells and logically these cells cannot contain any data. Grey cells for section separations.
Data input screens are designed by considering reporting footnotes and relation between the accounts. Users
will use same screen even they input more than one company or reporting period values. We define point of
view section of the input screens in order to five users the ability to change the company or period they are
working on. You can see the point of view section below.
Before input any data you must sure you are on right point of view section. If not you need to change your point
of view properly. For example; I want to input data for “Coca-Cola İçecek A.Ş” so I need to click on
“Entity:G20.E100”. After that I need to find “Coca-Cola İçecek A.Ş” on the left side of the window. At the left side
of the window you see the items listed in hierarchies. You can expand this hierarchies by clicking on the plus
signs. Some items does not have plus sign on their left, these items are “base items”. You can only input data to
this base items. So I need to select E123 – Coca-Cola İçecek …” item on the left and click on the blue arrow which
directed to right and click OK. You can change other point of view items with same steps.
If you change a cell value, the color of this cell turns to dark yellow. This means you have changed the cell value
but you did not save it to the server. You will lose this data if you close the window. If you want to save this
change to the server you need to click on save button on the tool bar which is highlighted below.
HFM allows more than one user can work on same screen and same point of view area. Some times when you
work on a HFM data forms another user may change data values on same screen. If you want to see the changes
you need to refresh data form. You must click on refresh button on the toolbar.
After you input data, you must run calculations in order to see BS and PL values. To do that, you need to right
click on a data cell (yellow or green cells) and select “Calculate” or “Force Calculate”. If both options are listed
prefer “Force Calculate”.
After calculate your data you need to check your intercompany related values are consisted with your partner
values. You can use ICP Matching reports for this puspose. You can find ICP matching reports under ICP
matching process task list. If you double click on a report a parameter screen appears. In this parameter screen,
first you should select point of view for the report. Select “Override Report Definition” option at the top of point
of view section and select Point of view items. You should always select “ICP_Matching” for scenario, YTD for
View and USD for Value. Second, you should select your entity group . You need to select “Override Report
definition” options at the top of “Entity” and “ICP (Partner)” sections. You can select aspecific entity group or
simply keep them as {G40.[Base]}. Third, you should select “Override report definition” at the top of Report
Format. Select HFM_FORMAT as report format and HFM_IntercompnatDefault_new.xsl for Report template. And
last, define matcihng suppression values and select OK to run report.
A precoess status window will be displayed. You sould click on the icon at the Result column to display report.
Oracle HFM – Submit Data (Deliver Data to HQ) and Lock Data Input Screens
To lock data forms ( data inputs are completed and properly validated ) please follow below listed
steps:
Step 1: In task lists
IFRS reporting process
o Process control
Step 2: Check POV and make regarding updates
Period
Scenario
Step 3: Calculation status
Should be OK
If not , right click and
calculate.
Step 4: Validation and pass / fail status check
Both should be
If not , please check your data input and
validation screen.
Step 5: Review level
Right click on review level cell
Manage process > Submit
Step 6: Submission
After click submit as mentioned above
OK button should be selected
Step 7: Final
While review level is submitted, process will be finalized.
Please note that submitted data forms are not changed by operation.
Any update need raised, the operation should inform the HQ team and system admin will reject
regarding data form and operation can update it.
Oracle HFM – Run Consolidation
This function is only available for “Consolidation Users”. Other users cannot see necessary menu items to run
consolidation.
You can run consolidation on any data input screen. But you have to use HFM “web interface”.
Open any HFM Data Form (data input screen). Select a “Parent Entity” (Ex: G40) on Entity POV area. Select
“<Entity Currency>” on Value POV area. Select other POV members according to you needs.
Right click on any data cell and select one of “Consolidate”, “Consolidate All”, “Consolidate with Data” options.
“Running Tasks” window automatically appears and you can view the status of the consolidation on this screen.
Consolidation may take a while.
With this technic you can run consolidation only for one period, year and entity. If you want to run consolidation
for more than one period, year or entity you can use “G02 Consolidate – Translate – Calculate” data grid. This
data grid specially designed for running consolidation.
You can select more than one period or entity cell on this screen. After that, if you right click and select
“Concolidate All”, The consolidation process will start for all of selected periods and entities.
This screen also displays the calculation status of the entities. For example; CN means “Consolidation needed”.
The meanings of the calculation statuses as follows.
Oracle HFM – Manage Ownership
This function is only available for “Consolidation Users”. Other users cannot see necessary menu items to open manage
ownership screen.
You can open manage ownership screen using Consolidation > Data > Manage Ownership menu item.
On the manage ownership screen you should select right POV at first place. You need to select a parent entity to
manage ownership information. After you select a parent entity, the children of this entity will be listed on
screen. By entering data to child entity rows you can manage parent – child entity relationship.
Every column on the ownership management screen has a special purpose.
o
[ACTIVE]: This column defines weather this entity will be included into consolidation or not. If you select
“Yes”, the entity will include the consolidation. If you select “No”, HFM will ignore this entity.
o
[Method]: This column is for defining consolidation type. There is only one type consolidation method in
the system and it is EQP. If you select EQP in the Method column that entity will be consolidated
according to “Equity Pickup” method. If you select [None], the consolidation will be done according to
the values in the [PCON] column.
o
[PCON]: You can enter consolidation rate in this column.
o
[POWN]: You can enter direct + indirect ownership rate in this column. In fact, this column value can be
calculated automatically according to entities’ capital structure values.
o
[PMIN]: This column shows minority rate and it is calculated by [PCON] – [POWN]
o
[PCTRL]: This column value displays control rate on the entities. This column values does not have any
functionality on this application.
o
[DOWM]: You can enter direct ownership values in this column but this column actually can be
calculated automatically by HFM using capital structure values.
o
The rest of the columns do not have any functionality.
[POWN] and [DOWN] column values should be calculated automatically. In order to that, first open HQ Consolidation
Process > HQCP_1 Capital Structure > HQCP_1_02_Capital structure for consolidation purpose HFM data form and run
Force Calculate. By this way, you will copy user entered capital structure values to HFM System Accounts. After that open
HFM Manage Ownership screen and select “Percent Ownership” and “Direct Percent Ownership” options under the
“Calculate Ownership” section. Then select “All Entities” and select necessary periods. At last, click on “Calculate” button.
HFM will automatically calculated direct ownership rates and put it in [DOWN] column and calculate direct + indirect
ownership and put it in [POWN] column.
Oracle HFM - Manual Journal creation process
1) Open period for journal creation
Before creating journals, it should be ensured that period is opened for journal entry. Please do not confuse about period
“open for data entry” and “period open for journals”. They have different process management screens and flow. Even if
the period is close for data entry, user can open periods for journal creation.
In order to open periods, please follow the steps below:
Click Consolidation>Journals>Periods
When it is clicked on “Periods” tab, the screen
on the left will appear. Selectable Point of
Views (POVs) are only “Scenario” and “Year”
dimensions. After ensuring the scenario and
year selection, desired period can be opened
for journal creation by right clicking on period
and click “Open” button.
Important Note:
If the period is unopened, user cannot create
any journals for the period.
If the period, which is opened before, is closed,
the existing journals are still valid but changing
the journals is not allowed.
2) Manage Journals
After opening the period, you will be able to create journals.
In order to create journals, please follow the steps below:
Click Consolidation>Journals>Manage
By clicking “Manage” tab, initial POV options automatically appears; Scenario, Year, Period and Value. These POVs should
be correctly set because one step forward changing POVs will not allowed.
“Scenario” and “Value” POVs are important in order to
manage manual journals. “Scenario” POV clearly defines
the journal posting into which scenario. “Value” is more
complicated dimension.
Please refer to “Consolidation Admin Manual“ for details of
VALUE dimension.
3) Journals creation
Step-1: Click Actions>Journal
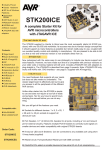
4
1
2
1
3
1
Manual journals can be created both on groups and entities. When the “Entity” is selected, “Currency” appears as the defined currency which is local
currency for the entities and reporting currency for the groups.
2
3
Journal’ information requires “Account”, “Description” and “Debit or Credit amount”.
When it is double-clicked on account part, “Member Selection” screen appears. From that window, it is required to define applicable account number, ICP and
customs 1-6 information for the selected line. Please ensure that the selected information matches with HFM screens for the selected scenario.
After completion of all steps aforementioned, the journal should be saved. Also the screen allows users to scan, print, delete and reset the entered data.
4
When the journal is saved, it will appear on “Manage Journals” screen and the status is “Working”. In
order to see the results, system requires a submission process. Submit > Approve > Post. Journals,
not posted, do not appear on financials or any disclosures.
W
When it is clicked on “Reports” tab, journal reporting screen appears. Requested journals can be
reported in HTML, .pdf or excel format with sorts of information such as account info, custom info,
submission/approval/post date and responsible etc.
W
36
Oracle Hyperion Reporting – Use Reports
37
Login to Oracle EPM Workspace and click on “Explore” button.
Folder structure of the report repository will be appear. Select desired report and double click on it
38
Select report POV.
The report will be appear in HTML format.
You can convert the report PDF format by click on PĞDF icon in the toolbar.
39
You can save the report on your computer as a static PDF report by click on the Acrobat Reader save
button.
Excel Interface / Smartview
Excel Interface – Basic Actions
40
Start Excel and open Smartview ribbon.
First you need to connect HFM server. Select “Panel” item on the Smartview ribbon and select “Shared
Connection” at the window opened right side of Excel.
41
Enter HFM password
Select “Oracle Hyperion Financial Management…” item from the right side of the window.
42
Expand HYPERIONTEST>EFESCONS>Root
You can open data input screens to Excel by double click. These screens are the same screens which
are on web interface. Yellow cells are for data input and green screens are for calculated cells as in
web interface.
You can change point of view by clicking “…” option under the point of view items drop down lists.
Point of view selection dialog is similer to the web dialog.
43
You can save your data to server by clicking “Submit Data” item on the ribbon.
You can refresh data from server by clicking refresh item.
You can run calculation by clicking on Calculate > Force Calculate
You can use Excel formulas or links in data input cells. Results of these formulas and links will be
submitted to server, if you click on Submit Data button.
If you want, you can save this Excel workbook to save your linked cells and formulas and you can use
same document to upload data to HFM later.
If you want to use previously saved Excel documents which has HFM input screens in it. You need to reconnect
HFM server after open this document. Click on “Refresh” button on the Smart View ribbon is enough to
reconnect HFM server.
Excel Interface – Report Import
44
Login to Hyperion Server Using Smart View > Panel button
Select “Shared Connections” on SmartView Panel window.
45
Input your username and password, if they are asked
Select “Reporting and Analysis Framework” on drop down list.
46
Reports in the system will be listed in Folder Tree structure. Select and double-click on desired report.
A pop-up window will be appear in order to provide you the ability to select POV of the report. Select
desired POV members. In the Import Document As section you can select input format of the report.
47
After POV selection, preview of the report will be displayed in the window. You can click on Finish
button to complete report import action.
Although the imported reports are seen as static reports, they are actually still connected with
Hyperion Reporting server. If the values on the server changes, you can easily refresh your imported
report by click on “Refresh button on the SmartView ribbon.
If you weant to change selected POV of the imported report, you can click on Smartview Ribbon >
Connections > Reporting and Analysis Document> Edit menu item. After that the POV selection
window appears again and you can change POV of the imported report.
48
You can also I,mport repors into Microsoft Word or Microsoft Powerpoint documents. The directions
are same as in the Excel but you can import reports as image into Word or Powerpoint documents.
You can apply “image crop” function in Ms Word on imported reports. Smartview still can refresh
cropped reports when you click on Refresh button.
Excel Interface – Ad-Hoc Analysis
This function may also provide you to change data. Data input and update is not recommended on Ad-Hoc
screens
49
Login to Hyperion Server Using Smart View > Panel button
Select “Shared Connections” on SmartView Panel window.
50
Input your username and password, if they are asked
Select Oracle Hyperion Financial Management, Fusion Edition in dropdown list.
Expand the EFESCONS application and right click on the EFESCONS application name. Select “Ad hoc
analysis” menu item.
After this section Smartviews creates a simple Ad-Hoc screen in the Excel Sheet. Ad-Hoc screens are
most likely Excel Pivot Tables. They also have columns, rows and POV selection windows. Smartview
puts Period dimention on column and Account dimention on Rows by default. All other dimentions are
listed in POV selection window.
51
You can put any dimension to column or row area by selecting in POV window and drag-drop on row
or column with left mouse button.
52
If you want to remove any dimention from row or column. You should drag-drop it back to POV
window using right mouse button.
You can type account or period codes if you know them into column or row headers directly. After you
click on Smartview refresh button, Smartview will automaticly recognizes your input and displays input
account value.
If the account in the row or column is a parent account which has detailed accounts under it. You can
display the children values by simply left double click on the account code.
You can use Excel’s row and column delete function to remove unwanted rows and colums.After this
action you have to click on refresh button.
It is highly recommended click on Smartview Refresh button after every change on the Ad-Hoc grid.
Excel Interface – Smartview Excel Formulas
53
Login to Hyperion Server Using Smart View > Panel button
54
Select “Shared Connections” on SmartView Panel window.
Input your username and password, if they are asked
Select Oracle Hyperion Financial Management, Fusion Edition in dropdown list.
55
Expand the EFESCONS application and right click on the EFESCONS application name. Select “Build
Function” menu item.
Select function that you want to use. For example HSSetValue. This function is used for to send data to
HFM application.
Input a cell referans for Data/Text field. Data in the field will be sending to the HFM application. Leave
the Connection field as it is. Then select Members in the Member List field. These members defined
the coordinates that the data will be sending to. You must define a specific member for all HFM
dimensions.
You can learn the correct members for a specific area by opening the HFM data form which contains
the data cell that you want to send data. Right click on the data cell and select Cell Information.
Process Unit section contains necessary member names for Scenario, Year, Period, Entity, Value
dimensions in that order. POV Detail section contains necessary member names for Account, ICP,
Custom1, Custom 2, Custom 3, Custom 4, Custom 5, Custom 6 in that order. View section shows the
member name for the View dimention.
When you click OK and look at the formula cell you will see a Excel formula like below. You can
manipulate the formula according to your needs. For example if you want to use the year information
from a Excel cell, you can change ….";"Year#2013";"…. Section as ….";"Year#" & D6 ;"….. By this way,
formula always retrieves year info from cell D6.
=HsSetValue(B2;"WSFN|HFM|HYPERIONTEST|EFESCONS|EFESCONS";"Scenario#IFRS";"Year#2013";"P
eriod#March";"View#YTD";"Entity#G40";"Value#<Entity Curr Adjs>";"Account#ACQ01";"ICP#[ICP
Entities]";"Custom1#[None]";"Custom2#[None]";"Custom3#[None]";"Custom4#[None]";"Custom5#[N
one]";"Custom6#ECUR")
You can get more info about Smartview Excel formulas from “Oracle Smartview Manual” document which can
be accessible on HFM web interface home page https://efescons.anadoluefes.com
56
Excel Interface - Smartview in MS Word and PowerPoint
You can import Financial Reporting reports like in Excel. Details are described in Excel Interface –
Report Import section.
You can copy any data cell reference from Excel Ad-Hoc grids and paste them into Word or PowerPoint
documents.
Create an Ad-Hoc grid in Excel and select desired data cell. Click on Copy button in the Smartview
Ribbon.
Open the Word or PowerPoint document and click on the Paste button on the Smartview ribbon. Cell
reference automatically created in the document. You can view data of this reference by click on
Smartview Refresh button. You can use this references as in-line word in sentences.
57
Excel Interface – Smartview VBA Script
You can write VBA codes to automate some functions of Smartview. You can find information about this topic
in the Oracle Smartview Manual which is accessible at https://efescons.anadoluefes.com
58
Process flows
IFRS consolidation and reporting process
START
Input Currency and
Consolidation Rates
Input Intercompany
Transaction Data
Start Period for
Data Input
Run Calculation
REJECT
YES
Approve ICT Data
Submit
Intercompany
Transaction Data
NO
Missmatched Data
Found
Run ICP Matcihng
Reports
Run Calculation
Check IFRS
Validations
APPROVE
Start IFRS Data
Input
Input IFRS Data
If Validation Error
Found
YES
REJECT
NO
Print Reports
Run Consolidation
and Lock Data
APPROVE
Approve IFRS Data
Submit IFRS Data
END
Tasks for consolidation admins
Tasks for consolidation users
59
Management consolidation and reporting process
START
Input Currency and
Consolidation Rates
Input Intercompany
Transaction Data
Start Period for
Data Input
Run Calculation
REJECT
YES
Approve ICT Data
Submit
Intercompany
Transaction Data
NO
Missmatched Data
Found
Run ICP Matcihng
Reports
Run Calculation
Check IFRS
Validations
APPROVE
Start IFRS Data
Input
Input IFRS Data
If Validation Error
Found
YES
REJECT
NO
Print Reports
Run Consolidation
and Lock Data
APPROVE
Approve IFRS Data
Submit IFRS Data
END
Tasks for consolidation admins
Tasks for consolidation users
60