1
Technical appendix
Calculating demand values
(Micrologic E)
The Micrologic E trip unit calculates and displays:
b the demand values of phase and neutral currents,
b the demand value of the total active power.
The maximum (peak) demand current and power values are stored in the memory.
All demand values are updated once every minute.
Definition
The demand value of a quantity is its average value over a given period of time.
In electrical power systems, it is used especially for the current and power.
The demand value should not be confused with the instantaneous value or the
average (or mean) value, which often refers to the average (or mean) of the
instantaneous values of the 3 phases.
Calculation interval
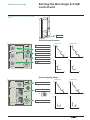
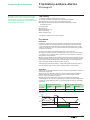
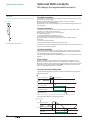
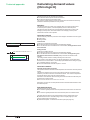
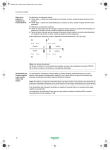
The time interval (or window) over which the average is calculated can be of 3 types:
b fixed window
b sliding window.
Interval n
Interval n + 1
Interval duration
Time shift between intervals n and n + 1
Interval n
Interval n + 1
Interval duration
Fixed window
At the end of a fixed metering window:
b the demand value over the window is calculated and updated
b the new demand value is initialised over a new window, starting from the end of
the last window.
Sliding window
At the end of a sliding window:
b the demand value over the window is calculated and updated
b the new demand value is initialised over a new window, starting from a given
time after the start of the last window (always less than the duration of the
window).
The sliding window method is used by Micrologic E control units.
b The duration of the sliding window can be set separately for current and power
demand from 5 to 60 minutes in 1 minute steps (see Measurement settings on page
32). The default setting is 15 minutes.
b The time shift between intervals is equal to 1 minute.
Calculation method
Quadratic demand (thermal image)
The quadratic demand calculation model represents the conductor heat rise (thermal
image).
The heat rise created by the current I(t) over the time interval T is identical to that
created by a constant current Ith over the same interval. This current Ith represents
the thermal effect of the current I(t) over the interval T.
Calculation of the demand value according to the thermal model must be always be
performed on a sliding window.
Note: The thermal demand value is similar to an rms value.
Micrologic E control units use the quadratic model to calculate both demand current
and demand power.
Peak demand values
The Micrologic E trip unit calculates:
b the maximum (peak) demand values of phase and neutral currents since the last
reset
b the maximum (peak) demand values of total active power since the last reset.
The peak demand values can be accessed and/or reset in the following ways:
b peak demand current: via the Micrologic control unit (see page 25) or the
Communication option (see page 40)
b peak demand power: via the Communication option (see page 39).
52
04443724AA - 04/2011