1
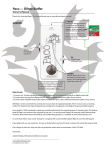
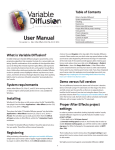
HIPPIE User Manual
(v0.0.2-beta, 2015/4/26, Yih-Chii Hwang, yihhwang [at] mail.med.upenn.edu)
● OVERVIEW OF HIPPIE
o Flowchart of HIPPIE
o Requirements
● PREPARE DIRECTORY STRUCTURE FOR HIPPIE EXECUTION
o Library (sample) directory and expected input fastq filename format
o Log directory: $HOME/hippie_stdout
● CREATE CONFIGURATION FILE
● PREPARE THE REFERENCE GENOME
● INSTALL PYSAM PYTHON PACKAGE
● INSTALL MATH::CDF PERL PACKAGE
● RUN HIPPIE
● THE PHASE MODE: PIPELINE EXECUTION
● THE TASK MODE: RUNNING SELECTED PORTIONS OF THE PIPELINE
● THE DEBUG MODE: DEBUGGING OPTION
● PHASES AND TASKS
o Phase 1: Read Mapping
o Phase 2: Quality Control
o Phase 3: Peak identification and functional annotation
o Phase 4: Prediction of enhancer–target gene interaction
o Phase 5: Character analysis of enhancer–target gene interactions
● THREE MAIN OUTPUT FILES AND THEIR FORMAT
o I. Restriction fragment-based interactions
o II. Interactions of promoter and their interacting partner
o III. Candidate enhancer element (CEE) and their target gene
1
Overview of HIPPIE
[↑top]
HIPPIE (High-throughput Identification Pipeline for Promoter Interacting Enhancer elements) is a
software package that takes batches of Hi-C raw reads as input and ultimately identifies enhancer–target
target gene relationships by mapping the reads to reference genome, calling peak fragments, detecting
DNA–DNA interactions with quality controls, and integrating functional epigenomics knowledge. It is designed
to be executing on Open Grid Scheduler system with memory and error control, as well as prerequisite control.
Flowchart of HIPPIE
[↑top]
A complete HIPPIE workflow run consists of four phases outlined in the following flowchart (Figure 1.).
Figure 1. HIPPIE flowchart.
Requirements
[↑top]
●
●
●
●
STAR https://github.com/alexdobin/STAR/releases (tested in 2.4.0h)
SAMtools http://sourceforge.net/projects/samtools/files/ (tested in 0.1.19-44428cd)
BEDtools https://github.com/arq5x/bedtools2 (tested in 2.19.1)
R http://www.r-project.org (tested in 3.1.0). Used R libraries are:
o gplots http://cran.r-project.org/web/packages/gplots/index.html
● Python (tested on python2.6)
o pysam https://github.com/pysam-developers/pysam (tested in 0.8.2.1)
● Perl (tested on 5.10.1). With modules:
o Math::CDF qw(:all) http://search.cpan.org/~callahan/Math-CDF-0.1/CDF.pm
o POSIX qw(ceil floor)
o List::Util
● awk, zcat, sort
Please set the absolute path for STAR, SAMtools, Bedtools, R, Python, and PERL5LIB (e.g. path to
Math::CDF) in hippie.ini (i.e. path/to/hippie/hippie.ini).
2
Prepare directory structure for hippie execution
[↑top]
HIPPIE operates on a per-library (sample) level. A “project” can contain multiple libraries (samples) and
each library resides in one directory. Each library directory has a command script (e.g. library1.sh) and subdirectories for the input fastq.gz files (fastq/) and output files (out/) and intermediate files (sam/, bed/) as
shown in Figure2. The user is required to prepare and maintain the input files based on this directory structure,
as well as describe information of each library of the project in a configuration file, including paths for the
project, reference genome, and reference epigenetics (e.g. histone modification sites, DNAse hypersensitive
sites) data, etc.
Figure 2. The directory structure set up of HIPPIE. The shaded (grey) directories and files have to be prepared by the
users, and the white directories are automatically generated by HIPPIE based on the configuration file.
In this manual, we will use "Hi-C_Project" as an example project name. The names of the libraries sequenced
are “library1”, “library2”, “library3”, etc.
Library (sample) directory and expected input fastq filename format
[↑top]
Each library can contain multiple paired-end fastq.gz files as long as the reads contained are from the same
library with the same technical condition. The fastq.gz files need to be stored in each individual sample's fastq
sub-directories (e.g. test_data/Hi-C_project/library1/fastq/), and they need to be compressed by gzip
(with the file name formatted as *.fastq.gz). HIPPIE recognizes paired-end fastq files with the name formatted
as [filename]_1.fastq.gz with [filename]_2.fastq.gz or the Illumina convention file name format as
[filePrefix]_R1_[filePostfix].fastq.gz with [filePrefix]_R2_[filePostfix].fastq.gz. Note the two fastq.gz files of
a pair need to be the same format as each other.
Log directory: $HOME/hippie_stdout
[↑top]
Under Open Grid Scheduler, the screen output from running jobs is redirected to a log file. HIPPIE stores all
such log files in a “hippie_stdout/” directory under user’s home directory. You need to create it before
running HIPPIE.
$ mkdir -p ~/hippie_stdout
3
Create configuration file
[↑top]
Please refer to the template file named “project_configure.cfg” for the example. Use this file to specify the
project-specific characteristics and information of the libraries sequenced, including the cell types, the
restriction enzyme used, if the enzyme is a 4bp cutter or 6bp cutter, the size selection parameter, the reference
genome, epigenetics tracks (ChIP-seq peaks, DNase-seq hotspots), as well as the research project name.
We suggest users separate the analyses of Hi-C for different organisms or species by creating different project
directories. This can prevent confusion of the reference genome and clarify the epigenetics data usage.
Prepare the reference genome
[↑top]
Please first prepare the reference genome sequence in FASTA format (.fa file), and run STAR with option of -runMode genomeGenerate to generate the index of the reference genome. See below example for human
genome hg19 assembly:
1. Find the reference genome at: http://hgdownload-test.cse.ucsc.edu/goldenPath/hg19/bigZips/hg19.2bit
and use the UCSC utility program, twoBitToFa, to extract the .fa from this file (from
http://hgdownload.cse.ucsc.edu/admin/exe/linux.x86_64/).
2. Generate the index file with the corresponding STAR version for the reference genome (e.g. hg19.fa)
for STAR alignment.
$ STAR --runMode genomeGenerate --genomeDir .
--genomeFastaFiles ./hg19.fa
The index will be generated under the same directory of hg19.fa. After the index is generated, set the path to
the hg19.fa to GENOME_REF under in your configuration file (i.e. “project_configure.cfg”).
Install pysam Python Package
[↑top]
HIPPIE uses python package pysam to parse the mapped bam file and translate the paired-end reads to bed
format. To install the package, use either pip install or follow the following steps:
1. Please set up PYTHONPATH at /home/username/lib64/python2.6/site-packages
$ export PYTHONPATH=/home/username/lib64/python2.6/site-packages
*Note this step (set up PYTHONPATH) may be necessary before building and installing the package.
The PYTHONPATH needs to be consistent with the python version (e.g. python2.6) you are using.
2. Please download the module file (e.g. pysam-0.8.2.1.tar.gz) from pypi at:
https://pypi.python.org/pypi/pysam.
3. Untar the tar.gz file and follow the installation instruction. We suggest installing the module under user’s
home directory ($HOME), so that all cluster nodes can locate it.
$ tar jzvf pysam-0.8.2.1.tar.gz
4
$ cd pysam-0.8.2.1
$ python2.6 setup.py build
$ python2.6 setup.py install –prefix=$HOME
Install MATH::CDF Perl Package
[↑top]
HIPPIE uses perl package MATH::CDF to estimate the P value of each interaction. To install the package, use
either CPAN or follow the following steps:
1. Please download the module file (Math-CDF-0.1.tar.gz) from CPAN at:
http://search.cpan.org/~callahan/Math-CDF-0.1/CDF.pm.
2. Untar the tar.gz file and follow the installation instruction. We suggest installing the module under user’s
home directory ($HOME), so that all cluster nodes can locate it.
$
$
$
$
$
tar zxvf Math-CDF-0.1.tar.gz
cd Math-CDF-0.1
perl Makefile.PL PREFIX=$HOME
make
make install
3. Update the path to MATH::CDF to PERL5LIB by simply adding the path to hippie.ini:
$ export PERL5LIB=$PERL5LIB:$HOME/lib64/perl5
Run HIPPIE
[↑top]
Each library has its own individual directory and sub-directories as in Figure 2. Once execute the configuration
file, a tailored bash script file (.sh) that contains all the commands to complete the analysis will be propagated
to each library directory. To achieve this, we describe how to execute the configuration file.
Once you have prepared the configuration file (i.e. project_configure.cfg), follow the steps below to
execute it.
i.
Change directory to the project directory (i.e. Hi-C_Project/).
$ cd path/to/Hi-C_Project
ii.
Run HIPPIE with the initiation file (-i) and the configuration file (-f) to generate the tailored bash script
for each library.
$ ./hippie.sh -i path/to/hippie.ini -f project_configure.cfg [-h HIPPIE_HOME_DIR]
●
●
●
–i – specifies the location of the initiation file
-f – specifies the location of the project configuration file
-h HIPPIE_HOME_DIR – optionally specify the location of the HIPPIE home directory. Otherwise
it would use the environment variable $HIPPIE_HOME in hippie.ini
This would create the library-level directories (sam/, bed/, and out/). Under each library directory there
5
would be a launching script with a name in this format: “library1.sh.”
In the next several sections we describe the different ways of using the launching script for each library.
Once the pipeline is finished, the ultimate output files will be generated under out/ directory of each library.
The three main output files are:
(1) restriction fragment interactions (i.e. library1_95_interaction_pvalue.bed),
(2) Interaction of promoter (gene) to their partners (i.e. library1_95_partnerTogene.bed), and
(3) Candidate enhancer element and their target gene(s) (i.e. library1_95_CEE_gene_sig.bed for the pairs
pass the significant level (P <= 0.1), library1_95_CEE_gene.bed for all identified.)
The phase mode: pipeline execution
[↑top]
After executing hippie.sh, each library will have its own individual sub-directories generated as well
as the bash script (i.e. library1.sh) propagated under the library directory. The entire HIPPIE pipeline can be
divided into five phases, which can be run individually and sequentially.
The procedure of running each of the four phases is the same: First change directory to the library directory
and begin the analysis process by the phases. I.e. phase1 (p1), phase 2 (p2), phase 3 (p3), phase 4 (p4), and
phase 5 (p5). The tasks of the phases are chained together and the submitted jobs are designed to run only
after the prerequisite jobs are finished.
$ cd path/to/Hi-C_Project/library1/
$ ./library1.sh -p1
$ ./library1.sh -p2
$ ./library1.sh -p3
$ ./library1.sh –p4
$ ./library1.sh –p5
“Multiple phases” is also acceptable. That is, users can submit phase 1 through phase 5 all at once.
$ ./library1.sh -p1 –p2 –p3 –p4 -p5
The phase mode can operate with the debug mode (details see below).
The task mode: running selected portions of the pipeline
[↑top]
Task mode allows you to run any single tasks of HIPPIE.
$ cd path/to/Hi-C_Project/library1/
$ ./library1.sh -t TASKNAME
● -t TASKNAME – the single task to run
The task mode can also operate along with the debug mode. The tasks are chained together, thus the
6
following jobs will only run after their consecutively prerequisite job is finished. Thus, one can skip the first task,
but consecutively submit jobs for the second task and the third task. For example:
$ ./library1.sh -t SECOND_TASKNAME
$ ./library1.sh -t THIRD_TASKNAME
The debug mode: debugging option
[↑top]
Debug mode does not submit jobs. Instead, the full command(s) that would be submitted is displayed
on the screen. The -d option must be followed by any flag that would normally submit a task or sequence of
tasks such as -p1, -p2, -p3, or -t.
$ cd path/to/Hi-C_Project/library1/
$ ./library1.sh -d -p1
●
●
-d – debug mode; previews the qsub command that would be submitted
-p – runs the steps for phase 2, when preceded by -d, the jobs would not be submitted. Instead,
the full command(s) would be displayed.
Debug mode works with any combination of task submitting flags
$ cd path/to/Hi-C_Project/library1/
$ ./library1.sh -d -p2 -p3
$ ./library1.sh -d -t annotateFragment
Phases and tasks
Phase 1: Read Mapping
[↑top]
[↑top]
Phase 1 takes the Hi-C reads (fastq.gz files) and aligns them to the reference genome. We strongly
suggest users run all three tasks of phase 1 as a whole (i.e. ./library1.sh –p1), and not to run them as
separated tasks. If necessary users can run the three tasks as below:
i.
Load the genome to the shared memory of each node for mapping.
$ cd path/to/Hi-C_Project/library1/
$ ./library1.sh -t loadGenome
The required memory will be automatically determined by the size of the genome (e.g. hg19
requires ~27.2GB and Drosophila Melanogaster requires ~2GB of memory).
ii.
Read mapping to genome using STAR. Task loadGenome is its prerequisite task.
$ ./library1.sh -t starMapping
7
The output files are stored in the sam/ directory.
iii.
Remove the genome from the shared memory of each node after mapping is done. Task
starMapping is its prerequisite task.
$ ./library1.sh -t rmGenome
Phase 2: Quality Control
[↑top]
Phase 2 takes the aligned reads and further processes them with mapping quality control. First, it
rescues the chimeric read that span the ligation sites with reasonable distances and strand combinations, and
transforms the bam file to a bed file. Then, it removes the duplicates that may be due to PCR artifacts, discards
read mapped to random contigs.
i.
Basic statistics for the mapped/alignment file. Task samtoolsMergeBam of phase 1 is its
prerequisite task.
$ cd path/to/Hi-C_Project/library1/
$ ./library1.sh -t pairingBam
The output files are stored in the bed/ directory: SRRXXXX_1.bed, SRRXXXXX represent their original
fastq file name.
ii.
Remove possible PCR artifacts (the duplicate read pairs). Task pairingBam is its prerequisite task.
$ ./library1.sh -t rmdupBed
The output files are stored in the bed/ directory: SRRXXXXXXX_1_rmdup.bed; SRRXXXXXXX represents
their original fastq file name.
Phase 3: Peak identification and functional annotation
i.
[↑top]
Calculate the distance of each pair of reads to their closest upstream or downstream restriction
sites and classify the reads to specific read pairs or non-specific read pairs based on the size
selection parameter. Task rmdupBed of phase 2 is its prerequisite task.
$ cd path/to/Hi-C_Project/library1/
$ ./library1.sh -t getDistanceToRS
The output files are stored in the bed/ directory: SRRXXXXXXX_1_rmdup_distToRS.bed,
SRRXXXXXXX_1_specific.bed, and SRRXXXXXXX_1_nonspecific.bed; SRRXXXXXXX represents their original
fastq file name.
ii.
Aggregate the mapped reads from each fastq.gz file and segregate specific and non-specific reads
by the distances from the read to the closest restriction site. Task getDistanceToRS is its
prerequisite task.
$ ./library1.sh -t collapseData
8
The output files are stored in the bed/ directory, and output files are named by the library from now on:
library1_specific.bed, and library1_nonspecific.bed.
iii.
Sort out each read by if it participates in a specific read or non-specific read pair. Task
collapseData is its prerequisite task.
$ ./library1.sh -t consecutiveReadsS
$ ./library1.sh -t consecutiveReadsNS
The output file is stored in the bed/ directory: library1_consecutive_m500.bed and
library_consecutive_NS.bed.
iv.
Get list of restriction fragments with number of reads. Tasks consecutiveReadsS and
consecutiveReadsNS are both its prerequisite tasks.
$ ./library1.sh -t getFragmentsRead
The output file is stored in the bed/ directory: HindIII_fragment_S_reads.bed and
HindIII_fragment_NS_reads.bed. Depends on the restriction enzyme used, here we use HindIII as
an example.
v.
Call Hi-C peaks in the unit of restriction fragment. Task getFragmentsRead is its prerequisite task.
$ ./library1.sh -t getPeakFragment
The output file is stored in the bed/ directory: library1_HindIIIfragment_S_reads_95.bed. Here we
use 95% upperbound coverage threshold as an example.
vi.
Annotate the genetics feature of the Hi-C peaks. Task getPeakFragment is its prerequisite task.
$ ./library1.sh -t annotateFragment
The output file is stored in the bed/ directory: library1_HindIIIfragment_95_annotated.bed.
Phase 4: Prediction of enhancer–target gene interaction
i.
[↑top]
Identify peak–peak interactions. Task annotateFragment of phase 3 is its prerequisite task.
$ cd path/to/Hi-C_Project/library1/
$ ./library1.sh -t findPeakInteraction
The output file is stored in the bed/ directory: for intra- chromosomal interactions:
chr*_95_reads_interaction.txt and for inter- chromosomal interactions:
library1_interChrm_95_reads_interaction.txt.
ii.
Correct Hi-C bias from the interacting contacts. findPeakInteraction of phase 4 is its
prerequisite task.
$ ./library1.sh -t correctHiCBias
9
The output file is stored in the bed/ directory: for intra- chromosomal interactions:
chr*_95_reads_interaction_pvalue.txt and for inter- chromosomal interactions:
library1_interChrm_95_reads_interaction_pvalue.txt.
iii.
Identify promoter annotated peak–peak interaction. correctHiCBias of phase 4 is its prerequisite
task.
$ ./library1.sh -t findPromoterInteraction
The output file is stored in the bed/ directory: for intra- chromosomal interactions:
chr*_95_promoter_annotated_interaction_promoterAnno.txt and
chr*_95_promoter_annotated_promoterInteraction_pvalue.txt and for inter- chromosomal
interactions: library1_95_interChrm_promoterInteraction.txt and
library1_interChrm_95_reads_interaction_pvalue.txt.
iv.
Identify promoter interacting enhancer elements (also known as candidate enhancer elements,
CEE). Task findPromoterInteraction is its prerequisite task.
$ ./library1.sh -t getCeeTarget
From now on, the output files are stored in the out/ directory: library1_95_CEE_gene.bed.
Phase 5: Characters analysis of enhancer–target gene interactions
i.
[↑top]
Calculate distance distribution between enhancers and their targets/closest genes. Task
getCeeTarget is its prerequisite task.
$ ./library1.sh -t ETdistance
The output file is stored in the out/ directory: library1_95_ET_distance.txt.
ii.
Enrichment analyses for regulatory associated histone marks within enhancer elements and other
interactions, and plot the enrichment bar figure. Task getCeeTarget is its prerequisite task.
$ ./library1.sh -t histoneEnrichment
$ ./library1.sh –t plotHisEnrichment
The output file is stored in the out/ directory: histone_enrichment.txt and
library1_histone_enrichment.jpg.
iii.
Enrichment analyses of GWAS hit within the enhancer elements. Task getCeeTarget is its
prerequisite task.
$ ./library1.sh -t GWASEnrichment
The output file is stored in the out/ directory: library1_95_GWAS_enrichment.txt.
10
Three main output files and their format
I. Restriction fragment-based interactions
[↑top]
[↑top]
Location: Hi-C_Project/library1/out/
File name(s): e.g. library1_95_interaction_pvalue.bed.
Column descriptions:
1: fragment1 (chrm:start-end, start position is 0-based, and end position is 1-based).
2: fragment2.
3: P value (adapted from Jin et al. Nature (2013)), by binning GC content, mappability, fragment length
and distance (if the two partners are on the same chromosome).
4: number of Hi-C read pairs support the interaction.
5: number of Hi-C reads spreading on fragment1.
6: number of Hi-C reads spreading on fragment2.
II. Interactions of promoter and their interacting partner
[↑top]
Location: Hi-C_Project/library1/out/
File name(s): library1_95_partnerTogene.bed
Column descriptions:
1-3: bed coordinates (chr, start, end) of the restriction fragment interacting to a promoter fragment.
4: gene name (symbol) and the promoter coordinate (e.g. CENPL;DARS2=chr1:173793270-173794277
in the format of “gene_symbol=chrm:start-end”). If there are promoters sharing by multiple genes, the promoter
coordinates is merged and the corresponding symbols are separated by “;”. If there are multiple promoters
located on the same restriction fragment, the gene symbols are aggregated and separated by “,” (no promoter
coordinates merging in the latter case).
5: P value of the interaction.
6: number of Hi-C read pairs support the interaction.
III. Candidate enhancer element (CEE) and their target gene [↑top]
All detected candidate enhancer elements and their target genes:
Location: Hi-C_Project/library1/out/
File name(s): library1_95_CEE_gene.bed
Column descriptions:
1-3: bed coordinates (chr, start, end) of the restriction fragment interacting to a promoter region.
4: target gene(s) touched by the active enhancer restriction fragment. If multiple genes are targeted by
the same enhancers, they are aggregated and separated by “|”.
5: number of fragments (with promoter overlapped) targeted by this CEE.
Significant pairs (P value <=0.1) of enhancer and their target genes:
Location: Hi-C_Project/library1/out/
File name(s): library1_95_CEE_gene_sig.bed
Column descriptions:
Same as above.
11